Fuxi Hexagram Oscillation Signal Alert Indicator
- 지표
-
Ge Senlin
 Quantitative strategy researcher, program trading developer
Professional foreign exchange EA development, block chain project development
github blog https://github.com/yyy999 - 버전: 3.0
- 활성화: 5
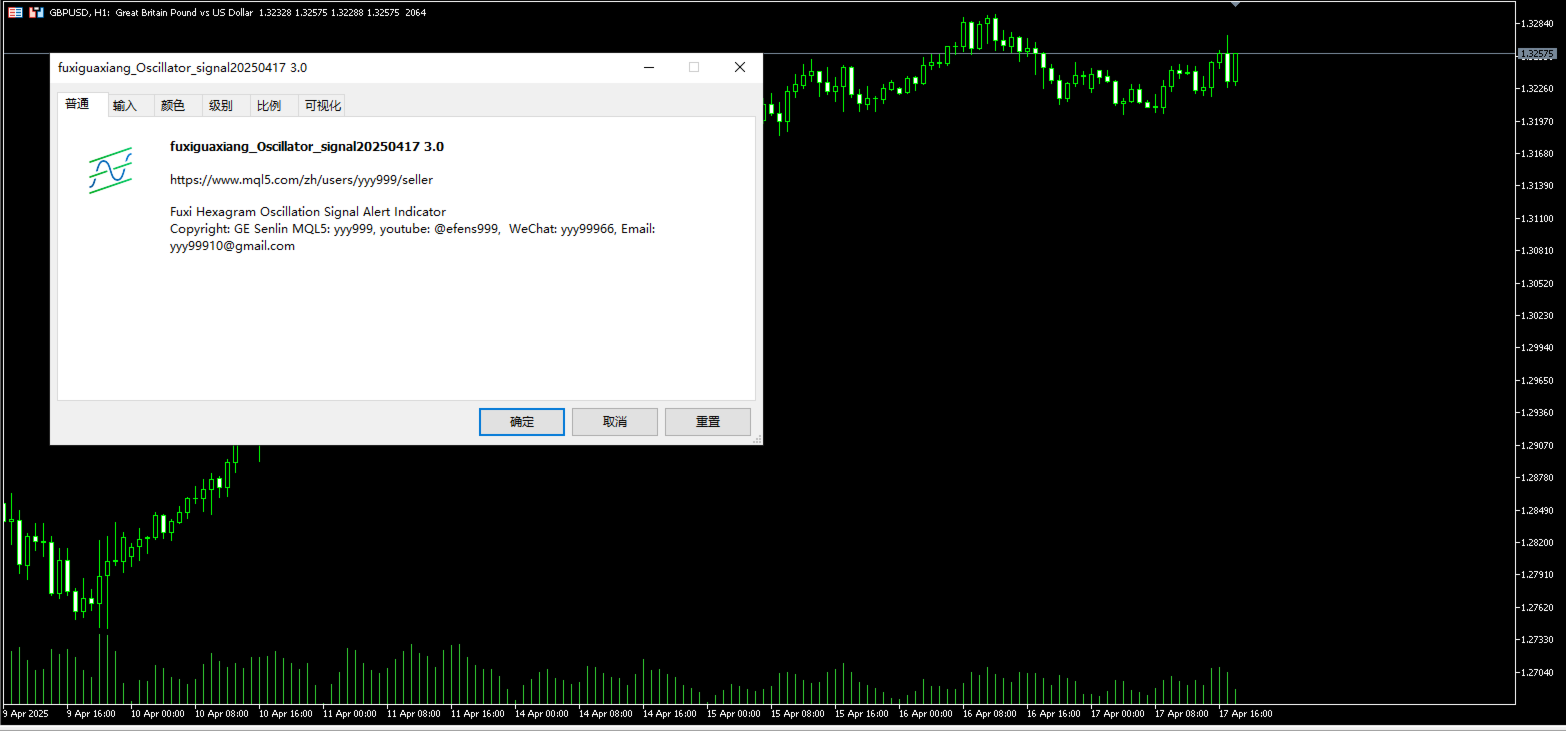
Fuxi Hexagram Oscillation Signal Alert Indicator
— An Innovative Trading Tool Combining I Ching Philosophy with Modern Quantitative Analysis
1. Product Overview
The Fuxi Hexagram Oscillation Signal Alert Indicator is a cutting-edge technical analysis tool that integrates ancient Chinese I Ching (Book of Changes) philosophy with modern financial market data analysis. By converting K-line (candlestick) chart behavior into dynamic hexagram structures, the indicator provides traders with real-time trend prediction, oscillation signals, and intelligent alerts.
2. Core Mechanism & Technology
1. Hexagram Formation Based on K-lines
Using the six-line hexagram structure from the I Ching, every six candlesticks are interpreted as a complete hexagram. Each candlestick's bullish or bearish nature is mapped to yin or yang lines, reflecting market sentiment and multi-dimensional trend dynamics.
2. Oscillation Signal Recognition
The indicator calculates the strength and direction of market oscillations based on the evolution of hexagram patterns. This information is visualized and used to trigger alerts at key decision points.
3. Multi-Dimensional Visualization & Smart Alerts
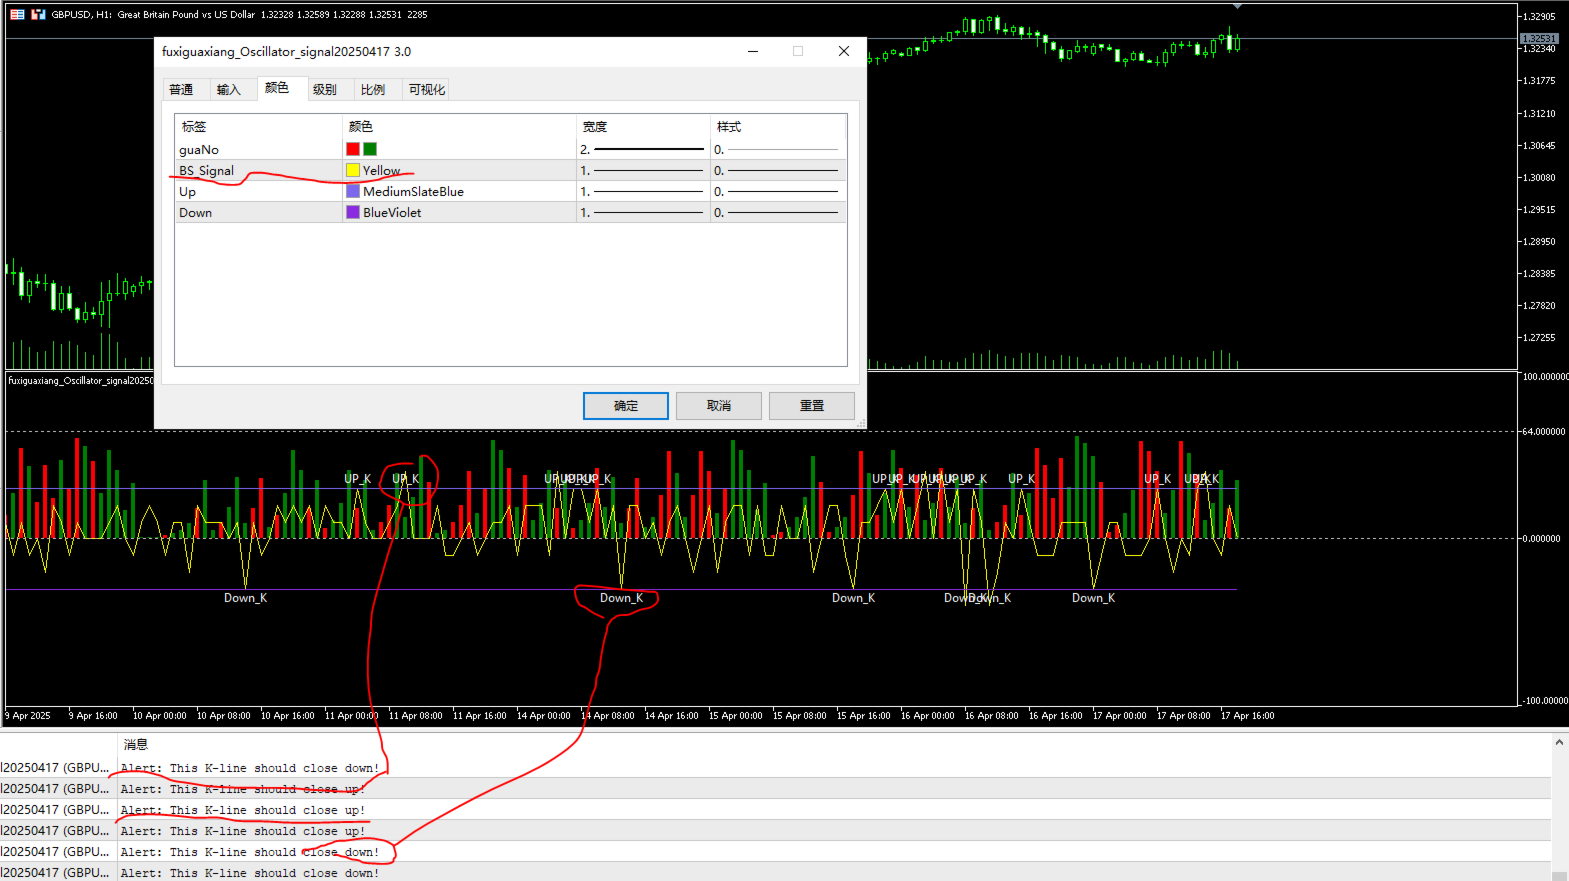
In a dedicated sub-window, the indicator displays:
- Hexagram Bars (Two-Color Histogram): Visualizing hexagram type and directional bias for each candle.
- Oscillation Signal Line (Yellow Polyline): Quantifies market volatility and energy.
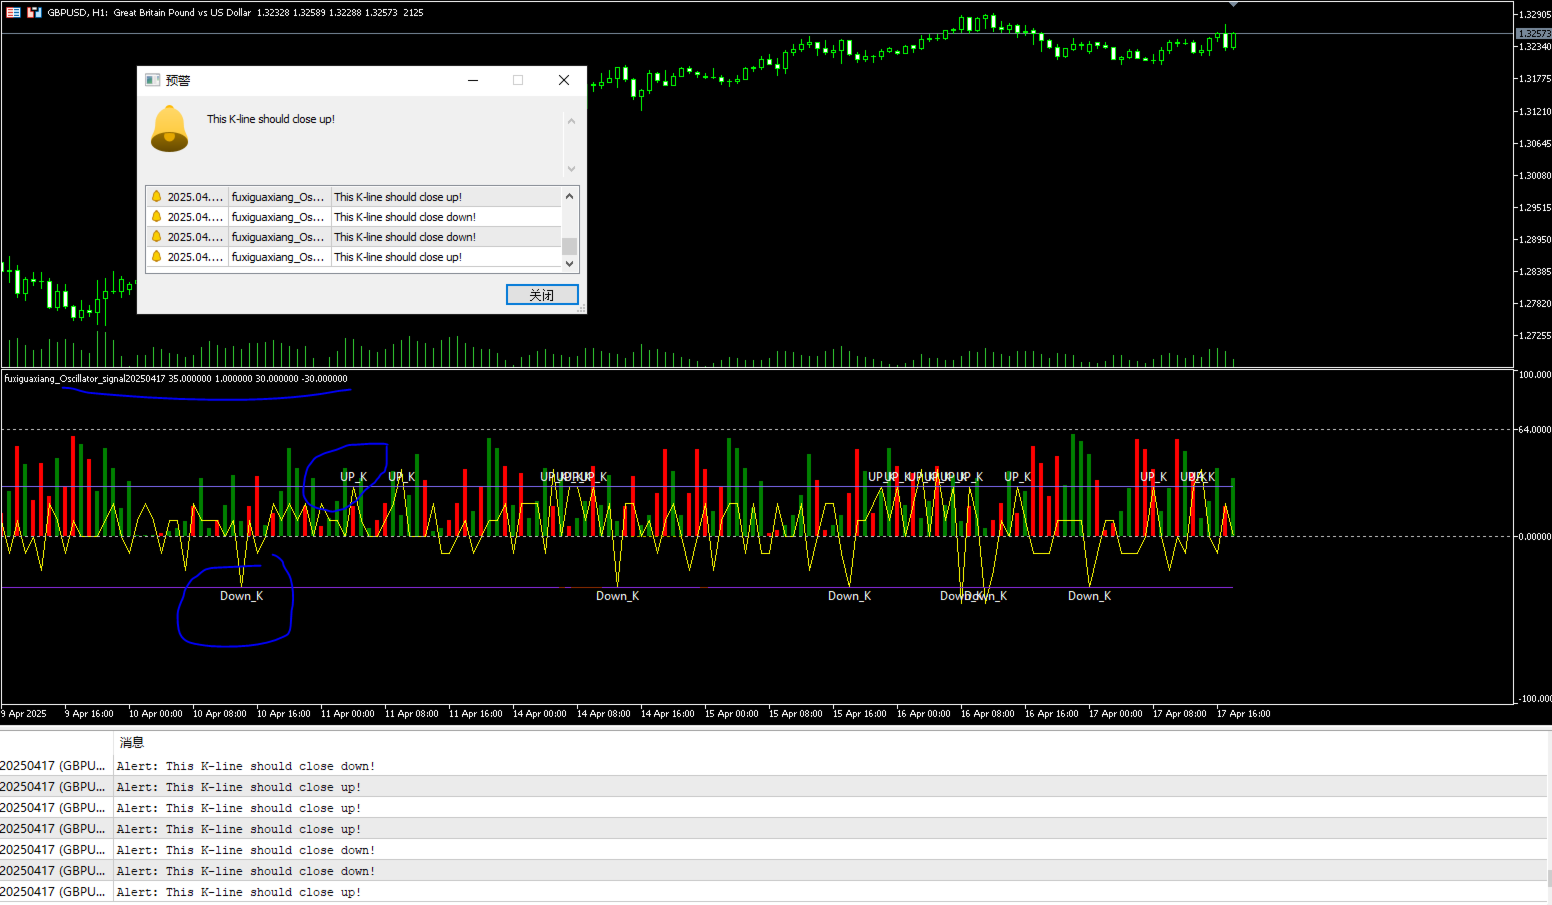
- Upper/Lower Alert Lines: Configurable thresholds to trigger voice, popup, and text-based alerts.
3. Key Features & Advantages
| Feature | Description |
| Innovative Predictive Model | Replaces traditional 2–3 candle combinations with a 6-candle hexagram model, delivering deeper market insight. |
| Multi-Timeframe Compatible | Supports all timeframes (from M1 to Monthly); updates in real-time with each new candle. |
| Open Architecture | Designed for both manual traders and algorithmic systems, with clear data outputs for EA and AI integration. |
| Optimized Performance | Simplified hexagram presentation (without symbolic images or complex names) ensures high-speed performance and robust operation. |
| Intuitive Visualization | Combines bar graphs, signal lines, and alerts for an easy-to-read yet powerful trading assistant. |
4. Input & Output Parameters
Output Parameters (for strategy systems or EA integration):
- Hexagram Number: Integer value representing current hexagram classification.
- Signal Line: Real-time oscillation intensity (float).
- Upper Alert Line / Lower Alert Line: Customizable alert thresholds.
- Alert Outputs: Text, audio, and popup alerts upon signal triggering.
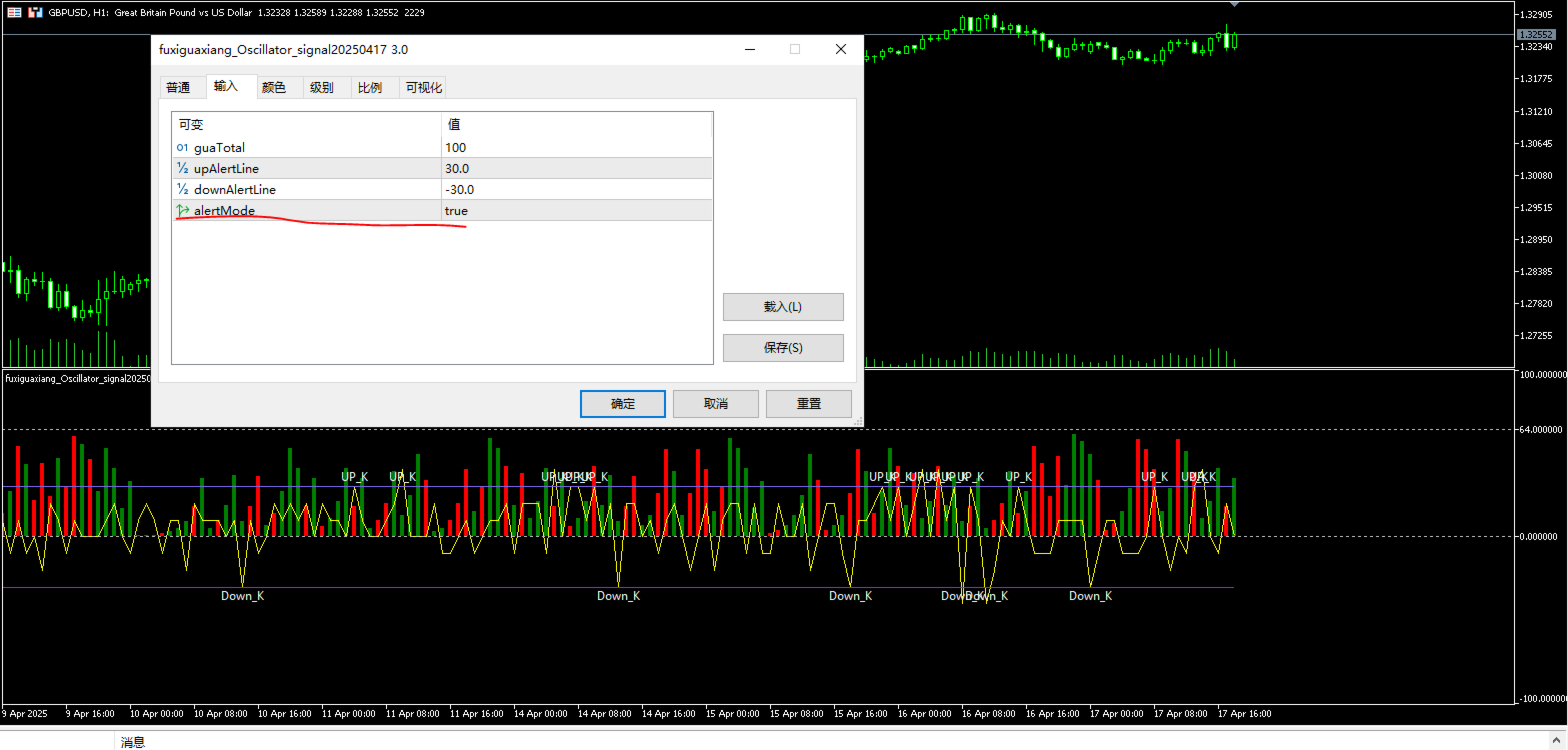
Input Parameters (user-defined settings):
- Hexagram Calculation Period: Default is 100 candlesticks.
- Upper/Lower Alert Line Values: Set manually to define market entry/exits.
- Alert Switch: Toggle all alert notifications.
input int guaTotal = 100;
input double upAlertLine = 30;
input double downAlertLine = -30;
input bool alertMode = true;
5. Application Scenarios
- Retail Traders: For identifying trend reversals or confirmation signals in real-time.
- Quantitative Developers: To build EA/algorithmic strategies based on hexagram pattern logic.
- AI-Driven Platforms: Integrated as a feature module in intelligent trading systems.
- Financial Education: A unique blend of Eastern philosophy and modern trading analytics for academic or professional training purposes.
6. Conclusion
The Fuxi Hexagram Oscillation Signal Alert Indicator offers a revolutionary approach to market prediction by combining the time-tested wisdom of the I Ching with data-driven technical analysis. It equips traders and systems with a deeper understanding of market rhythms, enhancing both discretionary and automated trading performance.
For custom development, enterprise licensing, EA integration, or technical documentation, please contact our team for further details.