PTS Divergence Buy Finder MT5
- 지표
- 버전: 2.0
- 활성화: 10

PTS - Precision Trading Systems의 Divergence Buy Finder
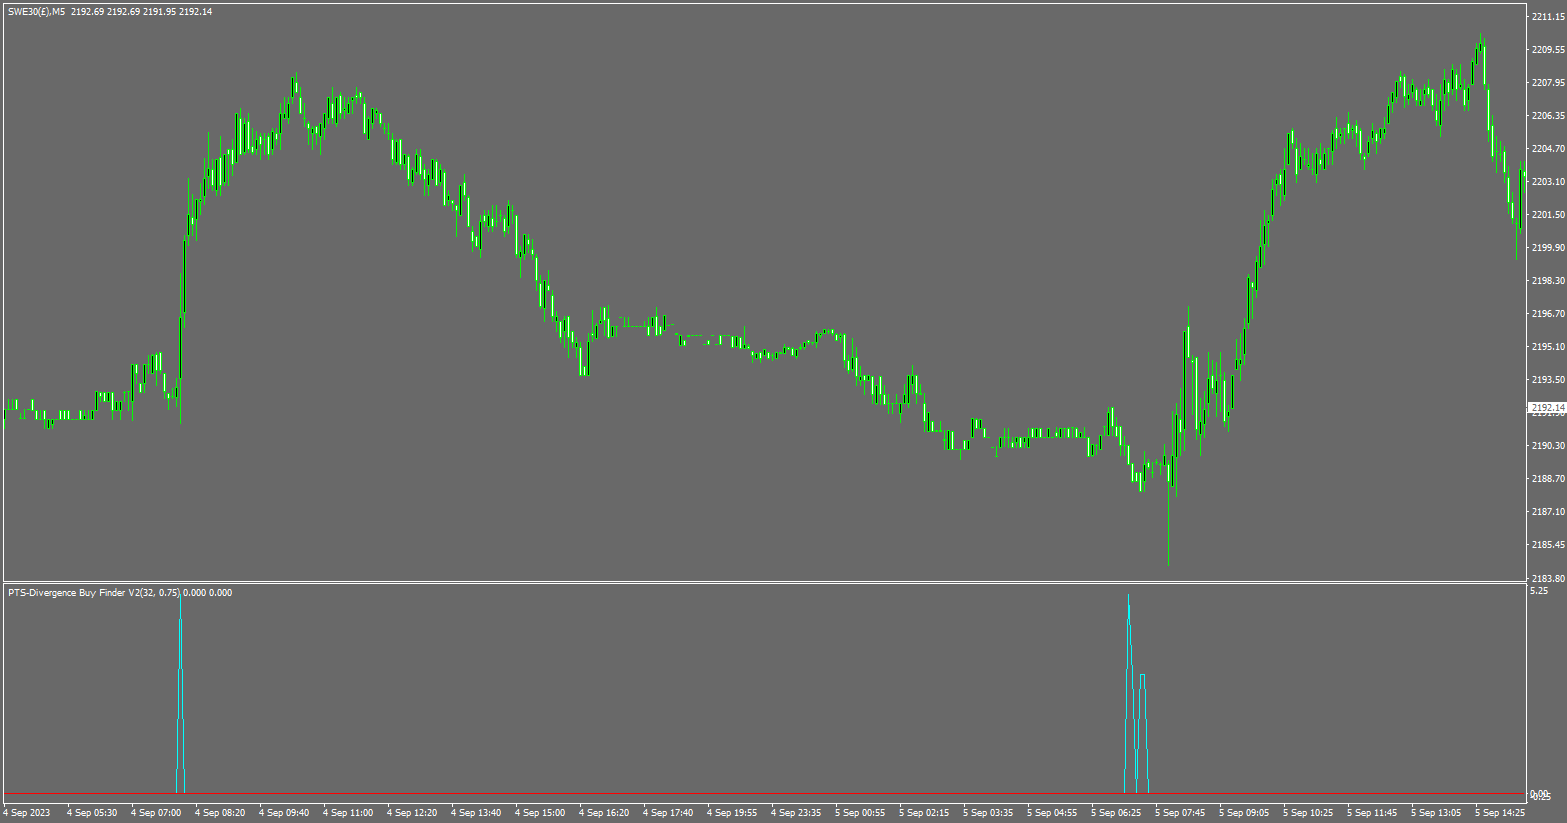
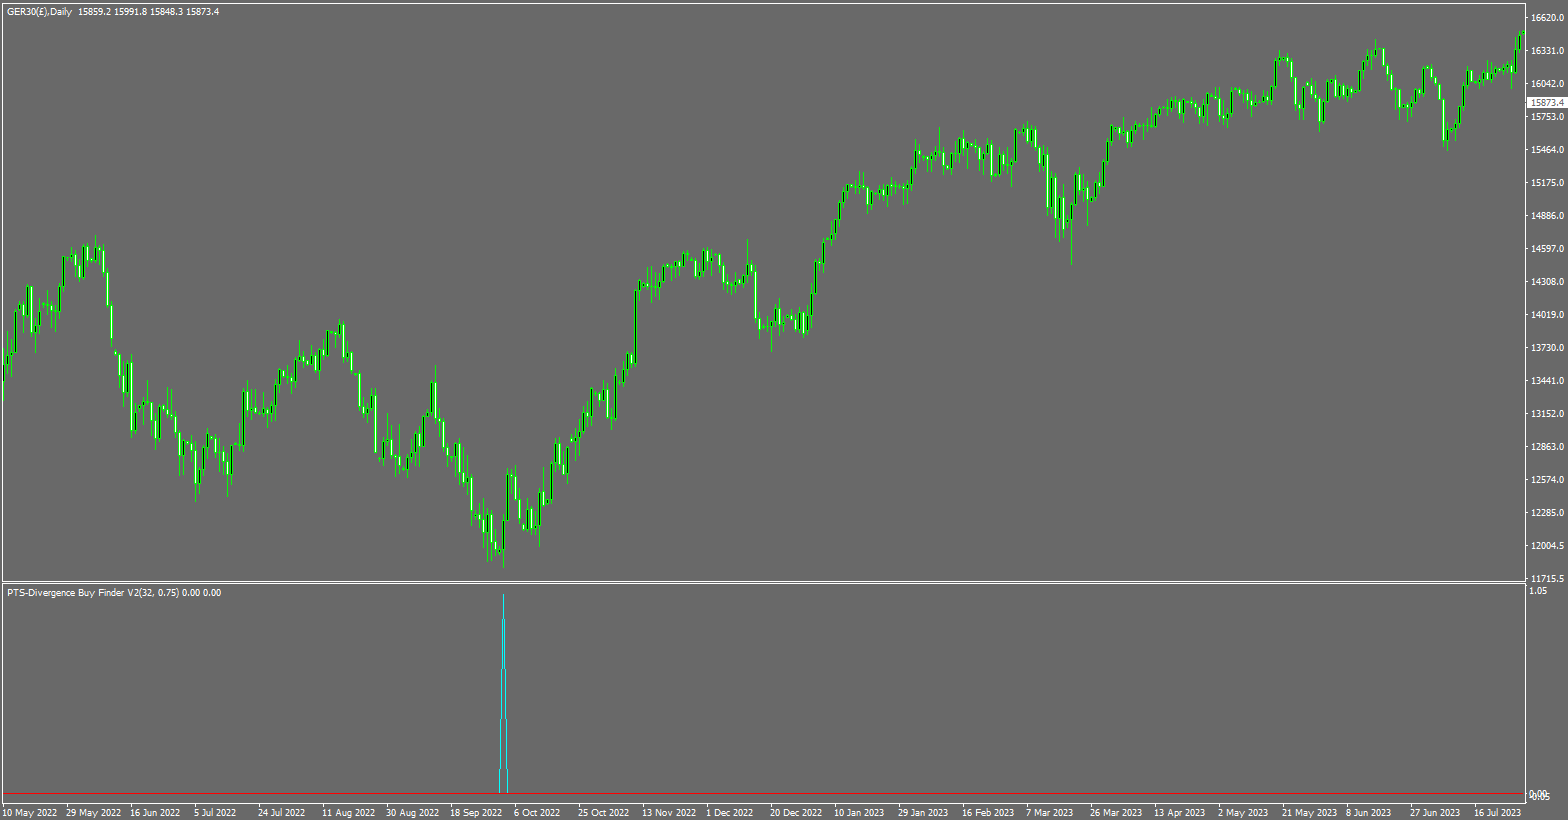
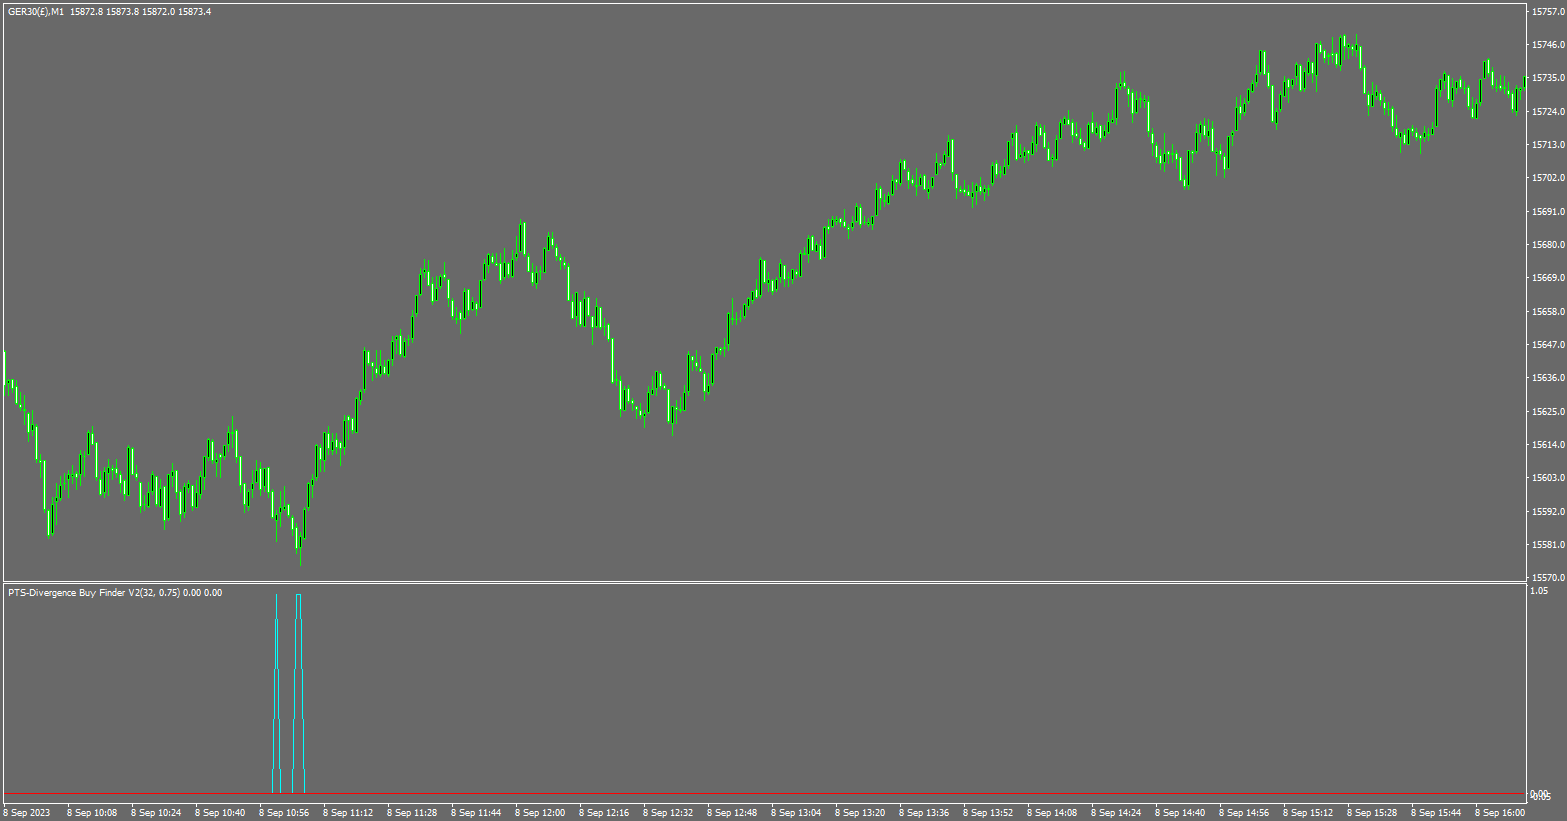
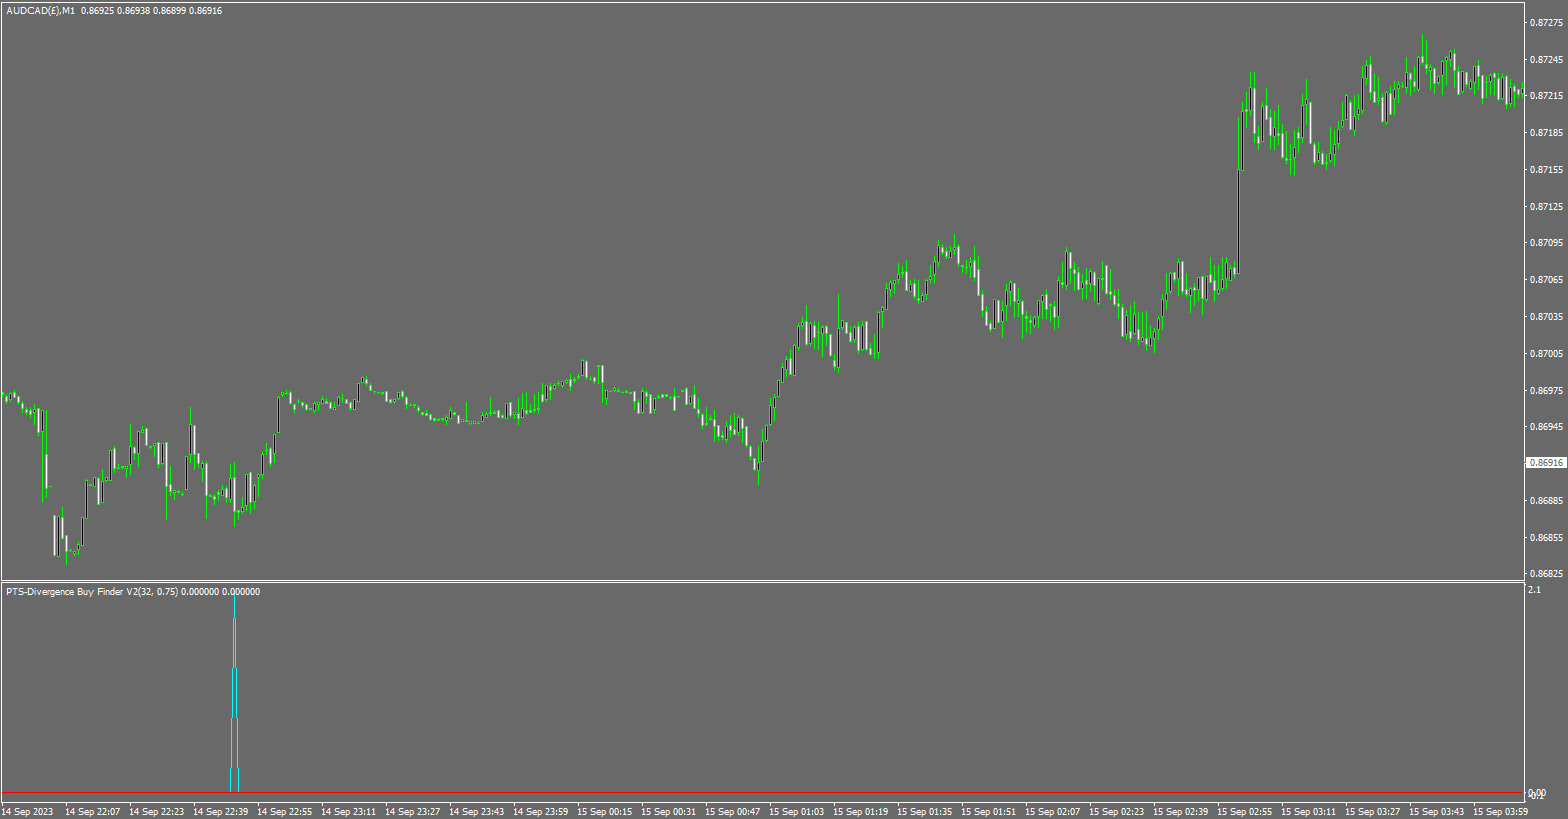
Precision Divergence Finder는 시장 바닥을 핀포인트 정확도로 찾아내도록 설계되었으며 이를 자주 수행합니다.
기술적 분석에서 바닥을 고르는 기술은 일반적으로 정상을 선택하는 것보다 훨씬 쉽습니다. 이 항목은 정확히 이 작업을 위해 설계되었습니다. 상승 Divergence가 식별되면 구매하기 전에 트렌드가 반등할 때 기다리는 것이 현명합니다. 10 또는 20 바 높음을 사용하거나 이전 바의 이동 평균 15-30이 상승하는 것을 식별하기 위해 사용할 수 있습니다.
복잡한 알고리즘은 실시간 바 단위로 활성 Demand Index(DI) Divergence 수를 찾아내고 계산합니다.
모델은 시장 가격이 새로운 최저점을 기록하고 Demand Index가 새로운 최저점을 기록하지 않을 때 Divergence를 발생시키는 것을 관찰합니다.
이 지표는 두 가지 설정을 사용합니다.
1. DI 길이: 이 설정은 지표에 찾을 것을 제공하며 선택한 길이의 DI Divergence를 찾아냅니다.
2. 차이: 이는 [현재 DI 값]과 [이전 200개의 DI 값] 간의 Divergence 양이며 다양한 역방향 기간에서 찾아낸 각 Divergence에 대해 지표 창에 [1] 출력을 생성합니다.
총 20 개의 기간이 최대 200 개의 바를 검사하므로 표시되는 최대 출력 값은 20입니다.
제안되는 설정:
- DI 길이가 15에서 100까지의 범위는 작동하지만 20에서 60 사이의 길이가 가장 좋습니다.
- Divergence의 차이는 0.1에서 20까지입니다 (보통 0.75에서 5가 최적이며 데이터 공급량에 따라 훨씬 큰 최적값이 될 수 있음).
- 틱 볼륨을 사용하는 경우 이러한 설정이 권장됩니다. 그러나 거래 볼륨이 있는 경우 10배 더 큰 차이 값을 사용합니다.
DI 길이 20 = 0.95 - 5의 차이
DI 길이 30 = 0.85 - 4의 차이
DI 길이 40 = 0.75 - 4의 차이
DI 길이 50 = 0.25 - 3.5의 차이
DI 길이 60 = 0.2 - 3의 차이
DI 길이 70 = 0.15 - 2.5의 차이
DI 길이 80 = 0.1 - 2의 차이
DI 길이 90 = 0.1 - 1.8의 차이
DI 길이 100 = 0.1 - 1.7의 차이
대부분의 MT4 사용자는 틱 볼륨을 사용하므로 추천 값 표가 좋은 시작점이 될 것입니다.
제발 알림 푸시를 사용하지 않습니다. 저에게 연락하려면 MT4에서가 아닌 몇 주 동안 메시지를 보지 못할 테니 웹 사이트를 통해 이메일을 보내주시기 바랍니다.