 MetaTrader 5
 Experts
 지표
 라이브러리
 유틸리티
 위젯
 규칙
MetaTrader 5용 유료 기술 지표 - 44
 기술 지표의 시그널은 주식 및 외환 시장에서 거래를 개시 및 종료하는 데 중요한 역할을 합니다. 지표의 본질은 미래의 가격 변화를 예측하기 위한 금융 시그널 값의 수학적 변형입니다.
기술 지표를 테스트하여 시장 행동과 그로 인한 이익을 더 잘 예측할 수 있습니다.

KT Forex Volume은 통화쌍의 매수 및 매도 거래량을 컬러 히스토그램 형태로 표시합니다. 거래량은 자산에 대한 매수 및 매도 거래로 구성됩니다. FX 시장에서: 매수량이 매도량보다 많으면 해당 통화쌍의 가격은 상승하는 경향이 있습니다. 매도량이 매수량보다 많으면 해당 통화쌍의 가격은 하락하는 경향이 있습니다.
주요 기능 틱 볼륨 데이터를 활용하여 나쁜 거래를 피할 수 있습니다. 시장 내 큰 자금을 움직이는 플레이어의 방향에 따라 거래할 수 있도록 도와줍니다. Metatrader의 모든 알림 기능이 포함되어 있습니다.
틱 볼륨 활용하기 기타 시장과 달리, 현물 외환 시장은 중앙 집중식이 아니기 때문에 개인 트레이더가 실제 볼륨 데이터를 얻는 것은 매우 어렵습니다. 2011년 베테랑 외환 트레이더 Caspar Marney가 발표한 연구에서는 틱 볼륨과 실제 거래량 사이에 높은 정확도와 상관관계가 있다고 결론지었습니다.
히스토그램 계산 공식
KT Forex Volume 지표
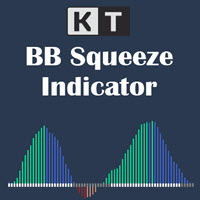
모멘텀이 확장되기 전 변동성 수축 확인 KT BB Squeeze는 변동성 상태와 모멘텀 방향을 하나의 선명한 오실레이터에 결합합니다. Bollinger Bands와 Keltner Channels를 비교하여 시장의 수축 또는 확장 상태를 표시하고, 히스토그램으로 제로선을 기준으로 한 모멘텀 변화를 보여 줍니다. 회색 점: Bollinger Bands가 Keltner Channels 안에 있으며 스퀴즈 또는 수축 구간을 나타냅니다. 흰색 점: Bollinger Bands가 Keltner Channels 밖에 있으며 확장 구간을 나타냅니다. 제로선을 기준으로 네 가지 모멘텀 상태 확인 색상 히스토그램은 방향과 강도를 구분하므로 상승 또는 하락 모멘텀이 강해지는지, 약해지기 시작하는지 쉽게 살펴볼 수 있습니다. 녹색 막대: 상승 모멘텀이 제로선 위에서 강해지고 있습니다. 파란색 막대: 상승 모멘텀이 제로선 위에 있지만 약해지고 있습니다. 빨간색 막대: 하락 모멘텀이 제로선 아래에서 강해지고
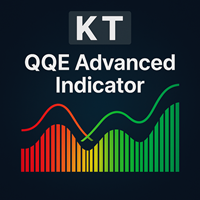
KT QQE Advanced 는 클래식 QQE 오실레이터를 색상 히스토그램과 빠른·느린 Trailing Line(TL) 로 재구성하여 더 정확하게 표현한 개선 버전입니다.
기존 QQE 와 달리, KT QQE Advanced 는 히스토그램 형태에 과매수/과매도 레벨을 표시해 추세의 과열 여부를 직관적으로 확인할 수 있습니다.
활용
MTF 스캐너로 모든 시간대에서 매수·매도 신호를 즉시 탐색. 트렌드 방향을 더욱 정확히 파악. 과매수·과매도 구간을 탐지. 가격 모멘텀을 가시화.
입력값 RSI 기간 스무딩 기간 MTF 스캐너 알림 설정
QQE란? QQE는 Quantitative Qualitative Estimation 의 약자로, 초‑스무딩 RSI 와 ATR 을 결합해 만든 오실레이터입니다. 일반 RSI 대신 Wilder RSI 를 사용하며, 이는 특수한 EMA 방식으로 평활화됩니다. Wilder 평활식 = 이전 MA + (1/n × (종가 − 이전 MA))

ATR Scanner Pro is a multi symbol multi timeframe volatility scanner that monitors and analyzes Average True Range indicator value in up to 28 symbols and 9 timeframes in 3 modes : ATR value: As a volatility dashboard it shows the ATR indicator value in all pairs and timeframes and signals when the ATR value reaches a maximum or minimum in a given duration. Short term ATR/Long term ATR ratio: It shows ratio of 2 ATRs with different periods. It's useful in detecting short term volatility and
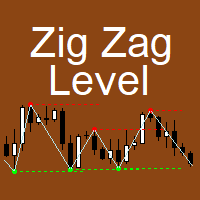
The indicator implements the author's approach to the construction of the popular "Zig-Zag" indicator.
The advantages of the "ZIgZag Level" indicator is that it filters out market noise and shows levels.
"ZIg Zag Level" is based on peaks and troughs, displays levels.
These levels can be disabled and configured.
The indicator displays the price of the level, the price tag can be disabled.
The "zigzag" line between the points can also be disabled.
The indicator has a built-in notification s

Tomamos 5 medios móviles las unimos en una la cual suavizamos y volvemos a suavizar, resultando un mega suavizador de medios móviles suavizadas. Indicador de mql5 funciona en cualquier broker y para todos los tiempos, siendo el mas optimo el de 5, 15 a mas. Funciona mejor en grupo consigo misma osea poner uno de 14 y otro de 50 y 400,, así se observa mejor su desempeño.

진정한 수급 지표 - 모든 시간대에서 저항 및 지지 수준의 위치를 빠르게 결정할 수 있습니다. 이 지표는 거래에서 기술적 분석을 사용하는 사람들에게 유용합니다. 표시기는 사용하기 쉽고 차트에서 끌어다 놓기만 하면 표시기가 가장 가능성 있는 지지 및 저항 수준을 표시합니다. 기간을 전환하면 새로 선택한 기간의 수준이 표시됩니다.
추천 로봇 스캘퍼 - 테스트 .
입력 매개변수 Use_price 레이블 - 켜기 /끄다 레벨 근처에 가격 아이콘 표시 가격 수준 색상 - 가격 아이콘의 색상을 선택합니다. 가격 수준 크기 - 가격 아이콘 크기 지원/저항 레벨 색상 - 레벨 색상 선택 내 구독 페이지 , 나는 다른 많은 유용한 제품을 가지고 있습니다. 이 지표가 마음 에 든다면 리뷰를 남겨주세요. 유용한 제품을 무료로 공유할 수 있는 원동력이 됩니다.
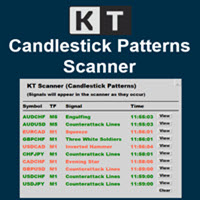
KT Candlestick Patterns Scanner is a Multi-Symbol and Multi-Timeframe scanner that fetches and shows various candlestick patterns on 28 currency pairs and 9 time-frames concurrently . The scanner finds the candlestick patterns by loading the KT Candlestick Patterns indicator as a resource in the background.
Features
The scanner can find the candlestick patterns on 252* combinations of symbols and time-frames from a single chart. Open the signal's chart loaded with a predefined template with a s
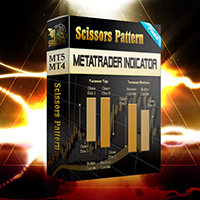
Configure scaffolding charts and signals based on the scissor pattern, which works great at low times.
Buy and sell signs based on 2 previous candle patterns
It works on the active time form, and when detecting the pattern in 4 time frames, 5 minutes, 15 minutes, 30 minutes and one hour, the alert can be set to notify us of the formation of this pattern.
MetaTrader version 4 click here
How to use:
When there is an opportunity to buy or sell, the marker places a scissors mark on the candle
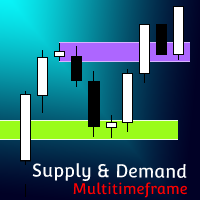
[ MT4 Version ] Supply and Demand Multitimeframe Supply and Demand Multitimeframe is the first indicator in the market that combines multiple aspects like trading volume, price structure and momentum to identify Supply and Demand zones for every asset. The Supply and Demand indicator analyzes simultaneously up to 4 different TFs and represents their information in the current graph. Its interactive UI highlights everytime the price enters a Supply or Demand zone even if the zones are not visible
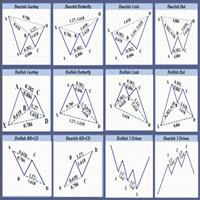
Only 5 copies of the EA at $30! Next price --> $45 Find charts and signals based on harmonic patterns, which work great in 1-hour timeframes and up.
Buy and sell signs based on different harmonic patterns as follows:
0: ABC_D
1: ABCD_E
2: 3Drive
3: 5_0
4: Gartley
5: Bat
6: Crab
7: Butterfly
8: Cypher
9: NenStar
10: Shark
11: AntiBat
12: AntiGartley
13: AntiCrab
14: AntiButterfly
15: AntiCypher
16: AntiNenStar
17: AntiShark
How to use:
When there is an opportunity to buy or sell, you have 5:

Offer 249 down from 350 for the next 1 copies. then back to 350 $
Are you tired of using outdated indicators that leave you guessing where to set your profit targets? Look no further than the AK CAP Opening Range Breakout Indicator. This powerful tool is backed by a US patent and has already helped countless traders pass funded challenges like FTMO. We use it daily on our prop traders and internal funds, and now it's available to you as well. The calculation behind the indicator is incredibly a
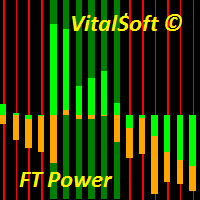
The FT Power indicator system is designed to determine the trend direction of the price chart. Consists of two histograms. The central histogram Bull/Bear Power determines the predominance of bullish or bearish power. When the indicator value is above zero, Bull/Bear Power shows that the bulls are strong, and when the histogram goes below 0, the bulls are exhausted and further growth becomes doubtful. The main histogram is used to determine the trend or flat sections of the chart and confirm the
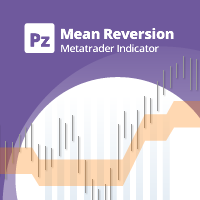
평균 회귀 거래에 대한 전문적이고 정량적인 접근 방식을 구현하는 고유한 지표입니다. 이는 가격이 예측 가능하고 측정 가능한 방식으로 평균으로 전환되고 반환된다는 사실을 이용하여 비정량적 거래 전략을 훨씬 능가하는 명확한 진입 및 퇴장 규칙을 허용합니다. [ Installation Guide | Update Guide | Troubleshooting | FAQ | All Products ]
명확한 거래 신호 놀랍도록 쉬운 거래 사용자 정의 가능한 색상 및 크기 성능 통계 구현 대부분의 거래 전략을 능가합니다. 적절한 SL 및 TP 레벨을 표시합니다. 이메일/음향/시각 알림을 구현합니다.
작동 원리
이 지표는 더 높은 기간에서 완전히 사용자 정의 가능한 이동 평균 주변의 표준 편차를 측정하고 추세 추종 접근 방식을 사용하여 정확하게 거래를 찾습니다. 거래는 현재 차트의 가격 동작을 살펴보고 선택한 더 높은 기간에서 계산된 평균 가격대로 가격이 돌아오면 닫힙니다. 코딩 방식 때문에 지

Kolmogorov-Zhurbenko 필터는 스펙트럼 누출을 제거하도록 설계된 특수 창 기능으로 간주할 수 있습니다. 이 필터는 확률적(금융 포함) 시계열을 평활화하는 데 최적입니다. 이 필터를 기반으로 하는 지표에는 다음 매개변수가 포함됩니다. iLength - 필터를 만드는 데 사용된 원래 직사각형 창의 기간. 유효한 값은 2 - 255입니다. iDegree - 필터 순서. iDegree=0이면 단순 이동 평균을 얻습니다. iDegree=1이면 삼각형 이동 평균을 얻습니다. 차수가 높을수록 더 나은 평활화 및 노이즈 억제가 가능합니다. 허용되는 값은 2 - 255입니다. 또한 이 매개변수는 표시기 = iLength + iDegree * (iLength - 1)의 마지막 기간에 영향을 줍니다. iMultiplier - 필터 값에서 계산된 표준 편차 수를 표시하는 승수입니다.
표시기의 모양은 그림에 나와 있습니다.
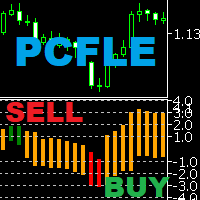
PCFLE Histogram (Price Change From the Last Extreme) - plots the percentage movement from the last extreme. Can be used for graphical representation of percentage movement from last lowest low to current high / from last highest high to current low. Input parametters: InpDigits - the number of decimal places displayed on the y-axis You can set colors and horizontal levels in the indicator properties. Examples of how to trade with the indicator can be found in screenshots.
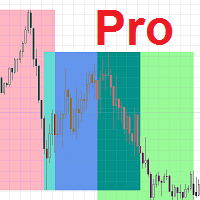
거래 세션 표시기는 각 거래 세션의 시작과 끝을 강조 표시합니다 .
제품의 유료 버전은 세션의 시작/끝을 사용자 정의 할 수있는 가능성 무료 입니다.
[옵션:] Asian session Open Asian session Close Asian session OpenSummertime Asian session CloseSummertime European session Open European session Close European session Open European session Close Timeshift
최상의 결과를 얻으려면 시간대를 사용하십시오.
시간 프레임에 대한 보정을 추가했습니다. 대략적인 수정:
Bars Correction ------------------ 23.50 ____ 10 23.54 ____ 5 23.55 ____ 4(5) 00.05 ____ 5(6)
시장에 나의 다른 제품 https://www.mql5.com/en/users/
Simple Super Trend indicator for MetaTrader 5. A trend indicator similar to moving averages. Use it for entry and exit signals. It gives accurate signals on precise time. Works as a Trailing SL/TP. This indicator can also be used on multiple timeframes where you place it on a larger timeframe then go to a lower timeframe. Super Trend needs to be used in conjunction with other indicators like rsi, Parabolic SAR, MACD, etc to receive filtered signals.

This indicator is the advanced edition of WRP&KD support resistance designed according to the combination of WPR, Stoch, RSI, CCI, and tick volume indicators. You can add other timeframe's support and resistance on the current chart. When WPR, Stoch, RSI, CCI goes up the same time quickly and the volume become larger, the price may meet strong resistance, many times short order will take profit, but if the price break through it, Long positions are more likely to be profitable, and the

RSI Scanner is a multi symbol multi timeframe RSI dashboard that monitors Relative Strength Index indicator for price entering and exiting overbought and oversold in up to 28 symbols and 9 timeframes.
Download Demo here (Scans only M2, and M10) Settings description here MT4 version here
RSI Scanner features: Signals RSI entering and exiting the overbought and oversold zones. Monitors 28 customizable instruments and 9 timeframes at the same time. Supports all 21 timeframes of Metatrader 5

Benefits of the Surfboard indicator :
Entry signals without repainting If a signal appears and is confirmed, it does NOT disappear anymore, unlike indicators with repainting, which lead to major financial losses because they can show a signal and then remove it. perfect opening of trades The indicator algorithms allow you to find the Peak and floor position to enter a deal (buy or sell an asset), which increases the success rate for each and every trader using it. Surfboard works with any asset

레머 평균은 창 함수로 간주할 수 있으며 가중치 계수는 계산에 사용된 변수의 값에 따라 다릅니다. 이 평균은 계산에 지수가 사용되기 때문에 비선형입니다. 표시기의 특성은 두 가지 매개변수에 따라 다릅니다. iPeriod - 표시기 기간, 유효한 값은 2 이상입니다. iPower - 지표 값을 계산할 때 사용되는 지수. 유효한 범위는 -32768 ~ 32767입니다.
iPower = 0이면 조화 평균을 얻습니다. iPower = 1 - 산술 평균, iPower = 2의 경우 역고조파 평균입니다. 지수가 크면 Lehmer 평균이 시계열의 최대 경계를 강조 표시합니다. 그리고 음수 지수를 사용하면 최소값이 강조됩니다. 이 속성으로 인해 Lehmer 평균은 시계열을 평활화하고 채널을 구성하는 데 모두 사용할 수 있습니다.
첫 번째 그림은 지수가 +500 및 -500인 종가를 사용하여 계산된 채널을 보여줍니다. 두 번째 그림은 iPower = +1000 및 -1000인 동일한 채

its not just an Indicator. its a trading system I'm working on for 3 years and also would be updated you don't need any thing else to trade because its a price action indicator that shows all static and dynamic support and resistance this indicator contains 7 lines that gives us dynamic support and resistance also when main lines (white ones) become flat for 26-52 periods they show strong levels. you can find consolidating areas, strong downtrend(in Green channel) and strong uptrend(in Red Chan
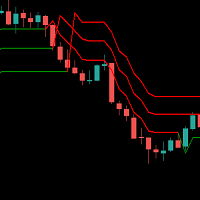
Supertrend indicator uses a combination of a moving average and average true range to detect the trend of a trading instrument.
Supertrend indicator for MetaTrader 5 easily shows the trend as a line following the price.
USAGE THIS INDICATOR If the closing prices are above Supertrend Line, there is a Bullish sentiment at that moment. The opposite is a Bearish sentiment. Three green lines - Strong Bullish sentiment. Three red lines - Bearish sentiment.
For BUY : - Three green lines and price a
AIS MT5 INDICATOR 5 ALL INCLLUSIVE SET
GUIDE
CHAPTER 1 IMPORTANT INFORMATION <1> THIS INDICATOR IS ONE OF THE SERIES OF NEW AIS INDICATORS AIS MT5 INDICATOR 1 =ADVANCED CLASSIC= AIS MT5 INDICATOR 2 =MULTIFRAMES= AIS MT5 INDICATOR 3 =LINES= AIS MT5 INDICATOR 4 =MARKET PROFILES= AIS MT5 INDICATOR 5 =ALL INCLUSIVE SET
CHAPTER 2 GENERAL FEATURES OF THE SERIES
<1> AIS MT5 INDICATOR 1 =ADVANCED CLASSIC= < DEVELOPMENT PAUSED > DISPLAYS MAIN TIME POINTS AND PRICE LEVELS OF THE CHART SUCH
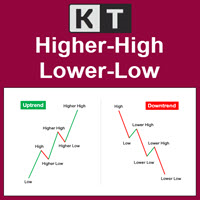
차트에 스윙 구조 표시 KT Higher High Lower Low는 스윙 고점과 스윙 저점을 감지하여 HH, LH, HL 또는 LL로 표시하고 해당 가격 수준을 차트에 연장합니다. 이를 통해 연속된 전환점을 명확한 시장 구조 지도로 볼 수 있습니다. Higher High, HH: 이전 스윙 고점보다 높은 고점입니다. Lower High, LH: 이전 스윙 고점보다 낮은 고점입니다. Higher Low, HL: 이전 스윙 저점보다 높은 저점입니다. Lower Low, LL: 이전 스윙 저점보다 낮은 저점입니다. 연속된 스윙 해석 고점과 저점이 함께 높아지는 흐름은 상승 구조를 나타냅니다. 고점과 저점이 함께 낮아지는 흐름은 하락 구조를 나타냅니다. 라벨이 혼합되어 나타나면 차트가 전환 중이거나 범위 안에서 움직이는 것일 수 있습니다. 이 구조를 현재 가격 움직임 및 선호하는 추세 방식과 비교할 수 있습니다. 스윙 수준을 차트 기준으로 활용 감지된 각 스윙은 수평 점선으로 연장됩니다.

Ayuda a interpretar la tendencia del precio de mercado de acuerdo a las mediciones en tiempo real, ideal para reforzar los resultados mostrados por el RSI las bandas de Bollinguer. Recuerde que el mercado de instrumentos financieros es altamente volatil, no opere con dinero que ponga en riesgo su estabilidad financiera. Solo use fondos que este dispuesto a perder. Resultados pasados no garantizan resultados futuros. Mantenga Siempre control sobre el riesgo.

The US Dollar Index, also known as DXY, is used by traders seeking a measure of the value of USD against a basket of currencies used by US trade partners. The index will rise if the Dollar strengthens against these currencies and will fall if the Dollar weakens against these currencies. Plan your technical analysis of the US Dollar Index by tracking its price in the chart and keep up with the latest market movements with news, advice pieces, and the dollar index forecast. The U.S. dollar index (
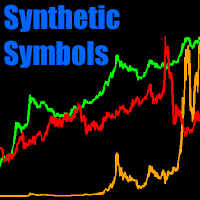
터미널 기호(또는 사용자 지정 기호) 사이의 작업을 수행하여 사용자 지정 합성 기호 를 생성합니다 . 로그 스케일, 상대 성과(주식 대 SP500, 금 대 은...), 통화 지수... 가능성은 무한합니다! 초 단위로 기호와 상수 사이의 모든 수학 연산을 실행할 수 있습니다. 두 값 사이의 최소값[min(a,b)] 또는 최대값[max(a,b)]과 제곱근[sqrt(x)], 절대값[abs(x)], 로그 [logn(x) 또는 log10(x)] 또는 한 값의 가장 가까운 정수 [round(x)]. 버전 2.0부터 현재 기호에서 표시기를 선언하고 해당 값에 액세스할 수도 있습니다. 예를 들면 다음과 같습니다. $ma_indi = <MA> : 50,0,0 ; #CURRENT - indicator ($ma_indi, 0) 표시기 이름의 구문은 사용자 지정 표시기의 경우 폴더/이름 이고 터미널 표시기의 경우 " < > " 사이입니다. 사용하는 방법 "#" 문자로 시작하는

Color Candle Indicator. The indicator implements a breakout system using the channel. When price exits the gray channel, the candlestick color changes to the color corresponding to trend direction. Blue for growth, yellow color for fall. Bright colors denote coincidence of trend direction and direction of a candlestick. Dark colors correspond to the situation when the direction of a candlestick is opposite to trend.

Description Price action patterns detection that can work as triggers in any trading strategy, It include Flag, Flag Top, Flag 1234, and micro pullback patterns Support: We create great tools for the entire trading community. Most of them are free. If you believe in what we do Support Us Here. How is this indicator useful? You can use the indicator signals as a trigger to entry in the market and complement any trading strategy. Components Note 1: This indicator should only be considered a
You can identify the strength of the main forex currencies with this tool. You can combine it with different styles and get the best strategy out of it. It has very high power. It can be customized.
MT4 version
This indicator will have many updates and special settings will be added to it.
You can contact us via Instagram, Telegram, WhatsApp, email or here. We are ready to answer you.
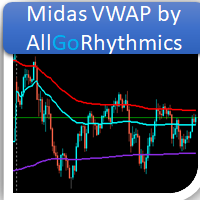
AUTO MIDAS VWAP Volume Weighted Average Price (VWAP) is a trading benchmark commonly used by Big Players that gives the average price a Symbol has traded throughout the day. It is based on both Volume and price.
Commonly, MIDAS VWAP damand you to determine the initial point of analysis. This indicator plots automatically based on ZigZag Approach.
You will be able to use up to 3 HIGH MIDAS VWAP's and 3 LOW MIDAS VWAP's.
Wish the best trade results!!

[ MT4 Version ] Bulls and Bears Power Bulls and Bears Power is an indicator that clearly highlights if bulls or bears are currently in control of the market. A price movement started with high Bulls control in the market can indicate the beginning of a new trend movement. The relative indicator power between price peaks also indicates if the movement is losing strength and might foresee a significant correction or a trend reversal. Bulls and Bears Power indicator offers a clear and simplified vi
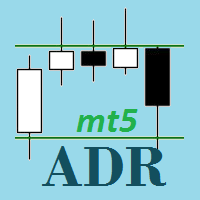
Average Daily Range (ADR) with Support (S) and Resistance (R) Levels is an indicator which shows how far a currency pair can move in a day. It can be used to find hidden support and resistance levels, estimate effective profit and stop loss targets, and provide short term trade signals from the hidden S and R levels. Features
Automatically plots on the chat, the top and bottom of the ADR value (i.e. a horizontal channel) which acts as Support and Resistance Levels Automatically calculates the p
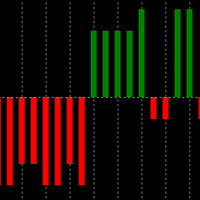
Supertrend indicator uses a combination of a moving average and average true range to detect the trend of a trading instrument.
Supertrend indicator for MetaTrader 5 easily shows the trend as a line following the price.
Triple SuperTrend Histo indicator calculate three supertrends to show the trend as a histogram. Changing the color from red to green means you can BUY , from green to red means you can SELL .
Description of the method of drawing a histogram. The price is above the EMA 200,
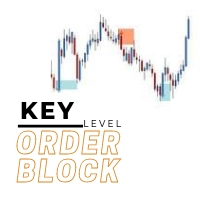
The key level order block indicator automatically draws order-blocks for you on the chart. The indicator compliments any strategy and can also be used as an independent tool. It can work with smart money concepts, harmonic patterns, supply and demand, flag patterns, Quasimodo strategy and many more.
Advantages
The key level order block DOES NOT RE-PAINT, giving you confidence when a signal appears and also helps when looking back. The key level order block includes an on/off button on the c
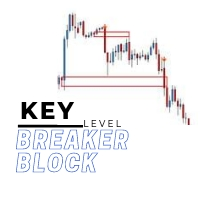
The key level breaker block indicator automatically draws breaker blocks for you on the chart. Breaker blocks are, in short, failed order blocks, but create strong support and resistance zones when price comes back to re-test them.
Advantages
The key level breaker block DOES NOT RE-PAINT, giving you confidence when a signal appears and also helps when looking back. The key level breaker block includes an on/off button on the chart to easily keep the charts clean after analysis by just one c

이 표시기는 이산 Hartley 변환을 기반으로 합니다. 이 변환을 사용하면 재무 시계열을 처리할 때 다양한 접근 방식을 적용할 수 있습니다. 이 지표의 특징은 판독값이 차트의 한 지점이 아니라 지표 기간의 모든 지점을 참조한다는 것입니다. 시계열을 처리할 때 표시기를 사용하여 시계열의 다양한 요소를 선택할 수 있습니다. 필터링의 첫 번째 가능성은 이 접근 방식을 기반으로 합니다. 불필요한 모든 고주파수 구성 요소는 단순히 폐기됩니다. 첫 번째 그림은 이 방법의 가능성을 보여줍니다. CutOff 매개변수를 선택하면 원래 시계열의 세부 정보를 선택할 수 있습니다(빨간색 선 - 주요 정보만 남음 CutOff = 0, 노란색 - 주요 및 가장 낮은 주파수 기간 CutOff = 1 , 파란색 - 가장 높은 주파수의 모든 노이즈가 삭제됩니다. CutOff = 4 ). 그러나 이것이 유일한 가능성은 아닙니다. 추가 필터링으로 노이즈 성분을 억제할 수 있습니다. 두 옵션 모두 이 표시기에 구현

Description: The Multi POC displays multiple Point Of Controls on one chart. This Indicator is also already included in the "VolumeProfile" Indicator .
Features: Customizable Range POC Customizable section POCs with VAL&VAH lines Works on all timeframes Drag & Drop for live calculation
Support: The indicator is constantly being developed and improved. Please do not hesitate to contact me via the MQL5 Platform. I am very grateful about any Bug report, so that i can constantly improve the indic
이 필터는 베셀 다항식을 기반으로 합니다. 주요 장점은 시간 지연이 적다는 것입니다. 이 필터의 또 다른 기능은 금융 시계열의 최신 값에 대한 높은 민감도입니다. 이 때문에 지표는 활성 가격 변동을 강조하는 동시에 노이즈 편차를 완화합니다. 고전적인 변형 외에도 Bessel 계수의 로그가 가중치 함수로 지표에 추가되었습니다. 이 경우 지표가 더 매끄럽게 나타나지만 동시에 가격이 활발하게 움직일 때 지연될 수 있습니다. 베셀 다항식을 계산할 때 계승이 사용됩니다. 이러한 이유로 지표의 기간은 아래에서 위로 제한됩니다. 일반 베셀 필터를 사용할 때는 지표의 작은 주기에 주의하는 것이 좋습니다. 기간이 증가함에 따라 표시기의 동작이 점점 더 안정되고 그 차이가 점점 더 눈에 띄지 않게 되기 때문입니다. 그림은 두 필터 유형의 동작을 보여줍니다. 표시 매개변수: TypeFilter - 일반/대수 필터 유형 선택 iPeriod - 표시 기간, 유효한 값 3 - 85.

Imbalance / Fair Value Gap (FVG) , this is a zone / gap created when the price move with force in a given direction. It identify a zone where the price could potentially go back. This gives perfect targets for your trades.
Imbalance is created from the high and low of 3 candles. When the wicks the of 1st and 3rd candle does not fully overlap the middle one.
This indicator will help you to easily spot mitigated/unmitigated imbalances in your chart. NEW UPDATE: Added Multi-Timeframe feature Ad
The best Vwap Midas coding for Metatrader 5 you can find in White Trader indicators.
The indicator has been optimized not to recalculate (improving performance) and has several visual settings for you to adapt in your own way. TRY IT FOR FREE by clicking the free demo button Where and why to use Vwap Midas (and Auto Zig Vwap Midas) can be used on a variety of indices, currencies, forex, cryptocurrencies, stocks, indices and commodities.
Many successful traders use price and volume to get the
Change the timeframe of a subchart in bulk Change the scale of a subchart in bulk
Reflect only the color of the average bar on the chart
Display the high and low prices of the previous month, the previous week, and the previous day
Indicator.
When the average bar is displayed, it will be difficult to see the chart pattern by all means, so only the color is reflected. This makes it difficult to overlook the shape of candlesticks, such as pin bars and reversals.
It can be recommended for sca

[ MT4 Version ] Ultimate Alpha Trend MT5
Ultimate Alpha Trend is the first trend indicator, which combines volatility, volume, average price and momentum. The results is a highly versatile representation of trendy and sideways market conditions, highlighting, at the same time, significant supply and demand levels. The Ultimate Alpha Trend indicator can be used to find entry oportunities and to set SLs taking into consideration current market volatility, volume and momentum. Besides that, the ind
Novice or Expert, our top of the line multi-time span Turn Prof will upgrade your exchanging and carry you extraordinary exchange amazing open doors with the Help and Obstruction levels that experts use.
Turn exchanging is a straightforward compelling technique for entering and leaving the market at key levels and has been utilized by experts for quite a long time and chips away at all images: Forex, Crypto, Stocks, Indicies and so on.
Turn Prof carries premium levels to the broker where the
The Round Number Drawer is an indicator that automatically draw lines or zones at the psychological levels (00 or 50) as the market moves. New lines are drawn as the market moves while the old lines are deleted. This ensures that your chart is clutter-free. The user specifies the number of lines preferred on the chat, and the indicator keeps the number of lines constant. The indicator plots two types of levels, the Main Level (00 levels e.g. USDCAD 1.33000, 1.34000) and the Sub Level (50 levels
Supertrend indicator uses a combination of a moving average and average true range to detect the trend of a trading instrument.
Supertrend indicator for MetaTrader 5 easily shows the trend as a line following the price.
You can use the second my indicator: You will see 3 supertrends and EMA 200 lines on the screen.
Working with my product :
https://www.mql5.com/en/market/product/80692
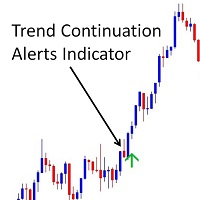
!! FLASH SALE !! Over 80% off !! Now only $47 - normally $297!
Buy And Sell Arrows On The Chart When The Trend Is About To Continue. Sends Alerts – On MT5 To Your Phone To Your Email.
Does not repaint.
Works on any pair, any timeframe. (Just ajust the settings for your pair and timeframe.)
10 Activations allowed so you are free from limitations
See an example of alerts from today (23 May 2020) using this and 2 other indicators here .
MT4 version here. Spreads from 0.1pip RAW/ECN Acco
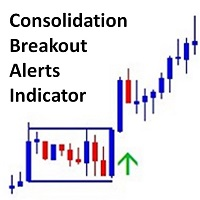
The Consolidation Breakout Alerts Indicator will revolutionize your trading strategy. Our innovative indicator offers unique buy and sell arrows when price breaks out from consolidation, allowing you to get in at the most optimal entry with minimal risk and maximum reward potential. Never again will you miss out on the lucrative trading opportunities available in volatile markets. Let the Consolidation Breakout Alerts Indicator do the work for you and reap the rewards! Buy and Sell Arrows when
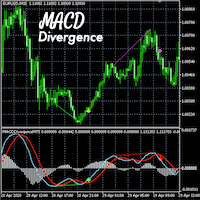
MACD Divergence Detector MT5
- Non-repainting - Live divergence detection - Accurate MACD indicator - Includes 10 indicator buffers - EA friendly - Includes useful customizable settings - Decide which buffers to display on the chart and their colors
The MACD Divergence Detector for MT5 is an accurate and useful tool for detecting and displaying MACD divergences and good places to take long and short trades. It includes 10 buffers and customizable settings. This tool does not repaint and can
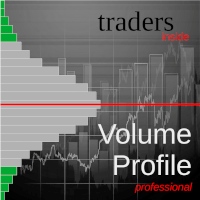
Volume Profile Indicator used by professional Traders at Traders Inside Ltd. If you want to succeed in trading you need to know if current price is cheap, expensive or fair valued. Key features: Fair price (Point of control, POC), high and low price zones (POH, POL) POC in different timeframes for better orientation Symbol and timeframe Chart resize on open positions/orders, VPRmax/min Historic POC - see, how POC has changed the last periods Button to show/hide VPR
Calculated Bars (best results)
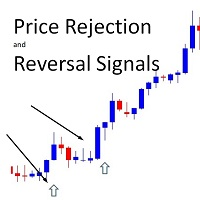
!! FLASH SALE !! Over 80% off !! For ONE week only. Now only $47 - normally $297! >>> Ends on 30 June 2023 - Don't miss it!
Buy And Sell Signal Arrows On The Chart When The Price Is About To Reverse. Also Sends Alerts –On MT5 To Your Phone To Your Email.
Does not repaint.
Works on any pair, any timeframe. (Just ajust the settings for your pair and timeframe.)
10 Activations allowed so you are free from limitations
MT4 version here .
Spreads from 0.1pip RAW/ECN Accounts, c
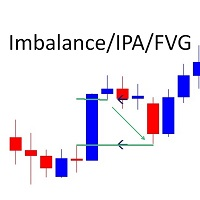
Marks Market Imbalance / Improper Price Action / Fair Value Gaps on The Chart As traders continue to search for the best trading indicators to guide their investments, the I mbalance / I mproper P rice A ction / F air V alue G ap I ndicator has become increasingly popular. This indicator helps to identify opportunities for taking profit . The indicator begins by scanning the markets for imbalance-improper price action events, allowing traders to immediately see when markets are not functioning
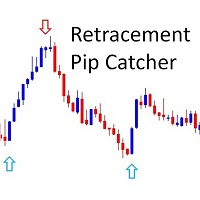
Buy and Sell Arrows when price is about to retrace. It Also Sends Alerts – On MT5 To Your Phone To Your Email
Does not repaint.
Works ony any pair, any timeframe.
10 Activations allowed so you are free from limitations
See an example of alerts from today (23 May 2020) using this and 2 other indicators here .
MT4 Version here . Spreads from 0.1pip RAW/ECN Accounts, click here . Check out my Waka Esque EA signal here: >> High Risk Settings or Medium Risk Settings .
What is a Retracem
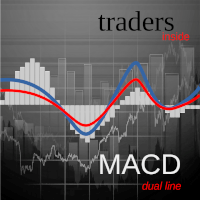
MACD with fast and slow EMA. Moving average convergence divergence (MACD) is a trend-following momentum indicator that shows the relationship between two moving averages of a security's price . The MACD is calculated by subtracting the fast-period exponential moving average (EMA) from the slow-period EMA. Setup options: Fast EMA period Slow EMA period Signal EMA period Applied price Indicator window height Color MACD Color Signal Color Histogram

It is a new indicator that frames the price movement and tracks it. It consists of oscillation channel and its center line CL . For its calculation it is only necessary to introduce the amplitude of the channel. Because of this, it is a non-lagging indicator as it is not calculated based on a number of previous candlesticks. It removes any level of noise , showing the underlying price movement cleanly via the center line . It allows you to easily identify the beginnings a
Average Daily Range with factor target and more functions (ADR)
Hello traders,
The upgraded ADR dashboard now is also for MT5 much more better and more convenient for day trader, try it to experience the good things!
How to use Average Daily Range (ADR) Indicator?
ADR is just a simple indicator tool to help trader identify the daily average range of an instrument. So for example we have the pairs EURUSD and that pairs usually makes a peak and bottom during the trading day and the poin

Every indicator has its advantages and disadvantages. Trending ones show good signals during a trend, but lag during a flat. Flat ones thrive in the flat, but die off as soon as a trend comes. All this would not be a problem, if it was easy to predict when a flat changes to a trend and when a trend changes to a flat, but in practice it is an extremely serious task. What if you develop such an algorithm, which could eliminate an indicator's flaws and enhance its strengths? What if such an algorit

The most sensitive indicator you've ever seen! And now with Alerts
POscillator Alert is a sensitive indicator that finds each trend direction change in every timeframe and then notifies you with the necessary alarms. It's a new version of the POscillator Indicator, with the addition of its alarm sending capability. The Indicator can send multiple alerts: email, mobile phone notification, alert window and alert sound. All of these different alarms are optional and you can choose the ones you w
Multiple Timeframe Trend Alert
I. Overview
Real-time analysis of trends on nine time frames (M1, M5, M15, M30, H1, H4, D1, W1, MN1) based on the calculation of highs and lows using swing highs and lows and Dow Theory. Indicator sends notifications (alerts) when the trends of the specified time frames match.
II. Advantage
Since this indicator notifies you when a trend coincides, you can seize trading opportunities without having to stay on the charts.
In addition, by introducing this indica

New Trend Alerts finds new trends at the changing bar very quickly. If the trend has enough power and a quality up/down angle, then the indicator sends multiple alarms to alert you: via email, mobile notification, alert window and alert sound. All of these different alarms are optional, and you can choose which ones you would like to use. The indicator calculates the derivative of the price chart to reveal the slope of price curve and its sign changes. Red bars indicate a positive sign or uptre
John Bollinger's normalized MFI (Fund Flow Index). Bollinger bands are used to calculate overbought/oversold areas. It takes three input parameters: MFI period - MFI calculation period MFI Applied Volume - Calculates the volume of MFI transactions BB period - Calculation period of the Bollinger band BB deviation - Brin deviation Calculation: NormMFI = (MFI-BL) / (TL-BL) Among them: TL = BBands(MFI, BB period, BB deviation, UPPER_BAND) BL = BBands(MFI, BB period, BB deviation, LOWER_BAND) MFI - M
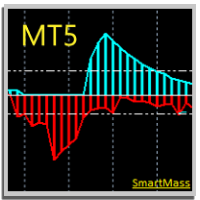
SMARTMASS INDICATOR
This indicator is different from all known volume indicators. It has a significant distinction; it is an algorithm that relates price movement to volume, attempting to find proportionality and efficient movement while filtering out noise and other movements that are more random and do not follow a trend or reversal. Ultimately, it reveals the true strength of the movement, indicating whether it has genuine support from bulls or bears or if it's merely a high-volume movement

///XShea///
레벨 크로스오버에 적용된 표시기(MFI)의 논리를 기반으로 합니다. 스캘핑만
실제 계정에서 몇 달 간의 테스트 및 응용 프로그램을 제공하기로 결정했습니다.
해당 규칙을 준수하는 경우 구매자의 이 귀중한 도구
당신은 당신의 외환 계좌에서 아주 좋은 이익을 얻을 수 있을 것입니다.
이 표시기는 소리 경고 및 푸시 알림을 보내도록 프로그래밍되었습니다.
애플리케이션 모드:
M5 이상의 기간에만 작업 손절매(SL) 수준의 경우 마지막 이전 지지선 또는 저항선을 기준으로 삼으십시오. 이익실현(TP) 수준의 경우 이 응용 프로그램 모드의 두 번째 지점을 참조하여 1/4로 설정합니다.
자세한 내용은 다음 연락처로 문의하십시오.
WhatsApp: +5930962863284
구매 후 이 도구를 최대한 활용하는 방법에 대한 추가 가이드를 보내려
CHART OBJECTS: Blue box : Bullish Order Blocks (OB) Red box : Bearish OB Orange box : Mitigated OB. Price bounce from this area the made a new high/low Light gray box : Price bounced from this area but did not made a new high/low Dark gray box : Broken OB. Filled boxes : TimeFrame 1 Order Blocks
Unfilled boxes : TimeFrame 2 Order Blocks
INDICATOR SETTINGS: Order Block Required Length: Required number of subsequent candles in the same direction to identify Order Block. Default value: 5 Imba

In this indicator, Heiken Ashi candles are calculated with the most optimal method. You can also customize the results by adjusting the amount of period and method input. But the most important advantage of this indicator is the adjustment of the time frame value. You can use this to calculate the Heiken Ashi chandels to See in time frames with lottery in the lower time chart. In this case, you get the best signal to buy or sell using two or more Heiken Ashi indicators with different timeframes
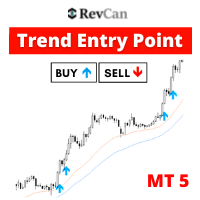
[75% OFF - SALE ENDS SOON] - RevCan Trend Entry Point is a trend based trade alert indicator for serious traders. It does all the price and chart analysis all by itself, and whenever it finds any potential high quality trading opportunity(Buy or Sell) using its revolutionized price prediction algorithms, it sends instant trade alert directly on the chart, MT4 terminal and on the mobile device. The trade signals will be visible on the chart as Up and Down arrows, while the instant audible ale

Basato sull'indicatore RSI aiuta a capire quando il trend sta cambiando in base ai periodi impostati. E' possibile impostare intervalli di tempo personalizzati e colori delle frecce. Segui l'andamento e valuta anche in base alla volatilità dell'asset. Funziona con ogni coppia di valuta ed è da considerare come un'aiuto ad una valutazione. Puoi associarlo con altri indicatori.
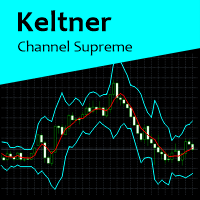
Keltner Channel Supreme is a indicator based on Keltner Channels, with some configuration besides period and Keltner multiplier factor. In this indicator, it is possible to change to an exponential moving average and if prices will be calculated according to close price or typical price. This indicator works on all graphics. If you have some doubt, please PM.
트레이딩 전략과 기술 지표를 판매하기에 가장 좋은 장소가 왜 MetaTrader 마켓인지 알고 계십니까? 광고나 소프트웨어 보호가 필요 없고, 지불 문제도 없습니다. 모든 것이 MetaTrader 마켓에서 제공됩니다.
