MetaTrader 5용 새 기술 지표 - 34

Wave Price Indicator The Wave Price indicator is an advanced technical analysis tool that visualizes price movements in wave formations using a ZigZag approach. It helps traders identify significant price patterns, trends, and potential reversals by breaking down price action into meaningful waves. Price Wave Analysis : Visualizes price movements in clear wave patterns ZigZag-based Calculation : Filters out market noise and focuses on significant price moves Color-Coded Waves : Aqua: Bullish wa
Wave Tracker
The Wave Tracker is an innovative price action tool that plots wave patterns directly on your chart, helping traders identify significant market movements and potential turning points. By using a sophisticated ZigZag algorithm, it creates a visual representation of price waves, making it easier to spot trends, reversals, and important price levels. Direct Chart Visualization : Plots waves directly on your price chart for seamless analysis Smart Wave Detection : Advanced ZigZag al

The Moving Average Acceleration Indicator is a simple but powerful tool for traders. It shows you more than just the trend; it reveals the strength and momentum behind it . Why it's Useful See the Trend's Energy: Unlike a regular moving average that just shows direction, this indicator measures how fast the trend is accelerating or decelerating. This helps you spot a trend that's picking up speed or one that's about to slow down. Early Warnings: A trend that's losing momentum often signals a pot
Advanced SRP (Strong Retracement/Reversal Points) Tired of support and resistance indicators that constantly repaint, clutter your charts with irrelevant lines, and fail across different timeframes? It's time to stop guessing and start trading with institutional-grade clarity. Advanced SRP is not just another S/R tool; it's a definitive market structure indicator designed for the serious trader. It identifies and displays the most critical price levels where the market is statistically likely

Clean Scalper uses a non-repaint non recalculate ZigZag-based approach to map significant highs and lows in price, producing continuous lines that emphasize price swings while filtering out minor fluctuations. Traders can adjust the sensitivity by modifying the ATR period and multiplier, tailoring the indicator to different timeframes and market conditions. Trade breakouts of points or trend following scalps
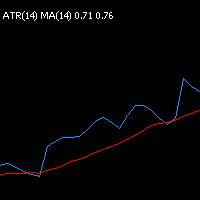
This indicator combines the Average True Range (ATR) with a moving average to provide a smoothed view of market volatility. The ATR measures the average range of price movement over a defined period, while the moving average filters out short-term noise, helping traders better identify sustained volatility trends.
It’s particularly useful for setting dynamic stop-loss levels, assessing risk, and timing entries or exits based on evolving market conditions.
Temporal Predictive Encoding Indicator Discover the Future of Trading with Temporal Predictive Encoding (TPE) Unlock unprecedented trading accuracy with Temporal Predictive Encoding (TPE) , the revolutionary MetaTrader 5 indicator designed to predict market movements by analyzing temporal patterns and anomalies in price data. Built on advanced algorithms inspired by quantum mechanics and spectral analysis, TPE detects hidden predictive biases in real-time, empowering traders to stay ahead of ma

Elite Harmony Signals Pro Panoramica Elite Harmony Signals è un indicatore sofisticato di analisi tecnica che visualizza rettangoli dinamici che forniscono zone di trading chiare e segnali di conferma per decisioni migliorate. Caratteristiche Principali Zone Rettangolo Dinamiche Estensione in Tempo Reale : I rettangoli si estendono automaticamente all'azione corrente del prezzo Chiusura Intelligente : I rettangoli si chiudono solo quando appaiono segnali opposti Conferma Visiva : Zone di trading
Linear Regression Channel – Indicator The Linear Regression Channel is a custom MT5 indicator that plots a regression line through price over a specified number of bars, with dynamic support and resistance boundaries. Central Line (BlueViolet):
Represents the linear regression line (best-fit line) based on the selected price type (Close or High/Low). Upper Line ( Li me):
Represents the regression-based resistance level, adjusted dynamically according to the highest deviation from the regressi
FREE

Horizontal Grid Indicator This is a simple utility indicator for MetaTrader 5 that draws a customizable horizontal grid directly on your chart. Its primary goal is to help traders visualize price levels, support/resistance zones, and potential profit targets at fixed pip intervals. Key Features Customizable Spacing: You can set the distance between the lines in pips (e.g., every 50 pips or X pips). Dynamic and Adaptive: The grid automatically adjusts to what you see on the screen, drawing lines

ArroX Indicator Description
ArroX is a technical analysis indicator designed for MetaTrader 5 platform. This indicator analyzes price movements and market trends to provide trading signals.
Key Features: - Displays buy and sell arrows on the chart - Includes trend filtering capabilities - Provides multiple take profit levels - Shows market analysis information panel - Supports different signal sensitivity modes - Uses Bollinger Bands and moving averages for analysis - Includes stop loss calc
ATTENTION!!!Get this product at a discounted price NOW!!! Description of the Directional Strength Index mt5 I present to you this awesome indicator that concludes the trading armor of a trader seeking for a strong affirmative and insightful entries and exits confluences.The core idea that runs behind the indicator is generated from the famous children game " TUG OF WAR ".The market is depicted as being influenced by two forces : buying and selling force. The indicator's work is to determine wh

SWT Manifold Oscillator A Next-Generation Momentum Oscillator Based on Stationary Wavelet Transform and Manifold Theory Unlock a new perspective on market momentum with the SWT Manifold Oscillator . This is not just another oscillator; it is a sophisticated analytical tool designed for the discerning trader who demands a deeper, more nuanced understanding of price dynamics. By leveraging advanced mathematical concepts, this indicator provides a clearer, smoother, and more responsive measure of

Modern Spike Indicator Features:
1. Support and Resistance Lines: Displays dynamic horizontal dashed lines on the chart representing current support and resistance levels calculated from recent price swings.
2. Spike Detection Arrows: Shows up arrows (green) for potential upward spikes and down arrows (red) for potential downward spikes, triggered when price breaks S/R levels with RSI confirmation.
3. Trend Analysis: Incorporates ADX (Average Directional Index) to determine market trend stre

SuperScalp Pro – 고급 다중 필터 스캘핑 인디케이터 시스템 SuperScalp Pro는 클래식 Supertrend와 여러 지능형 확인 필터를 결합한 고급 스캘핑 인디케이터 시스템입니다. 해당 인디케이터는 M1부터 H4까지 모든 타임프레임에서 효율적으로 작동하며, 특히 XAUUSD, BTCUSD 및 주요 외환 통화쌍에 적합합니다. 독립형 시스템으로 사용하거나 기존 거래 전략에 유연하게 통합할 수 있습니다. 이 인디케이터는 11개 이상의 필터를 통합하며, 빠른/느린 EMA, 추세 판별용 3개의 EMA, EMA 기울기(EMA slope), RSI, ADX, 거래량(Volume), VWAP, 볼린저 밴드 돌파(Bollinger Bands Breakout) 및 MACD 다이버전스 필터 등을 포함합니다. 스마트 캔들 필터는 캔들 종가를 확인하여 약한 신호를 제거하고, 3 EMA와 MACD 다이버전스 필터를 결합한 추세 인식 메커니즘은 더 높은 승률의 신호를 선별하는 데 도움을 줍니

RiskKILLER_AI Navigator는 AI 기반의 다중 시간대 시장 방향 및 전략 어시스턴트입니다. 트레이딩 성과는 프로처럼 시장을 이해하는 데 있습니다. 그것이 바로 RiskKILLER_AI Navigator 가 제공하는 것입니다: MQL5 외부 에서 작동하는 AI 기반 트렌드, 심리, 거시 분석을 통해 여러분의 트레이딩 스타일에 맞춰진 기관 수준의 인사이트를 얻으세요. 구매 후 사용자 설명서를 받으려면: 1. 설명서를 요청하는 댓글 을 게시 2. 저에게 쪽지 를 보내주세요. [ 전용 그룹 | 버전 MT5 - MT4 ]
핵심 이점 여러 시간대와 자산에 걸친 실시간 시장 방향 거시 지표, 뉴스, 심리에 대한 AI 기반 분석 여러분의 트레이딩 스타일(수동 또는 자동)에 기반한 맞춤형 조언 RiskKILLER_AI Expert Advisor (EA)와의 직접적인 시너지
주요 기능 AI 기반 글로벌 트렌드 대시보드 - 주요 FX 쌍과 BTCUSD에 대해 M1부터 D1까지의 시장

NosTraderMus LinearRegressionBands MT5 — 회귀 직선 채널 + RSI 및 신호 화살표 NosTraderMus LinearRegressionBands MT5 는 롤링 가격 구간 위에 회귀 직선 을 구축하고, 잔차의 표준편차 를 이용해 동적 채널 을 형성합니다. 이 통계적 채널 위에서 RSI 필터 (기간/타임프레임 선택 가능)를 적용하여 “극단 + 확인” 조건이 충족될 때 매수·매도 화살표 를 표시합니다. 신호는 종가 기준 으로 평가되어 리페인팅을 줄이는 데 초점을 맞춥니다. 동작 방식 회귀 직선 + 적응형 채널
RegPeriod 개의 봉으로 **추세 중심선(회귀 직선)**을 계산합니다. 채널 폭 은 잔차의 표준편차에 StdDevFactor 를 곱해 산출하므로, 현재 변동성 에 맞춰 폭이 자동 조정 됩니다. 추세 필터(선택)
직선의 기울기 가 방향성을 나타냅니다. OnlyInTrend=true 일 때는 추세 방향과 일치하는 신호만 표시됩니다(기울기 양수

Sniper Delta Imbalance is a professional tool for deep delta analysis — the difference between buyer and seller volumes. It takes volume analysis to the next level, allowing traders to see in real time who controls the price — buyers or sellers — and to find precise entry points based on the actions of major market participants. This tool represents a unique style of analysis based on the ratio of demand and supply volumes and can be used to detect who holds control over price. At the core of

Schemes 2.0 - MT5 차트를 즉시 바꿔보세요 Meta Trader 5를 위한 최고의 시각적 향상 도구인 Schemes 2.0으로 거래 경험을 업그레이드하세요.
전문적으로 디자인된 9가지 색상 테마와 스마트 토글 인터페이스를 통해 깔끔한 미니멀리즘부터 생동감 넘치는 고대비 설정까지, 단 한 번의 클릭으로 차트 스타일을 즉시 전환할 수 있습니다.
트레이더들이 Schemes 2.0을 사랑하는 이유 1. 9가지 프리미엄 테마 - 밝은 테마부터 어두운 테마, 클래식 테마부터 모던 테마까지 모든 거래 스타일에 맞춰 제공됩니다. 2. 원클릭 스타일링 - 차트 설정 조정에 시간 낭비 없이 즉시 변화합니다. 3. 스마트 토글 - 방해받지 않는 작업 공간에서 언제든지 컨트롤을 표시하거나 숨길 수 있습니다. 4. 전문적인 디자인 - 스크린샷, 시그널 또는 실시간 거래 프레젠테이션에 적합합니다. 5. 가볍고 사용하기 쉬움 - 설치가 간편하고 직관적이며 군더더기 없이 깔끔하게 사용할 수 있

DoctorEdge Daily Levels Entry SL And TP Short Description:
Advanced indicator for MetaTrader 5 that automatically calculates entry, stop loss, and take profit levels based on market data, facilitating technical analysis and trade planning. Long Description:
The DoctorEdge Daily Levels Entry SL And TP is a technical indicator designed for traders seeking precision in defining entry points, stop loss, and take profit levels. It uses current market data to calculate: Entry (Entry): Stop Loss (SL)
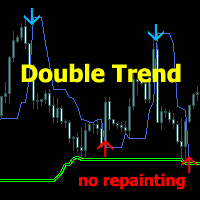
Trading System Double Trend MT5 - 여러 지표로 구성된 독립적인 트레이딩 시스템입니다. 전반적인 추세의 방향을 파악하고 가격 변동 방향에 대한 신호를 제공합니다.
스캘핑, 일중 또는 주간 거래에 사용할 수 있습니다.
특징
모든 시간대 및 거래 상품(외환, 암호화폐, 금속, 주식, 지수)에서 작동합니다. 차트를 로드하지 않고도 정보를 시각적으로 간편하게 확인할 수 있습니다. 지표가 다시 그려지거나 신호를 완성하지 않습니다. 캔들이 마감될 때만 작동합니다. 다양한 유형의 신호 알림이 제공됩니다. 시각적으로 이해하기 쉽고, 차트에 연결하고 신호의 간단한 권장 사항을 따르기만 하면 됩니다.
시스템의 각 추세에 대한 입력 매개변수가 구성됩니다.
General trend - 전반적인 추세를 파악합니다. Signal trend - 진입 및 청산 신호를 제공합니다. Play sound / Display pop-up message / Send push notifi
Koryu Delta Koryu Delta is a MetaTrader 5 indicator. It identifies trend reversal points using pivot point analysis and delta volume data. It detects Market Shift patterns and shows signals based on market dynamics. This tool can be used by traders who scalp, swing trade, or invest long-term. It analyzes up to 500 historical bars to find past patterns. It uses closed-bar logic for signals. Features of Koryu Delta Pattern Detection : It identifies bullish and bearish Market Shift patterns using
FREE

TrendFlex Pro - 전문가용 적응형 채널 시스템 TrendFlex Pro 는 적응형 가우시안 엔벨로프를 사용하여 동적 지지 및 저항 수준을 정확하게 식별하는 혁신적인 차세대 지표입니다. 이 지표는 시장 변동성에 자동으로 조정되며 고정밀 트레이딩 신호를 생성합니다. 주요 장점: 적응형 기술 - 모든 상품 및 타임프레임에 자동 조정 두 가지 작동 모드 - 다이내믹 (리페인팅 있음) 및 스태틱 (리페인팅 없음) 스마트 신호 - 확인 기능으로 거짓 돌파 필터링 시각적 통계 - 내장된 신호 성공률 패널 다용성 - 외환, 지수, 암호화폐, 주식에서 작동 최적화됨 - 터미널에 최소한의 부하 작동 원리: 이 지표는 가우시안 가중치 를 사용하여 가격 주위에 적응형 채널을 구축합니다. 표준 채널과 달리 TrendFlex Pro는 시장 변동성에 따라 밴드의 너비를 동적으로 변경하여 다음을 가능하게 합니다: 과매수/과매도 순간을 정확하게 식별 극한
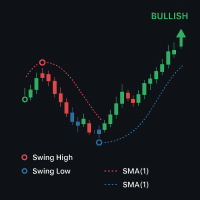
HighLow Swing — 추세 및 스윙 감지 지표
설명: HighLow Swing은 트레이더가 모든 차트 시간대에서 주요 시장 전환점과 추세 방향을 쉽게 파악할 수 있도록 설계된 강력한 추세 및 스윙 감지 지표입니다. 중요한 스윙 고점과 저점을 강조하고, 스윙 구조를 기반으로 추세 원을 그리며, 명확한 시각적 신호를 통해 시장 모멘텀을 앞서갈 수 있도록 도와줍니다.
주요 기능: 1. 스윙 포인트 감지: 차트에서 중요한 스윙 고점과 스윙 저점을 자동으로 감지하고 명확한 색상의 원으로 표시합니다. 2. 추세 식별: 스윙 고점/저점 분석과 가격 움직임을 결합하여 시장 추세(강세, 약세, 중립)를 파악합니다. 3. 시각적 추세 신호: 현재 추세 방향을 차트에 직관적인 원 형태로 표시합니다. 4. 설정 가능한 추적 기간: 다양한 시장 및 시간대에 맞게 조정 가능한 추적 기간을 통해 스윙 감지의 민감도를 사용자 지정할 수 있습니다. 5. 가볍고 효율적: 플랫폼 속도 저하 없이 모든 심

Legion of Soldiers – 사용 설명서 주요 초점 Legion of Soldiers 는 이미 확립된 추세 전략 내에서 재진입 을 위한 지표로 설계되었습니다. 이 지표는 그 자체로 추세를 정의하지 않으며, 사전에 식별된 추세 시스템을 보조하고 강화 하는 데 사용됩니다. 추세의 방향은 다음 도구를 사용하여 사전에 확인해야 합니다. MarketCrack – Whale Detector (권장). 또는 사용자가 사용하는 높은 시간대의 다른 추세 감지 전략. 사용 방법 사용자는 파란색 선(Fast)과 빨간색 선(Slow) 사이의 교차 를 기다려야 합니다. 아래에서 위로 교차: 주요 추세가 이미 확인된 경우, 강세 재진입 신호입니다. 위에서 아래로 교차: 하락 추세 내에서 약세 재진입 신호입니다. 이 지표에는 설정 가능한 알림 시스템 이 내장되어 있어, 트레이더의 선호에 따라 강세 교차만, 약세 교차만, 또는 둘 다에 대한 알림을 받을 수 있습니다. 히스토그램 Legion of Sol
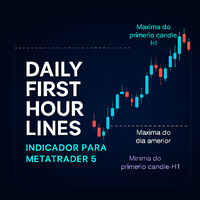
Daily First Hour Lines - MetaTrader 5용 지표 설명 Daily First Hour Lines 는 각 trading 세션의 첫 1시간 봉을 기반으로 지지와 저항 수준을 자동으로 그리는 MetaTrader 5용 혁신적인 기술 지표입니다. 금융 시장에서 거래하는 trader들을 위해 개발된 이 지표는 잠재적인 반전 지점과 trend 연속성을 식별하기 위한 중요한 시각적 참조를 제공합니다. 주요 특징 첫 H1 봉 라인 : 매일 첫 1시간 봉의 high와 low 수준에 점선을 그림 전일 참조 : 전일 high와 low 수준을 포함하는 dashed 라인 직관적인 색상 코딩 : high에는 blue (DodgerBlue) low에는 magenta 자동 정리 : 48시간 이상된 객체를 자동으로 제거하여 chart 정리 상태 유지 일일 업데이트 : 01:00 이후 하루에 한 번 자동 처리 Trader를 위한 이점 지지/저항 식별 : 첫 H1 봉 라인은 중요한 intrad
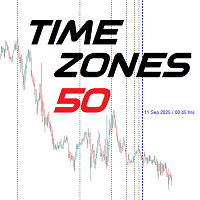
Time Zones Fifty 이 지표는 기본적인 문제를 해결합니다.
시간을 어떻게 세야 하는가? 어떤 구역을 사용해야 하는가? 어떻게, 그리고 왜?
이 모든 것은 논리에 기반합니다. 시간대 적용 시간대를 적용하려면 시작점이 필요합니다. 이 시작점은 임의로 선택되는 것이 아니라 논리적으로 정의되어야 합니다.
일부 사람들은 다음과 같은 시점을 시작으로 선택합니다: 한 해의 첫날 한 달의 첫날 분기 또는 주의 시작 그러나 이것은 시장 활동이 매년 같은 날짜에 정확히 반복된다는 것을 의미합니다.
예를 들어, 2025년 3월 12일에 일어난 일이 2026년 3월 12일에도 반복되어야 한다는 것입니다. 분명히 그렇지 않습니다. 사이클은 반복될 수 있지만 반드시 같은 시작점에서 시작되는 것은 아닙니다.
간(Gann) 사이클을 사용할 때도 시작점을 정해야 의미가 있습니다. 그렇다면 시작은 어디일까요? 선택 1 일반적으로 지금은 2025년이라고 받아들여지며, 시작은 서기 0년 1월 1일, 즉 그리

100PIPSsignals — 금(M1)용 고속 EMA 크로스오버 시스템 1분 차트에서 금 CFD를 위해 설계된 경량 EMA 크로스오버 지표입니다. 명확한 화살표와 금색 원으로 저위험 진입 시점을 표시하고, 설정 가능한 최소 핍 목표가에 따라 움직임을 검증하며, 알림/알림을 보낼 수 있습니다.
작동 원리(간단) 이 지표는 두 가지 지수 이동 평균(고속 EMA와 중간 EMA)을 사용합니다.
고속 EMA가 중간 EMA를 상향 교차하면 매수 신호 화살표가 나타나고, 하향 교차하면 매도 신호 화살표가 나타납니다.
다음 봉의 시가에 금색 원이 표시되어 실제 제안 진입 가격을 나타냅니다.
이 지표는 진입 후 가격 변동을 확인하여 각 신호를 검증합니다. 설정 가능한 최소 핍 목표가에 도달하지 못한 신호는 제거됩니다. 검증된 거래는 차트에 핍 이득과 함께 표시됩니다.
XAU(금) CFD, 1분 시간대에 사용 가능하며, 거래 전 상위 시간대를 확인하여 시그널을 확인하세요. 주요 기능 금(
Multi-Timeframe Laguerre RSI와 Zero-Lag MACD 지표는 MetaTrader 5용 고급 오실레이터로, 적응형 Laguerre RSI와 ZLEMA 기반 Zero-Lag MACD를 결합하여 정확한 모멘텀 및 트렌드 분석을 제공합니다. 신호는 별도 창에 표시되며, Multi-Timeframe 패널은 가중 점수를 활용해 신뢰할 수 있는 진입점을 식별합니다.
주요 특징:
듀얼 오실레이터 표시: 조정 가능한 LaRSI(Alpha)와 Zero-Lag MACD(ZLEMA 기반)를 동일 창에 표시.
Multi-Timeframe 지원(최대 5개): 각 타임프레임에 대한 합의 신호 및 전체 점수 표시.
Non-Repainting 신호: 모든 활성 타임프레임이 일치할 때만 화살표 표시, 신뢰도 향상.
유연한 알림: LaRSI/MACD 크로스 또는 Multi-Timeframe 합의 기반 팝업, 사운드, 푸시 알림.
사용자 맞춤형 시각화: 2색 또는 4색 스킴, LaR
**Laguerre RSI MTF — MetaTrader 5용 인디케이터** 개발자: Aleshin AlgoTrade | 버전: 1.06
간단 소개: Laguerre RSI MTF는 Laguerre RSI 개념을 기반으로 한 고급 멀티타임프레임 인디케이터입니다(John Ehlers 영감). 여러 시간프레임에서 시장 모멘텀을 빠르게 분석하여 의사결정과 전략 구성에 도움을 줍니다.
주요 기능: - 최대 5개 시간프레임의 MTF 계산(적응형 바 수). - Laguerre 필터 튜닝용 Alpha 파라미터. - 2색/4색 다이나믹 컬러 스킴(과매수/과매도 표시). - 차트 내 MTF 패널과 가중 종합 신호. - 모든 선택 TF의 합의 시 표시되는 신호 화살표. - 향상된 알림: 데스크탑 알림 및 푸시 알림 지원. - 입력 검증 및 0으로 나누기 방지 등의 안정성 강화.
주요 입력: Source Price, Alpha (0.0–1.0), ColorChange, U

Enhance Your Technical Analysis with Stats Summary . The Stats Summary is a robust analytical tool developed for MetaTrader 5 (MT5), providing a detailed statistical overview of price behavior. Unlike traditional indicators, it uses descriptive statistics to map the distribution of prices over a customizable sample period. By defining the sample size, the indicator calculates and displays the following values on the chart: Minimum and Maximum (Min/Max): The complete price range of the selected i
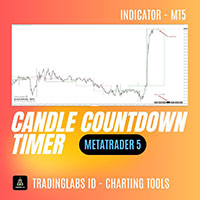
Candle Timer Countdown (CTC) – Minimalist & Precise Candle Timer Candle Timer Countdown (CTC) is a lightweight and non-intrusive MetaTrader indicator that displays the remaining time of the current candlestick on your chart. Designed with simplicity and clarity in mind, this tool helps traders stay aware of candle closures without cluttering the chart. Key Features: Real-Time Candle Countdown
Always know how many seconds are left before the current candle closes – works on all timeframes. Minima
FREE

Burning Scalper - Advanced MFI Trading System
Indicator Description
Burning Scalper is a comprehensive trading system based on an enhanced Money Flow Index (MFI) indicator, designed for precise identification of market entry and exit points. The indicator combines volume and price analysis, providing traders with a complete picture of market dynamics.
Key Features
Intelligent Trading Signals
The indicator automatically identifies optimal market entry points by analyzing extre
FREE

Projection of Phi Is a technical indicator that calculates dynamic support and resistance levels. It uses angular geometric projections and mathematical ratios to identify market expansion ranges. Features: Dynamic Fibonacci Expansion: Extension level projection Geometric Calculation: Angular analysis and mathematical ratios Visualization: Graphical objects with informative labels Compatibility: M1 to H4 timeframes Applications: Identification of zones for trade management Analysis of volatil

INTRODUCING the Powerful Daily Bias Indicator
The Daily Bias Indicator
Stop Guessing. Start Trading with Confidence.
Tired of staring at your charts and not knowing if today is a buy day or a sell day? The Daily Bias Indicator does the heavy lifting for you.
It scans the market using 7 powerful tools (EMA trend, RSI, MACD, ADX, Volume, Pivot Points & Price Action). It tells you in plain language:
“TODAY: BUY ONLY”
“TODAY: SELL ONLY”
Or “NO CLEAR BIAS” (so you don’t waste money
FREE

FRONTIER PIVOTS - Geometric Levels Indicator This indicator plots support and resistance levels/ranges on the chart using mathematical calculations. It helps traders identify potential price reaction zones based on geometric patterns. Main Features: Automatically calculates and displays key price levels Plots both support and resistance lines Uses daily price data for level calculation Clean visual presentation with different colors for different level types No repainting - levels remain static
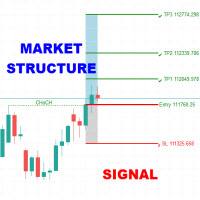
The Market Structure Signal indicator is designed to detect Change of Character (CHoCH) and Break of Structure (BOS) in price action, helping traders identify potential trend reversals or continuations. It combines market structure analysis with volatility (ATR) to highlight possible risk/reward zones, while also supporting multi-channel alerts so that no trading signal is missed. Interpretation Trend Analysis : The indicator’s trend coloring, combined with BOS and CHoCH detection, provides an i
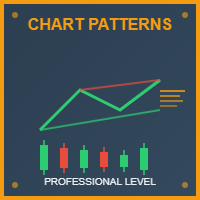
All-in-One Chart Patterns Professional Level: The Ultimate 36-Pattern Trading System All-in-One Chart Patterns Professional Level is a comprehensive 36-pattern indicator well known by retail traders, but significantly enhanced with superior accuracy through integrated news impact analysis and proper market profile positioning. This professional-grade trading tool transforms traditional pattern recognition by combining advanced algorithmic detection with real-time market intelligence. CORE FEATU
FREE

Fisher Transformation Indicator for MT5 – Spot Trend Reversals Before They Happen! The Fisher Transformation Indicator is your go-to tool for crystal-clear market movement detection. Through mathematical transformation of price data, it delivers unmistakable buy and sell signals – right there in your chart where you need them.
Key Benefits: Early Warning System for Trend Changes – catch uptrends and downtrends before the crowd Crystal Clear Buy & Sell Signals – color-coded for instant recogniti
FREE
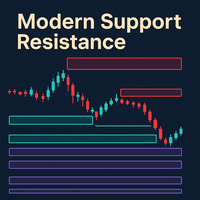
Dynamic S/R indicator that creates zones from fast/slow fractals, merges them if they overlap, classifies them (Possible, Untested, Verified, Turncoat, Weak), highlights the one closest to current price, and sends alerts when price enters the area. It supports testing mode, visual themes, zone extension/merge, global variables for EA integration, optional display of broken zones, and an adaptive ATR-based fuzz filter (with automatic fallback).
My indicators for free. I only ask that leave your
FREE
Nexus 6.1 (MT5) - Neural Network Binary Options Indicator Nexus 6.1 (MT5) Neural Network-Powered Binary Options Indicator for MetaTrader 5 What is Nexus 6.1? Nexus 6.1 is a neural network–driven signal indicator specifically built for binary-options style trading. It generates accurate CALL/PUT decisions exactly at candle open, allowing you to set your expiry to the candle duration (or a small multiple) and act immediately—without guessing mid-bar. Why Traders Choose Nexus 6.1 Candle-start sign
Welcome to the Pair Spread Oscillator by Xignal Coding!
Ever wondered if you could monitor one asset against another—typically correlated—and spot opportunities? That’s exactly what you can do with the Pair Spread Oscillator! The Pair Spread Oscillator calculates the distance between your selected instruments and provides the mean distance and the standard deviation of your choice. This way, you can easily identify when these two instruments are moving in different directions and act before the

BluePrint Adaptive Trader - Professional Trading System Advanced Channel Trading System based on our proprietary TrenderFlex PRO algorithm Learn more about TrenderFlex PRO KEY FEATURES • TrenderFlex PRO Channel Technology - Advanced channel calculation based on our proven algorithm
• Adaptive Risk Management - Automatic TP/SL calculation based on channel width
• Win Rate Statistics - Real-time tracking of TP1, TP2, TP3 success rates
• Multi-Timeframe Analysis - Monitor 7 timeframes simultaneou
Chart Scalper v1.01 Professional Trading Indicator for MetaTrader 5 OVERVIEW Chart Scalper is an advanced technical indicator designed to accurately identify optimal market entry and exit points. Using a sophisticated price reversal analysis algorithm, the indicator automatically detects significant trend changes and generates clear visual signals for buy and sell trades.
KEY FEATURES Accurate Trading Signals
Automatically detects trend reversals based on configurable parameters Generates

Category: Trend Indicator
Platform: MetaTrader 5
Type: Level Indicator
Timeframes: All
Trader Styles: Scalping, Day Trading, Swing Trading
Markets: All Description The Madrid Ribbon is a moving average–based trend visualization tool. It combines multiple exponential or simple moving averages into a ribbon structure that adapts to market changes. The indicator highlights trend direction, possible reentry zones, and areas where reversals may occur. Main features: Dynamic Trend Display – Multiple m
RENKO SCALPER - PROFESSIONAL TRADING INDICATOR OVERVIEW RENKO SCALPER is an advanced technical indicator designed specifically for professional traders looking to maximize accuracy in their scalping and intraday trading. Based on the adaptive Renko brick methodology, this indicator combines dynamic volatility algorithms with automatic buy/sell signals to provide a superior trading experience.
MAIN TECHNICAL FEATURES Adaptive Renko Analysis Dynamic brick calculation based on ATR (Average
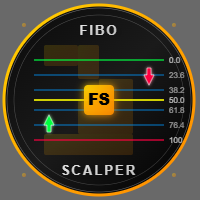
Fibo Scalper is a specialized indicator for traders who use Fibonacci retracements in short-term trading. It automates level drawing and generates rebound signals, saving time and reducing human error. Its customization and adaptability to different sessions make it a valuable tool for scalpers and day traders.
Fibo Scalper is a technical analysis tool designed for short-term trading (scalping). Its main function is to automatically draw Fibonacci retracement levels based on the price range of
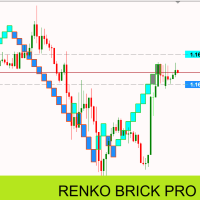
Renko Brick Pro - Advanced Renko Indicator for MT5 Professional Renko bricks with intelligent ATR sizing and ready-to-use EA integration buffers. Renko charts eliminate market noise by creating bricks only when price moves a specific amount. Unlike traditional price charts, each brick represents the same price movement, giving you cleaner trend identification and better entry points. This indicator brings true Renko analysis to MT5 with intelligent ATR-based brick calculations that automatically
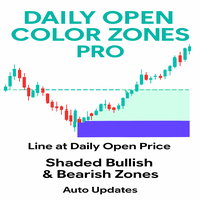
This indicator is a professional tool designed to plot the Daily Open Line and instantly shade the bullish and bearish price zones around it. Instead of leaving traders guessing, it delivers a clear visual map of market sentiment from the very first of the day. Its goal: to help you instantly identify whether the market is trading above or below the daily open — a key reference point for intraday strategies.
The indicator automatically draws a horizontal line at the daily open price and shades
FREE
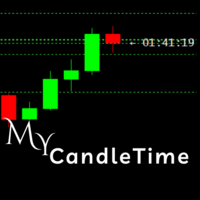
My CandleTime
This indicator displays the remaining time until the current candle closes directly on the chart.
It is designed to help traders keep track of candle formation without constantly checking the platform’s status bar. Main Features Shows countdown timer for the active candle. Works on any symbol and timeframe. Lightweight, does not overload the terminal. Adjustable font size and name. How to Use
Simply attach the indicator to a chart.
You can customize font size, color, and font to
FREE
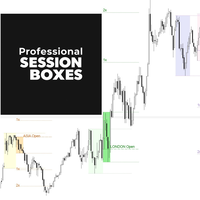
Professional Session Boxes – Multi-Market Trading Sessions Indicator Transform your trading charts from confusing price action to clear, actionable market sessions. Join hundreds of successful traders already using Professional Session Boxes , the ultimate MT5 session indicator , to time their entries perfectly. Transform Your Trading with Color-Coded Market Sessions Never miss a trading opportunity again! This professional-grade Forex volatility tool automatically highlights the most important

GorMaster_Pro — Sesgo confiable, noticias y técnica en una sola pantalla Visión GorMaster_Pro es una herramienta indispensable para cualquier tipo de trader (scalper, intradía o swing) porque combina información fundamental y técnica para darte una lectura fiel y accionable del mercado.
En una sola vista verás: sesgo direccional BUY/SELL/RANGO , ventanas de noticias en tiempo real que congelan la operativa, métricas técnicas clave (ATR_Z, RangeRatio, ADX, SpreadZ), sesiones y alertas . Todo org
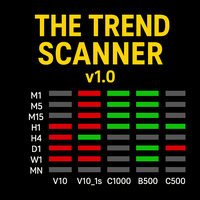
The Trend Scanner – Multi-Timeframe & Multi-Asset Analyzer Discover market direction at a glance!
The Trend Scanner is a powerful tool designed for Boom & Crash, Volatility Indices, Jump Indices, and even Forex (EURUSD) , allowing traders to instantly spot bullish or bearish trends across multiple assets and timeframes in a single, easy-to-read window. Key Features: Monitors trends from M1 up to Monthly . Covers a wide range of assets:
Boom & Crash Indices
Volatility Indices
Jump Indice

Price Predictor Pro Turn Market Patterns into Predictable Profits!
Are you tired of guessing where the market will go next? With Price Predictor Pro , you’ll trade with confidence by spotting powerful chart patterns and receiving precise price projections —directly on your MT5 chart.
What Price Predictor Pro Does: ️ Detects high-probability chart patterns like Double Tops, Double Bottoms, Head & Shoulders, Flags, Pennants, and more . ️ Instantly projects the next price target using adv
FREE

Clear Candle Countdown for Every Chart Knowing the exact time left until the current candle closes helps in making timely trading decisions. Candle Timer Essential MT5 offers a visible countdown for all available MT5 timeframes directly on your chart. This tool is reliable, efficient, and easy to configure. Features Real-time candle countdown for all standard MT5 timeframes Customizable color scheme for header, timer, and description Auto-adaptive layout for optimal visibility on any chart Effic
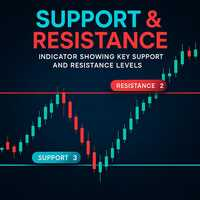
Discover the Strongest Support and Resistance Areas. This indicator is an advanced tool for identifying and plotting support and resistance levels on a chart. Instead of using a simple method, it follows a dynamic approach to identifying the most important levels. Its goal: to find important highs and lows that represent potential price reversal points.
The indicator analyzes three different time frames that you specify in the inputs: TF1, TF2, and TF3. Support and Resistance is the profession
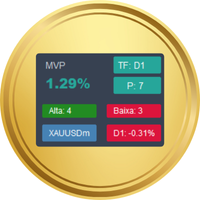
Market Variation Pro (MVP) is a unique indicator in the market, easy to use and configure, and works on any time frame and any asset .
It calculates the average percentage variation of any asset over a defined period. Unlike indicators that only analyze the closing price, MVP considers the entire price range, providing a more comprehensive view of market behavior. Main functionalities Volatility measurement Quantifies average volatility in percentage terms Compares volatility across different a
Range Pullback Limits – Smart Buy/Sell Zone Indicator for MT5 Range Pullback Limits is a professional MT5 indicator that automatically marks potential Buy Limit and Sell Limit levels during ranging markets. It helps traders identify high-probability pullback zones and avoid trading when the market is trending strongly. *Note: Combine this indicator to filter entry points - https://www.mql5.com/en/market/product/149443 Key Features Works on Forex, Gold (XAUUSD), Crypto, Indices, Stocks Detects r
FREE

Tired of manually clicking through every chart just to check the current spread or overnight swap fees? The Dynamic Spread and Swap is a must-have utility that solves this problem by displaying all critical cost information for your favorite trading symbols in one clean, convenient dashboard. This lightweight tool automatically detects all symbols from your open charts and presents the data in a non-intrusive panel on your screen. Stop guessing your trading costs and start making more informed
FREE

This MetaTrader 5 indicator plots **two moving averages** on the price chart:
**Two main MAs (Fast & Slow)**: These are displayed as lines (blue and red) with a colored fill between them. The fill visually represents the gap between these two moving averages. Traders can use this indicator to: - Identify trend direction (when lines are stacked in order) - Spot potential crossover signals (when lines cross each other) - Gauge market momentum (based on the spacing between lines)
The fill betwee
FREE
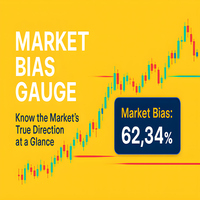
Measure Market Strength at a Glance – Instantly
The Momentum Percentage Label is a sleek, professional tool designed to give traders an instant, crystal-clear view of market momentum – directly on their chart. Forget complex setups or cluttered indicators. This tool delivers a single, powerful metric: the percentage of bullish vs. bearish movement over your chosen period.
Its purpose: to help you instantly gauge whether buyers or sellers are in control, so you can make faster, more confident
FREE

Trend flow ICT helps you quickly assess the strength and direction of the trend on the chart. *Note: Free indicator included - https://www.mql5.com/en/market/product/149447
Configuration guide Score: The length of the scoring window. Smaller → more sensitive, prone to noise. Larger → smoother, less signals. ATR: ATR period to standardize fluctuations. Trend threshold: Threshold to confirm a trend. Strong trend: Strong trend threshold. Min Body (x ATR): Minimum candle body to confirm a breakou
FREE
Product Overview Enhanced MACD Pro is an advanced implementation of the classic MACD (Moving Average Convergence Divergence) indicator, enhanced with professional features for serious traders. This indicator combines traditional MACD analysis with modern alert systems and visual optimizations. Why Choose Enhanced MACD Pro? Multiple Alert Systems : 3 different alert modes to catch every trading opportunity Customizable Parameters : Full control over all MACD settings Professional Visualization
FREE

On Off Trade On Off Trade — это индикатор для MetaTrader 5, который выводит прямо на график статус рынка и расписание торговых сессий. Возможности: Показывает, открыт ли рынок сейчас ( СТАТУС: РЫНОК ОТКРЫТ / ЗАКРЫТ ). Отображает активную торговую сессию: время начала и окончания. Если рынок закрыт — указывает, когда начнётся следующая сессия. По желанию можно включить полное расписание всех сессий на неделю с подсветкой текущего дня и активной сессии. Автоматическое обновление данных кажды
FREE

This MQL5 indicator, named BoS_ChoCh_Indicator, detects Break of Structure (BoS) and Change of Character (ChoCh) in trading charts. It identifies pivot highs and lows using a user-defined period (default 5), monitors price breakouts above highs or below lows, classifies them as bullish/bearish BoS or ChoCh based on the prevailing trend, draws colored lines and labels on the chart for visualization, and populates buffers with signals, structure levels, and trend direction (1 for up, -1 for down)
PortfolioVaR Multi-Label Indicator: Your Ultimate Risk Manager Are you a serious trader who holds multiple positions across different symbols and currencies? If so, you need a clear, objective measure of your total portfolio risk. The PortfolioVaR Multi-Label indicator is the essential tool you've been waiting for, providing real-time, consolidated risk data directly on your MT5 chart. What is Value at Risk (VaR)? Value at Risk (VaR) is a fundamental concept in finance that measures the potentia

Smart Stochastic Divergence Detector Description:
The Smart Stochastic Divergence Detector is a professional tool that automatically identifies Bullish & Bearish Divergences on your chart using the Stochastic Oscillator .
It helps traders detect early reversals , hidden momentum changes , and trend continuation signals without the need for manual analysis. Whether you trade Forex, Indices, Stocks, or Crypto , this tool provides clear divergence signals with arrows and trendlines – allowin

Unlock the Market's Hidden Blueprint with Advanced Pattern Recognizer Tired of staring at charts, struggling to spot high-probability trading opportunities? What if you had a professional analyst scanning the markets 24/7, drawing perfect trendlines, and calculating precise profit targets for you? Introducing Advanced Pattern Recognizer for MetaTrader 5 – Your Automated Technical Analysis Powerhouse. This isn't just another indicator. It's a sophisticated algorithmic engine designed to do the he
Smart FVG Levels Indicator for MT5 Category Platform Level Type Time frames trader style market ICT
SMC Indicator
Meta Trader 5
Level Indicator
Level Indicator
All Time frames
Scalpers
Day Traders
Swing Traders
Position Traders
All Type of Markets
Introduction The Smart FVG Levels Indicator for MT5 is a powerful trading tool designed to help you identify Fair Value Gaps (FVGs) automatically on your charts. Whether you are a beginner or an experienced trader, this ind

Impulse System MTF – Smarter Multi-Timeframe Trading Trend & Momentum Signals (Inspired by Triple Screen Ideas) Multi-Timeframe (MTF) Impulse System indicator independently developed by the author.
Inspired by the Triple Screen methodology described in The New Trading for a Living by Dr. Alexander Elder, this indicator combines trend and momentum signals to help traders identify potential entry and exit points.
This is an original implementation with MTF functionality and is not an official prod
MetaTrader 마켓은 개발자들이 거래 애플리케이션을 판매할 수 있는 간단하고 편리한 사이트이다.
제품을 게시하고 마켓용 제품 설명을 어떻게 준비하는가를 설명하는 데 도움이 됩니다. 마켓의 모든 애플리케이션은 암호화로 보호되며 구매자의 컴퓨터에서만 실행할 수 있습니다. 불법 복제는 불가능합니다.
트레이딩 기회를 놓치고 있어요:
- 무료 트레이딩 앱
- 복사용 8,000 이상의 시그널
- 금융 시장 개척을 위한 경제 뉴스
등록
로그인
계정이 없으시면, 가입하십시오
MQL5.com 웹사이트에 로그인을 하기 위해 쿠키를 허용하십시오.
브라우저에서 필요한 설정을 활성화하시지 않으면, 로그인할 수 없습니다.