 MetaTrader 5
 Experts
 지표
 라이브러리
 유틸리티
 위젯
 규칙
MetaTrader 5용 무료 기술 지표 - 71
 기술 지표의 시그널은 주식 및 외환 시장에서 거래를 개시 및 종료하는 데 중요한 역할을 합니다. 지표의 본질은 미래의 가격 변화를 예측하기 위한 금융 시그널 값의 수학적 변형입니다.
기술 지표를 테스트하여 시장 행동과 그로 인한 이익을 더 잘 예측할 수 있습니다.
This is a free helper indicator for MT5 that will help traders setup their constant volume charts depending on their trading style. It will calculate the number of ticks that your constant volume chart should have depending on the following trading styles: Scalper Active Day trader Day trader Swing trader Position trader Instruction video attached.
Enjoy!
FREE

3 Moving averages crossover , with customizable Notifications and pop ups. Comment for any ideas. Its a demo version , could use some work, hope you at least find it useful. Hit me up with anything or any ideas you feel might be helpful and i will try and add them in if i get the time. Thank you. This version is free as of now . I can't promise anything about the future. But enjoy and have fun. Truly PVRPLE BLVCK. PS don't forget to share and like.
FREE
"Moving Ratio Candle" is used to check the distance of a candle to a theoretical pressure point. Furthermore, we have two points of interest, the first for the mean and the second for the median. This indicator uses the shape of bars and the line that crosses the bar from left to right is based on the calculation of the closing price for both sides. The rest follows a more standard calculation. The same could be done as a line, but I want to know the behavior of this indicator in relation to the
FREE
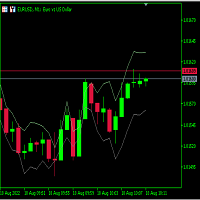
Just learning how to create an indicator from this tutorial .
its just a garbage text to fill the descriptions. Hello there. Hello there Hello there Hello there Hello there Hello there Hello there Hello there Hello there Hello there Hello there Hello there Hello there Hello there Hello there Hello there Hello there Hello there Hello there Hello there Hello there
FREE
The Choppery notifier is an indicator that has been developed and tested for the purpose of alerting you that a candle is about to form, it takes away the trouble of having to play a guessing game as to when next a candle will form after a trend, therefore most of the time it eliminates the thought of having to predict which direction price will begin to move at. This indicator can be used in any timeframe, a notification will be sent out to you via email when price moves. you can start at a min
FREE
RCH FX Spread + Bar Close Countdown Indicator
What This Indicator Does
A simple, professional tool that displays real-time spread information and bar closing countdown directly
on your MT5 charts.
Key Features
• Real-time spread display - Shows current spread in pips or points
• Bar close countdown timer - Exact seconds remaining until current bar closes
• Customizable alerts - Audio notification before bar closes
• Fully adjustable display - Position, colors, fonts, and sizing options
• Works o
FREE

(Special New Year promotion - free price!) The indicator displays the actual 'Scale in points per bar' (identical to the manual setting in the Terminal, see screenshot)
in the upper right corner of the chart.
The displayed value changes INSTANTLY whenever the chart scale is changed! (This is very convenient when planning screenshots).
In Settings: Change language (Russian/English), font size of the displayed text, text label offset coefficient from the graph corner, equally in X and Y directi
FREE

Dynamic Theoretical Stop
Histogram indicator that dynamically analyzes the theoretical Stop levels in real time.
Operation :
The DTS - Dynamic Theoretical Stop does a mapping of fractals in previous candles and suggests two levels of Stop: For purchase and for sale.
Suggested reading :
It is necessary to make the definition of Maximum Stop in points in the Trading Plan. In this way, the trader can decide the best entry point by analyzing the theoretical stop levels:
Stop for sales: Shown a
FREE
Индикатор отображает изменение баланса В правом нижнем углу окна.
Отображаются следующие периоды Сегодня Вчера 3 дня Неделя 10 дней Месяц 3 месяца Полгода Год Все время Есть возможность выставить расчетное время. Удобно пользоваться для расчетов прибыли/убытков с определенного часа.
Будет полезен например ночным скальперам. Данные совпадают с расчетами отчета в терминалее.
FREE

Not everyone can write an indicator. But anyone can have an idea. The indicator Universal Main Window Free MT5 , which takes as an input parameter the formula by which the indicator line will be drawn, will help to implement it. This indicator is intended for use in the main chart window.
All indicators of the series Universal :
Main window Separate window Free MT4 Universal Main Window Free MT5 Universal Main Window Free MT5 MT4 Universal Separate Window Free MT5 Universal Separate Window Fre
FREE

Привет. Сегодня представляем индикатор корреляции - SynchroWindowTomson. Индикатор в одном окне показывает движение нескольких инструментов, по отношению друг к другу, удобно определять направление и изменение, особенно когда вы работаете с целым портфелем разных инструментов и нужно определить какой из них тянет результат назад и движется в другую сторону. Так же видны точки разворота спреда.
FREE
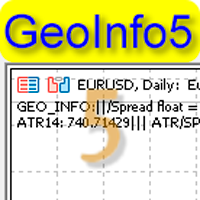
GeoInfo5 is one of the most informative indicators, it displays basic information about a trading instrument in a compact form. The version for the Meta Trader 4 terminal has gained wide popularity among traders. The indicator is free and will always be free. The launch version is now available for MetaTrader 5 as well.
displays information about the main parameters of the tool in a brief form in the line in the upper left corner of the chart: Spread, Swap for Buy order, Swap for Sell order, c
FREE

Display the date, time and price according to the movement of the mouse cursor on the chart This is useful for discretionary trading.
It is an indispensable tool for verifying and studying past market prices and trades. Characteristic Date,Time and Price are displayed.
The value follows the movement of the mouse.
You can change the color of the text. Please refer to the video on youtube. For MT5 only.
FREE
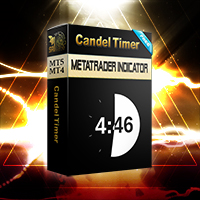
300 downloads without review ? !!!!
If continued. I will not share any product for free. :( Small and very simple timer next to the current price to show the end time of the current candle
Very useful and important for scalpers and those who work on price action.
We assure you that we welcome any suggestions to improve this indicator and make the necessary changes to improve this indicator.
You can contact us via Instagram, Telegram, WhatsApp, email or here. We are ready to answer you.
FREE
BB Out Arrows is a powerful and intuitive indicator designed for MetaTrader 5 (MT5) that enhances trading strategies using Bollinger Bands. This indicator signals potential trading opportunities by displaying arrows when a candle closes outside of the Bollinger Bands, but with an added layer of precision through a wick percentage filter. Key Features: Bollinger Bands Integration: Utilizes the classic Bollinger Bands to identify market volatility and potential price reversals. Arrows Indicati
FREE

IDNR4 — Indicator Description (English)
The IDNR4 (Inside Day Narrow Range 4) is a volatility-compression pattern that identifies potential breakout conditions. It combines two concepts: NR4 (Narrow Range 4)
The current bar has the smallest high–low range compared to the previous three bars. Inside Bar (ID)
The current bar’s high and low are fully contained within the range of the previous bar. Signal Logic
• When the bar is NR4 only , it is highlighted as a normal contraction pattern.
• Wh
FREE

추측은 이제 그만. 정확한 트레이딩을 시작하세요.
QTS 슈퍼 하이브리드 플래티넘은 단순한 지표가 아닙니다. 정확성과 안전성을 중시하는 스캘퍼와 데이 트레이더를 위해 설계된 완벽한 트레이딩 시스템입니다. 기관 투자자의 가격 움직임(SNR)과 추세 모멘텀(트리플 EMA)의 강력한 기능을 결합하여 시장의 노이즈를 걸러내고 높은 확률의 매매 기회만을 제공합니다.
QTS 슈퍼 하이브리드 플래티넘을 선택해야 하는 이유? 이 도구는 트레이더들이 직면하는 세 가지 주요 문제, 즉 잘못된 신호, 과도한 거래, 그리고 기회 상실을 해결하기 위해 개발되었습니다.
플래티넘 기능:
자동 추세 및 SNR 로직: 주요 투자자의 추세(장기적인 추세 편향)를 자동으로 식별하고 핵심 지지/저항 수준을 표시해 줍니다.
모바일 푸시 알림: 다시는 거래 기회를 놓치지 마세요! 유효한 신호가 발생하면 휴대폰으로 즉시 알림을 받으세요. 이동 중에도 편리하게 거래할 수 있습니다.
고스트 타
FREE

CANDLESTICK PATTERN DETECTOR
Most candlestick indicators put a green or red arrow on every formation and leave you to guess which ones matter. Candlestick Pattern Detector reports each pattern as four separate pieces of information, so you can judge it instead of just following an arrow:
- Direction: Bullish, Bearish or Neutral - Type: Reversal, Continuation, Momentum or Indecision - Strength: Weak, Moderate or Strong (a structure score, explained below) - Status: Detected, Confirmed or I
FREE

Hollow Candles MA - Hollow Candles 전용 전문 트렌드 지표 Hollow Candles MA는 Hollow Candles 차트에 특화된 깔끔하고 효과적인 트렌드 추종 지표입니다. 종가와 빠른 이동평균을 비교하여 현재 시장 추세를 캔들 색상으로 명확하게 표시합니다: DodgerBlue = 상승 추세 (Close ≥ Fast MA) 빨간색 = 하락 추세 (Close ≤ Fast MA) 이 지표는 Hollow Candles 차트에서 추세 방향을 높은 명확성으로 시각적으로 파악할 수 있게 도와주며, 강한 움직임을 쉽게 따라가고 횡보 장을 피하는 데 유용합니다. 주요 특징: Hollow Candles 차트 유형에 최적화 간단하고 신뢰할 수 있는 추세 감지 DodgerBlue와 빨간색을 사용한 깔끔한 시각 신호 시스템 리소스 사용량 매우 낮음 완전 커스터마이징 가능 매개변수: Fast MA Period: 이동평균 기간 (기본 14) MA Method: SMA, EMA,
FREE

Table Royale — Product Description The best traders know how to wait. The smartest ones know how to stay busy in the meantime. Table Royale turns your MetaTrader into a trading floor… and a gaming table. An elegant panel, a 52-card deck, and 25,000 € in virtual chips to spice up your idle hours. Hit, stand, double down — real Black Jack, right inside your chart. Available in 7 languages: Français · English · Español · Italiano · Deutsch · 日本語 · 中文 30-second set
FREE

Nebryx BandPulse Matrix Professional Bollinger Bands Volatility Context Indicator for MetaTrader 5
PRODUCT OVERVIEW Nebryx BandPulse Matrix is a clean volatility-context indicator built around Bollinger Bands. It is designed for traders who want more than a standard band overlay. The indicator combines classic Bollinger Bands with volatility squeeze detection, expansion confirmation, band-walk trend context, stretch/overextension markers, and a compact chart status label.
The product focuses
FREE

Kijun Retest Pro identifies high-probability continuation signals on any instrument and timeframe, marking each opportunity directly on your chart with a clear arrow. Signals are generated when specific market conditions align across multiple internal checks. A cyan appears below the bar for buy signals, a red above the bar for sell signals. Signals never repaint All signals are calculated on fully closed bars only. An arrow that appears will never move or disappear. What you see on historic
FREE

Market Analysis, Market Structure, Price Action, Trend Analysis, Bullish, Bearish, Range Market, Directional Bias, Market Dashboard, Trading Dashboard, Trend Detection, Market Scanner, Market Context, Breakout Analysis, Consolidation Analysis, Trend Filter, Technical Analysis, Real Time Analysis
This indicator analyzes price behavior in real time and classifies market conditions into Bullish , Bearish , Range , and Neutral scenarios. Price is continuously evaluated relative to a dynamic referen
FREE

Horizontal lines on the chart alternate between solid and dashed styles, representing areas of interest based on significant highs and lows from different timeframes, creating potential confluence between market structures. The indicator is designed to assist each participant in their own market studies, giving users the flexibility to combine the indicator with their personal trading system and analysis methods . The lines should not be used as standalone entry triggers . Instead, they are inte
FREE

Fibonacci Confluence Suite Short description Fibonacci Confluence Suite is a chart-window indicator for MetaTrader 5. It builds a Fibonacci grid from confirmed swing highs and lows, marks the levels where projections from earlier swings overlap, and adds a Golden Pocket zone, Fibonacci time zones, touch statistics and a compact status panel. All levels are calculated from closed bars only. Overview Drawing retracement levels by hand usually means three separate steps: finding the swing, pulling
FREE

SweepReversalMap — 유동성 스윕 반전 구간 매핑 지표 개요
SweepReversalMap은 Price Action 기반의 사용자 지정 지표로, 시장의 «Liquidity Sweep»(유동성 스윕) 이벤트를 식별하고 가격이 reclaim된 후 잠재적 반전 구간을 매핑합니다. 모든 거래 상품과 시간 주기에 적용할 수 있습니다. 핵심 로직 스윙 포인트 감지: 사용자가 설정한 Swing Length를 기준으로 최근 유효한 스윙 고점 / 저점을 식별합니다. 스윕 판정: 가격이 스윙 고점을 상향 돌파(또는 스윙 저점을 하향 돌파)하고 ATR 필터의 최소 침투 임계값에 도달하면 후보 반전 패턴을 시작합니다. Reclaim 확인: 종가가 스윕 레벨 내부로 돌아오면 reclaim으로 간주합니다. 구조 돌파 확인: 종가가 추가로 로컬 구조 저점 / 고점을 돌파하고, 캔들 몸통이 ATR 필터의 최소 변위 요건을 충족하면 신호가 확정됩니다. 무효화 규칙: 최대 확인 바 수를 초과해도 확정
FREE

SR Power Channel — Support & Resistance Power Channel Indicator Overview SR Power Channel is a main-chart visual indicator built on price extremes and ATR. It locates the highest high (resistance) and the lowest low (support) within a configurable lookback window, extends those two levels to the right, and wraps them into ATR-based channel bands. The indicator also counts bullish and bearish bars inside the window and marks the moments when price breaks above or below the channel bands with dia
FREE

RSI Cloud — RSI Dual Moving Average Cloud Indicator This indicator calculates RSI in a separate window, applies fast and slow moving averages to the RSI values, and displays the relative position of the two averages as a filling cloud. It also provides an optional raw RSI line, fixed 70/50/30 reference levels, and arrow markers when the fast and slow RSI averages cross. The indicator is for analysis and signal filtering only; it does not place trades. How it works Wilder RSI is calculated from
FREE

Automatic Support and Resistance Levels with Breakout Tracking Product name note: the file name and the indicator short name in the source are AutomaitcSR . The correct spelling AutomaticSR is recommended before submission. Use one identical name for the file, the short name and the Market product title. Short description (for the Market product card) Automatic support and resistance levels built from confirmed swing pivots, with ATR-based filtering, optional level zones, breakout marking and a
FREE

ICT Strategy — Professional MetaTrader 5 Indicator
ICT Strategy built for traders who want a clearer, more organized view of the market through the concepts of Inner Circle Trader (ICT) and Smart Money trading. It brings important market structures, liquidity levels, price delivery zones, and trading-session information together in one professional charting tool.
Designed with clarity and precision in mind, ICT Strategy helps traders identify and visualize important ICT-related areas directly
FREE

ReaperFusion V1 - 3TF SMC Dashboard
Stop forced trades. Trade only STACKS.
WHAT IT DOES: 3 Timeframe Confluence (EXT Bias + INT Setup + LTF Entry) FVG 50% MCT Auto Detection Confluence Scoring 70%+ Filter - Only shows high quality Toggle Buttons + Alerts (No chart clutter) Works on XAUUSD, BTCUSD, All Forex
HOW IT WORKS: 1. EXT Timeframe defines bias 2. INT scans for 70%+ OB/FVG stack 3. LTF waits for Sweep + CHoCH entry 4. Dashboard shows WAIT or GO + Confidence Score
INPUTS: - Co
FREE

Jericho Gold Jericho Gold is a MetaTrader 5 indicator for support and resistance analysis and visual trade planning on XAUUSD. It displays price zones, buy and sell signals, and take-profit and stop-loss areas directly on the chart. The recommended chart timeframe is one minute. Main features Active support and resistance zones that extend to the right. Buy and sell signals with transparent target and stop areas. Completed trade-plan boxes drawn from simulated entry to exit. Separate trend, exha
FREE

================================================================================ SHORT TAGLINE ================================================================================ Institutional Smart Money Concepts: Real-time Market Structure (BOS/CHoCH), Order Blocks, Flipped Breaker Blocks, Fair Value Gaps (FVG), Premium/Discount Zones, and Live Volume Spike HUD.
================================================================================ FULL MQL5 MARKET PRODUCT DESCRIPTION ================
FREE

TIRED OF FALSE SIGNALS AND DISAPPEARING ARROWS?
Test the logic of Trend Reverting PRO completely for FREE on EURUSD (M5 & M15) and see the accuracy for yourself!
Hey trader, I know how frustrating it is to look at a beautiful chart history, only to realize the indicator changes its mind during live trading. That’s why I want you to test my algorithm completely risk-free. This is a fully functional free/demo version designed specifically for EURUSD on the M5 and M15 timeframes (works with sta
FREE

MSM Candlestick Support Resistance finds well-known Japanese candlestick patterns on your MetaTrader 5 chart and turns each one into a support or resistance level. When price closes through a level, the level changes its role: support becomes resistance and resistance becomes support. The indicator only draws levels; it does not open or manage trades. Patterns and their levels Hammer and shooting star (long shadow): the low of a hammer is support, the high of a shooting star is resistance. Engul
FREE

Wolfram — это математический индикатор, построенный на базе дискретных клеточных автоматов . Продукт разработан специально для трейдеров, стремящихся полностью исключить запаздывание стандартных индикаторов и выявлять моменты зарождения крупных импульсов до того, как они отобразятся на ценовом графике.
Фундаментальная логика и принцип работы
В основе алгоритма лежит побайтовый анализ локальной структуры рынка (цена-время) без использования классических скользящих средних и осцилляторов.
FREE

Big Move Map 는 차트의 모든 큰 움직임에 색을 입히고 그 수를 셉니다. 이 종목에서 큰 움직임이 얼마나 자주 나오는지, 마지막 큰 움직임 이후 몇 개의 바가 지났는지, 큰 움직임 사이의 보통 간격, 월별 큰 움직임 수, 그리고 10개의 기록적인 움직임과 그 날짜를 보여 줍니다. 큰 움직임은 몰려서 나옵니다. US500 D1 에서 큰 움직임이 있었던 날의 절반은 직전 큰 움직임 후 4일 안에 나왔고, 평균 간격은 19일이었습니다. 2012년 이후 기록적인 날은 2020년 3월 12일의 -10.62%였습니다. 마감된 바만 사용하므로 다시 그려지지 않습니다. 모든 수치는 출시 전마다 별도의 구현과 대조해 확인합니다. 기능 큰 움직임이 있었던 모든 캔들은 가격 차트에 색으로 다시 그려집니다. 큰 상승은 청록색, 큰 하락은 분홍색입니다. 10개의 기록적인 움직임에는 순위와 크기가 표시됩니다. 작은 패널에는 이 차트에서 큰 움직임으로 셀 만큼의 크기, 마지막 큰 움직임 이후의 바 수
FREE

Free session and opening range breakout indicator for MetaTrader 5: it draws the box of the time window you choose and marks the first closed bar outside it with an arrow that never moves or disappears. What it draws The box of the day. The high and the low of the closed bars whose open time is inside your window (server time), for example 07:00–10:00. Drawn as a rectangle, with dotted box-high and box-low lines until your last breakout time. The breakout arrow. After the window, the first close
FREE

RangePower Index is an MT5 indicator that accurately measures the strength of currencies, indices, gold and oil based on their daily range. Thanks to this, you will immediately know which assets have real momentum and which, on the contrary, are losing strength.
Daily range analysis (high–low) for currencies, indices, gold and oil Quick visualization of the strongest and weakest assets With RangePower Index you will gain a clear competitive advantage - trade only where there is real market
FREE

퀵샌드(Quicksand) 돌파 후 횡보 구간을 포착하여 되돌림을 방지합니다. 가격이 스윙 고점 또는 저점을 돌파한 후 그 바로 위에서 멈춥니다. 해당 레벨 안에서 종가가 형성되면 퀵샌드는 실패한 돌파를 명확한 화살표로 표시합니다. 파란색은 매수, 빨간색은 매도입니다.
돌파 후 횡보 구간을 포착하고, 급등하는 경우는 무시합니다. 차트에서 "횡보 구간"을 모래색으로 표시합니다. 종가가 표시된 캔들만 사용하므로 화살표가 다시 그려지지 않습니다. 진입, 손절매, 목표 수익 신호가 모든 알림에 포함됩니다. 스프레드, 캔들 타이머, 마지막 신호를 표시하는 간편한 대시보드를 제공합니다. 돌파 후 횡보 구간이 멈추는 즉시 알림을 받을 수 있는 옵션도 제공합니다. 팝업, 소리, 푸시 알림을 지원합니다.
FREE

# أومني تشارت ماستر إيه آي الكل في واحد MT5 — قمرة القيادة المؤسسية المستقلة
محرك رسم بياني متعدد النماذج بمستوى المؤسسات | أكثر ذكاءً من خطوط البيع بالتجزئة | بدون تأخير | بدون إعادة رسم
---
### ️ المشكلة: لماذا يعاني 90% من المتداولين الأفراد من "فرط استخدام المؤشرات"؟ كل متداول قام بفتح مخطط بياني وجعله غير قابل للاستخدام: 3 متوسطات متحركة تتقاطع مع بعضها البعض، وخطوط قطرية مرسومة يدويًا مع الشك، ومستويات فيبوناتشي مرسومة من أعلى مستوى خاطئ، ومذبذبات تعطي قراءات متضاربة.
عندما يبدأ ال
FREE

Price Density Profile Draws a horizontal histogram on the right side of the chart, showing where price spent most of its time, and uses it to mark key price zones as lines and bands. Similar to a Volume Profile , Market Profile / TPO, or price histogram, it helps you identify high-activity zones , support and resistance levels , the point of control , and low-activity gaps where price moved through quickly. What you see Histogram: a long bar means price visited that level often, and a short bar
FREE

Swing Structure MS shows market structure as a clean line of confirmed swing highs and swing lows. Swings can be taken from any timeframe (for example H1) and displayed on any chart, so you can follow the higher-timeframe structure while working on M5 or M15. How it works A swing high/low is a bar whose high/low is not exceeded by N bars on each side (Depth). A new leg is accepted only if its size is at least X times ATR, or a fixed number of points. Small noise is ignored. On a lower-timeframe
FREE

AMD SESSIONBOX draws the Asian, London and New York sessions on your chart as boxes: from the first bar of the session
to its end, and from the session high to the session low. Every box shows its range in pips, and an arrow marks the
first candle that closes outside the range of the session you choose. Popup, push and email alerts are included. WHAT YOU SEE ON THE CHART A box for every session: Asia (blue), London (green) and New York (brown) by default The overlap of two sessions (London + New
FREE
MetaTrader 플랫폼 어플리케이션 스토어에서 MetaTrader 마켓에서 트레이딩 로봇을 구매하는 방법에 대해 알아 보십시오.
MQL5.community 결제 시스템은 페이팔, 은행 카드 및 인기 결제 시스템을 통한 거래를 지원합니다. 더 나은 고객 경험을 위해 구입하시기 전에 거래 로봇을 테스트하시는 것을 권장합니다.
