MetaTrader 4용 새 Expert Advisor 및 지표 - 124

This is an indicator of trading sessions that can display all levels (Open-High-Low-Close) for four sessions. The indicator can also predict session levels. Sessions can be drawn with lines or rectangles (empty or filled), lines can be extended to the next session. You can easily hide/show each session by pressing hotkeys (by default '1', '2', '3', '4'). You can see ASR (Average Session Range) lines (default hotkey 'A'). This is similar to the ADR calculation, only it is calculated based on t

Forex 3D is a ready trading system for scalping on any currency pair. Recommended timeframe M5. The average number of transactions that we can open every day is from 5 to 15. This trading system is suitable for trading on all currency pairs, including gold and silver. Forex 3D is a very simple trading system suitable for forex beginners. It does not require additional market analysis using other trading instruments. We can focus exclusively on the technical analysis of this indicator and open o

The MoneyMint Trade Assist is a game-changer for traders. This all-in-one control panel puts the power of professional trading at your fingertips, empowering you to take your trading to the next level. With its intuitive design and feature-rich functionality, the MoneyMint Trade Assist simplifies the complexities of order entry and exit and gives you the edge you need to succeed. Whether you're an experienced trader or just starting out, this powerful tool will help you maximize your profits and
Breakout Consult mt4
Introducing the BreakOut Consult , the revolutionary tool that will take your trading to the next level! Our state-of-the-art algorithm combines multiple trend and oscillators to generate accurate buy and sell signals, making it a powerful tool for any trader. With BreakOut Consult, you can easily identify breakouts in the market with the help of our dynamic channel, which uses resistant and support levels to detect breakouts. Our algorithm detects two types of breakouts,
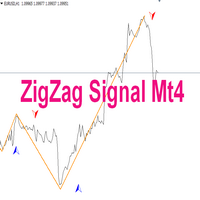
Indicator description: Indicator - ZigZag Signal is created on the basis of a well-known and popular indicator - ZigZag. The indicator can be used for manual or automatic trading by Expert Advisors. 1. The ZigZag Signal indicator has alerts of different notifications for manual trading. 2. If used in Expert Advisors, the indicator has signal buffers for buying and selling. You can also prescribe and call the indicator as an external resource and other settings and applications: (email me in a

"Sentiments of traders" in the financial markets is a topic that has been of interest to us for a long time. In time, we could not find the right formula to define these sentiments. We went through many stages in the search for the right methodology - from taking data from external sources to calculate open positions of buyers and sellers to calculating tick volumes, but still we were not satisfied with the results. The calculation of open positions of buyers and sellers from external sources ha

MT4-MT5 signals , the Expert Advisor version for MT5 . The expert analyzes 15 indicators in 5 signals. Thanks to this, he trades almost all week round, inside the day. The adviser can trade both completely independently, and there is an opportunity to open positions
independently, after which the expert will independently bring the matter to its logical end, that is, close
the position or positions in the plus, wherever the price goes.
You can try trading on your own in the strategy tester.
F

The Go Master trend indicator finds the current trend based on many factors. A simple and convenient indicator. The user can easily see the trends. It uses the basic trading approach widely described in the trading literature.
This is the first indicator designed to detect fluctuations in the direction of the trend and possible reversals. It works using a special algorithm and a set of internal indicators. You can use this indicator alone or in combination with other indicators according to yo

- This EA uses High Frequency Trading - This EA can be used for passing prop firm challenges - This EA can be used for Live Account Management - This EA makes an average of 2% - 4% profit per month - This EA never excedes a 5% DD - Parameters are adjusted monthly by the EA developer - Full refund will be provided if the bot fails a challenge - This EA has a 99% success rate at passing all challenges so far - Passes prop firm challenges in 2 weeks or less - We get clients 600K or more in prop fi
This version only supports orders with a single order transaction count of<1. If the single order transaction count is>1, please subscribe to a higher version This EA is not actively profitable, but only uses trading time to increase trading frequency and achieve the goal of saving swap fees.
Working principle: This EA will generate MQL4 Experts Orderhis before the trading deadline of the day_ The today.csv file is used to record the information that has been opened on the current day, generat
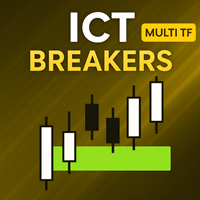
[ MT5 Version ] [ Order Blocks ] [ Kill Zones ] [ SMT Divergences ] How to trade using Order Blocks : Click here User Interface Performance: During testing in the strategy tester, the UI may experience lag. Rest assured, this issue is specific to the testing environment and does not affect the indicator's performance in live trading. Elevate your trading strategy with the Order Blocks ICT Multi TF indicator, a cutting-edge tool designed to enhance your trading decisions through advanced orde

Introducing our A.I Currency Strength Meter Forex Indicator, a state-of-the-art tool designed to provide forex traders with real-time insights into the strength of various currencies. Leveraging the latest advancements in artificial intelligence and machine learning, this innovative indicator analyzes market data in real-time, providing users with accurate and up-to-date information to inform their trading decisions. In addition to its cutting-edge algorithms, the Currency Strength Meter Forex I
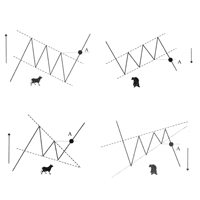
Скрипт проводит анализ трендов, выполняет поиск фигур продолжения и фигур разворота тренда по всем доступным инструментам окна Watch. Скрипт последовательно выводит несколько окон с сообщением о текущем состоянии: 1. Если в торговом терминале сохранено не достаточно цен по каждому инструменту или вам необходимо обновить цены по всем инструментам на актуальные после перерыва в работе, то проведите обновление. 2. Будет проведен анализ текущей тенденции активного графика. 3. На текущем графике п

MULTI-CURRENCY Expert Advisor, the main condition for work, a broker with a minimum spread and a fast VPS server.It shows itself well on EURCHF, GBPUSD and many other pairs. The requirement for the correct operation of the adviser: VPN with minimal delay to the broker. Recommended deposit from $ 50 (per symbol) Recommended broker with an ECN account. The Expert Advisor should be installed and tested only on the M15 timeframe!!!!
Before using the Expert Advisor, be sure to test it in the strateg

Golden Miner EA is an expert advisor designed for gold trading. This expert advisor is based on wave theory and uses multiple timeframes to intelligently determine the current trend and open orders. 使用环境及参数说明: Currency: Gold Minimum deposit required: $20000 or 20000 cents Leverage Requirement: 1:500 Spread : Within 30 points Usage: Load onto XAUUSD, M1 chart and select corresponding parameters Trading Volume: This expert advisor will automatically identify trading volume based on your selected
Intelligent ZigZag indicator.
It has only two settings. The higher the values, the more significant extreme values it shows.
Application area.
To determine the trend. Line drawing direction.
To recognize multiple patterns.
If you put two indicators on one chart with fast and slow values. By changing the color of one of them, you can very well decompose the price movement into waves.
The indicator can be a great helper for marking the chart and identifying the key levels from which the pri

All traders wait until the market calms down and only after that will they enter the market. They look at the monitor all the time. Now you no longer need to follow this, your best assistant will do it for you. You go about your usual business and calmly wait for the signal. And as soon as the spread reaches the value you set, you will receive an instant notification on your phone.
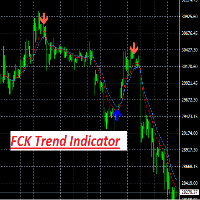
FCK Trend Indicator is an indicator for determining the current direction of price movement and reversal points. The indicator will be useful for those who want to see the current market situation better. The indicator can be used as an add-on for ready-made trading systems, or as an independent tool, or to develop your own trading systems. FCK Trend Indicator indicator, to determine the reversal points, analyzes a lot of conditions since the combined analysis gives a more accurate picture of t
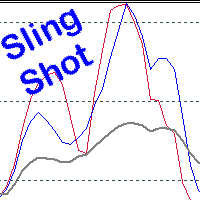
Scalping, Mean reversion or Position trading strategy
Get into an established trend on a pullback in the market. Use the Pinch in the indicator for profit taking. Use the Pinch as a mean reversion strategy, scalping back to a moving average line.
Input Parameters Fast Sling Shot configuration. Slow Sling Shot configuration. Dual Sling Shot configuration. Price line configuration. Trigger zones or levels. Example of Sling Shot trade idea: Price line sets the mood, below the baseline leve

Welcome to Gold Bloom World!
This forex robot, "Gold Bloom," is made for gold lovers around the world. The entry logic is sophisticated for the XAUUSD forex pair. The robot monitors the previous day's candle pattern and places a pending order in one direction. Take profit is determined by a trailing stop, while the stop loss is placed automatically based on the previous candle's price.
Simple input
Just enter initial lot size and set trailing stop.(points) For XAUUSD , please input points val
FREE

Based on my original trading strategy, it appears that this EA is programmed to use technical analysis to identify an inside candle pattern in the current candle and wait for a breakout in either direction. If the price breaks out higher, the EA will place a buy order, and if it breaks out lower, the EA will place a sell order. The take profit and stop loss levels are set at 50 pips each.
Additionally, using a martingale strategy, which involves increasing the lot size after a losing trade, ca
FREE
** All Symbols x All Time frames scan just by pressing scanner button ** *** Contact me to send you instructions and add you in "Triple MA scanner group" for sharing or seeing experiences with other users. Introduction: The triple moving average strategy involves planning three different moving averages to generate buy and sell signals. The third moving average is used in combination with the other two moving averages to confirm or deny the signals they generate. This reduces the probability t
FREE

I like a simple Robot and I will share with you. I can provide some information about using Simple Moving Average (SMA) as a trading strategy in Forex. SMA is a commonly used technical analysis tool in Forex trading. It calculates the average price of a currency pair over a specified period of time, and the resulting line can be used to identify trends in the market. Traders often use the crossover of different time period SMAs (e.g. 50-day and 200-day) to identify potential buy or sell signals.
FREE
Yo can watch the Robot trade here https://youtu.be/LkadOz4sedU
Remember to change THE MM POSSITION SIZING SETTING IN EA FOR YOUR ACCOUNT TYPE. MM POSSITION SIZING FOR MICRO ACCOUNT=3,000 TO 5,000 MM POSSITION SIZING FOR STANDARD ACCOUNT = 30,000 TO 50,000
This is the best EA you can find anywhere. It runs with the safest algorithm that monitors the market 24 hours 7 days. This product is good for everyone, it's user friendly with over 6000 lines of codes. Please read this instructions carefu

Fibonacci Currency Strength Meter (FCSM) Early Access Sale!!
This new product is still in the process of adding new features and settings. For early bird buyers. The Price will be 50% Sale. In a few weeks, the product will be done. Go Grab your copy while it's still cheap. More details will be added soon. Things to be added. Alert Levels Mobile and Email Alert
From it's name, Fibonacci Currency Strength Meter is a combination of Fibonacci levels and Currency Strength Meter. The plot of Fibona

OilForRent Expert Advisor.
Version: 1.00 date: 14/04/2023 Author: Pierantoni Fabrizio
Expert Advisor based on the interaction of signals from the market. Compare past and current signal levels across moving averages and RSI signal. The system is based on the trailing stop. Once the signal is in gain, the trailing stop is activated in search of the best gain. Automatic Stop Loss is used to escape from High Drawdown. The expert advisor is optimized for use with WTI on H1 timebase. The following

Moving Average Convergence/Divergence (MACD) The relationship between two exponential moving averages (EMAs) of the price of a securities is displayed by the trend-following momentum indicator known as moving average convergence/divergence (MACD, or MAC-D). The 26-period EMA is subtracted from the 12-period EMA to calculate the MACD line.
Features: Each entry has TP and SL to protect account.
Setup:
MAGIC: for EA entry identification fast_ema_period: entry detection
slow_ema_period: entry det

GPT Candlestick T he Indicator show algorithm of Candlestick Automatically. GPT Candlestick is a MetaTrader 4 Indicator that uses a proprietary algorithm based on Price of Moving Average and Average True Range to show the Color of Candlestick on your trading. Means candlestick is going Up or Down (View Simply). I nstead, it analyzes data of market and identify entry points and opportunities. I t's also a trading tool that be used to practice and enhance your manual trading skills. GPT Candlestic

Price activity can be graphically analyzed using candlestick patterns such the Harami cross, engulfing pattern, and three white soldiers. Many more candlestick formations can be created based on price activity to predict what will happen next. Other chart formats, such as point-and-figure charts, box charts, box plots, and others, can use the same forms.
Features:_______________ Monitors trade volume in market to determine perfect exit. Knows all the reversal candles
Setup:__________________ M

With PA analyzer you will see a different perspective of price action , once you have unlocked the full potential of it, this tool will be essential part of your trading system. PA Analyzer enables market price analysis and automatically marks support and resistance in all time frames. This indicator makes it easy to see whether the price is in range or trend, and generates dynamic profit take targets for the current time frame and the next higher time frame. This allows you to find target con

Trading Titan is an exceptional fully automated trading robot designed to work exclusively with EURUSD currency pair in H1 timeframe. This trading EA is based on advanced cluster analysis and genetic algorithms that provide self-adaptive market algorithms and reliable trading signals. The entry and exit logic of Trading Titan operates on Bar Close only, which eliminates market noise, speeds up optimization, and ensures that stop loss hunting is avoided, making it an excellent choice for trading

Thank you for seeing this information about the Forex Robot Matsuwa. It appears that the robot's main trading logic is based on analyzing the price gap between the current price and the price of the candlesticks that have passed over a specified barback period. Based on this analysis, the robot determines the future price trend and makes either a BUY or SELL order when the price gap reaches a certain intensity value. The EA template seems to have several functions, including Grid entry, trailin

The Zone EA is a Hedging EA using stop order. You can choose entry signal by manual/RSI/ADX/MA/BB or PowerTrend. EA can run any pair and any timeframe. Custom lot size are available to input for max 100 orders. If you dont use custom lot, just make custom lot size to be 0. Big balance or Cent account is recomended and broker with hedging allowed. Its best to get high rebate while you take your profit from position opened.
Note: Avoid an important news because some broker will freeze their candl
Your feedback is valuable and appreciated.
I appreciate feedback on where the application is weak and what improvements or features would be beneficial.
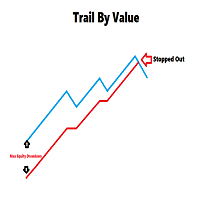
This is a utility for setting trailing stops by value. Trailing stops are great tools for locking in profits as a trade progresses. When trades progress towards potential targets confidence in the trade should be reflected in management of the trade. Market exposure persists for the duration of the trade, and the choice to remain in a trade is
FREE
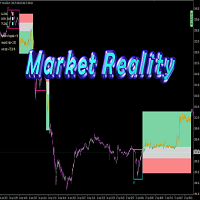
Hello, As you know more than 90% of people in the financial markets are losers, the most important reason is the lack of a proper fixed system and risk management. I want to introduce you to an indicator that is the result of my 8 years of experience, which shows you the reality of the market. My human dignity does not allow me to guarantee the future, but the table below shows the past statistics of this indicator and its performance which really the market past is the only way to find out the
Introducing Trend Fusion 444F, a powerful MQL4 indicator designed to determine market direction using multiple trading indicators. This comprehensive tool offers a unique fusion of technical analysis techniques that help traders make informed decisions in various market conditions. Key Features: Comprehensive Analysis: Trend Fusion 444F combines several widely-used trading indicators to provide a multi-dimensional view of the market. The indicators include Moving Averages, MACD, RSI, DeMarker,
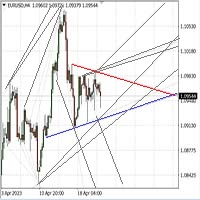
Автопостроение трендовых линий. Отрисовка множества линий, потенциальных границ роста\падения цен (серый цвет линий) Выявление и отрисовка канала цен (зеленый цвет линий) Выявление потенциальных треугольников ТА (красный и синий цвет линий) Рекомендуется использовать белый фон графика, период графика - М30. Настройки
Interval=200 - максимальное количество баров, используемых в анализе для построения линий. The_greatest_distance=5 000 - регулирует максимальное удаление от текущего бара уровня цен

완전히 최적화되고 적응 가능한 신경망 시스템입니다.
이 전략은 RSI, MACD 및 이동 평균을 기반으로 하며 완전히 재설계되고 정제되며 신경망과 결합됩니다.
모든 신경망 설정은 Expert Advisor에 내장되어 있습니다.
보증금을 보호하기 위해 항상 매우 낮은 드로우다운으로 설정합니다.
추천 쌍: XAUUSD 기간: M15 최소 보증금: $500 테스트된 실제 라이브 신호 https://www.mql5.com/en/signals/1925710 계정 유형: 최소 스프레드가 있는 계정(ECN 권장) 브로커: 모든 브로커 추천 쌍: XAUUSD 기간: M15 최소 보증금: $500 테스트된 실제 라이브 신호 https://www.mql5.com/en/signals/1925710 계정 유형: 최소 스프레드가 있는 계정(ECN 권장) 브로커: 모든 브로커
Trading assistant that offers advanced management of your trades with optimization features. It automatically calculates the risk per trade, makes it easy to set up new orders, and offers advanced management tools such as automatic trade closing in 5 different ways. It also has other useful features that will improve your control and decision making. And best of all, you can use it in the strategy tester to perfect your tactics before trading live!
Our trading assistant is a trading tool that

SuperTrend Alert MT4로 시장 트렌드를 마스터하세요. 이 강력한 인디케이터는 외환, 주식, 암호화폐, 상품 거래를 위한 정확한 트렌드 추종 신호를 제공하도록 설계되었습니다. Forex Factory와 Reddit의 r/Forex와 같은 거래 커뮤니티에서 찬사를 받고 있으며, Investopedia와 TradingView의 논의에서도 견고한 트렌드 탐지 능력으로 호평받고 있어, 신뢰할 수 있는 진입 및 퇴장 지점을 찾는 트레이더에게 필수적인 도구입니다. 사용자들은 SuperTrend 신호를 프라이스 액션과 결합하여 트렌드 방향을 최대 90%의 정확도로 식별하며, 실시간 알림을 활용하여 트렌드 변화를 포착함으로써 거래 타이밍이 25-35% 개선되었다고 보고합니다. 주요 이점에는 고급 트렌드 분석, 맞춤형 설정을 통한 개인화된 전략, 지속적인 차트 모니터링 없이 스캘퍼, 데이 트레이더, 스윙 트레이더의 의사 결정을 향상시키는 경량 디자인이 포함됩니다. SuperTrend A
FREE

이 도구는 지정되거나 자동으로 계산된 시차가 있는 원본 시간 척도를 차트 하단에 추가합니다.
이 편리한 도구를 사용하면 차트의 가독성을 높이고 자신이나 국가에 익숙한 시간 형식으로 차트를 표시하여 정신적 스트레스를 줄일 수 있습니다.
시차를 계산할 필요가 없더라도 기본 시간 척도를 Local_Time으로 바꾸면 차트의 가독성을 높일 수 있습니다.
Local_Time은 "DD.MM hh:mm", "DD MMM hh:mm", "MM-DD hh:mm", "MM/DD hh:mm", "DD hh:mm", " hh:mm"을 사용하며 다른 국가의 사람들이 사용할 수 있도록 설계되었습니다.
유연한 매개변수 설정을 사용하면 기본 시간 척도 삭제, 시차 자동 또는 수동 계산, 일광 절약 시간 조정, 척도 간 간격 조정 등 필요에 맞게 Local_Time을 사용자 정의할 수 있습니다.
Local_Time 아래에 서브 윈도우가 생성되면 빨간색 바가 나타나며, 이를 클릭하면 하단으로 이동할 수 있
FREE

Msg2Slack은 MT4/MT5 텍스트 상자에서 Slack으로 메시지를 보내는 도구입니다. 텍스트 상자 오른쪽에 있는 버튼을 한 번만 클릭하면 슬랙 채널에 텍스트와 차트 이미지를 쉽게 보낼 수 있습니다. 차트에 선, 마크, 댓글 등을 그려도 이미지가 올라갑니다.
자신에게 메시지를 보내든 그룹에 메시지를 보내든 이 간단하면서도 강력한 도구를 사용하면 차트 이미지를 캡처하고 즉시 메시지를 보내는 것이 매우 쉽습니다.
Msg2Slack 도구가 차트 하단에 표시됩니다. 메시지를 입력하고 우측의 버튼을 클릭하기만 하면 메시지 또는 이미지가 포함된 메시지를 게시할 수 있습니다.
유용성의 수준은 사람마다 다르지만 커뮤니케이션에 Slack을 사용하는 사람은 누구나 차트 이미지를 즉시 보낼 수 있는 Msg2Slack의 기능을 활용할 수 있습니다.
Slack API TOKEN을 가져와 이 도구의 매개변수로 설정합니다.
전략 테스터를 사용하여 작동하는지 확인할 수도 있습니다.
FREE
거래 전략을 강화하세요 Nadaraya Watson Envelope Alert MT4 는 비모수 커널 회귀를 활용한 최첨단 지표로, 부드럽고 적응형 트렌드 분석을 제공합니다. Nadaraya-Watson 추정기에서 영감을 받은 이 도구는 가격 데이터에 가우시안 커널 평활화를 적용하여 시장 변동성에 적응하는 동적 엔벨로프를 생성하지만, 전통적인 이동 평균의 과도한 지연은 없습니다. TradingView와 같은 플랫폼에서 널리 인정받고 전 세계 트레이더로부터 반전 발견의 정확성으로 찬사를 받는 Nadaraya Watson Envelope는 2022년 이후 인기가 급증하며 Bollinger Bands의 우수한 대안으로 자리 잡았습니다. 비재도장 모드는 실시간 신뢰할 수 있는 신호를 보장하며, 재도장 옵션은 깊이 있는 분석을 위한 울트라 부드러운 시각을 제공합니다. 트레이더들은 Nadaraya Watson Envelope를 트렌드 강도, 과매수/과매도 조건, 잠재적 반전 포인트를 놀라운

거래 정밀도를 높이세요. Candlestick Pattern Alert MT4 지표는 주요 캔들 패턴을 신속히 감지하고 실시간 알림을 제공하는 강력한 도구로, 높은 확률의 설정에 트레이더가 대응할 수 있도록 합니다. 1990년대 스티브 니슨에 의해 대중화된 일본 캔들 차트 원리에 기반한 이 지표는 해머, 도지, 엔굴핑 같은 패턴을 통해 시장 심리를 해독하는 능력으로 외환, 암호화폐, 주식 트레이더들에게 사랑받습니다. 수동 분석을 간소화하여 시간을 절약하고, 정확성을 높이며, 기회 손실을 줄입니다—EURUSD, BTCUSD, XAUUSD 같은 변동성 시장에서 트렌드 반전이나 지속을 활용하려는 스캘퍼, 데이 트레이더, 스윙 트레이더에게 완벽합니다. Candlestick Pattern Alert MT4는 즉각적인 패턴 인식을 위해 차트에 녹색(매수)과 적색(매도) 화살표를 오버레이하며, 명확성을 위해 사용자 정의 텍스트 레이블(기본 크기 7, 오프셋 20%)을 제공합니다. 14가지 주요

"빅 피규어 인디케이터(BIG FIGURE INDICATOR)"는 자동으로 화폐 거래에서 1.0000이나 1.5000과 같은 정수나 절반 수와 같은 구체적인 수준에서 가격 차트에 수평선을 자동으로 인식하고 그립니다. 이러한 수준은 대규모 거래자와 투자자들이 집중할 수 있는 라운드 넘버(round number)를 대표하여 심리적으로 중요하다고 간주되며, 잠재적인 지지 또는 저항 수준으로 이어질 수 있습니다. 빅 피규어 인디케이터는 거래자가 중요한 가격 수준을 식별하고 이러한 수준을 기반으로 거래 결정을 내리는 데 도움이 될 수 있습니다.
라인은 M1과 H4 TIMEFRAME 차트 사이에서만 볼 수 있습니다.
라인의 색상은 Inputs Parameter 탭에서 변경할 수 있습니다.
모든 통화 쌍과 함께 사용할 수 있습니다.
MT5 버전: https://www.mql5.com/fr/market/product/96750
참고: 본 인디케이터의 최상의 기능을 위해서는 먼저 일일(D
FREE

Introducing the "Extreme Exhaustion Levels": A powerful tool for traders looking to identify market exhaustion and potential trend reversals. The Exhaustion Indicator is an advanced technical analysis tool that helps traders identify when markets are overbought or oversold, potentially indicating an imminent reversal in the trend. With a unique combination of price action, moving averages, and Bollinger Bands, the Exhaustion Indicator provides traders with a comprehensive view of market condit
This EA is fully automated , it is built based on the method of catching the pop-up Alert event and Open Market Orders (BUY/SELL) . Download trial version here: https://www.mql5.com/en/blogs/post/751340
***NOTE: It is recommended to remove the available filter settings, only install the filter for your indicator. Parameters of the EA: -------- <EA Settings> -------- Magic Number: The identifying (magic) number of the currently selected order. Allow Open trade: Enable/ Disable Open Trade
Master Precision Trading with Wamek Trend Consult Stop guessing and start trading with confidence. Wamek Trend Consult is your advanced toolkit for pinpointing high-probability market entries and minimizing false signals —no matter your strategy. Why Traders Choose Wamek Trend Consult Laser-Sharp Trend Detection Our proprietary algorithms identify early reversals and continuation trends with surgical precision, filtering out market noise to deliver actionable signals. Tailored to Your Stra

ItradePeriod is an advanced and highly customizable trading software that allows traders to automate their trading strategies with ease. With ItradePeriod, traders can execute trades using six different strategies that can be customized to fit their specific trading style. The software features a unique scheduling system that allows traders to schedule trades at specific times, ensuring maximum efficiency and profitability. Each strategy can be customized with a range of trades management optio

Here is a powerful trading tool that will allow you to trade manually or automatically in any market, but is especially useful in markets with high volatility and liquidity.
This system has two EAs (Expert Advisors): one for Buy and one for Sell, which work independently. The operation is based on the hedging strategy and the increase in lots based on the Fibonacci sequence, which will allow you to always add the two previous lots: 1, 2, 3, 5, 8, 13...
You decide how you want to trade: you ca

Enhance your trading with ftmo trading ea , the cutting-edge price action expert advisor designed to elevate your trading experience to new heights. Harnessing the power of advanced algorithms and meticulous analysis of price movements, ftmo trading ea empowers traders with unparalleled insights into the market.
Gone are the days of relying solely on indicators or lagging signals. With ftmo trading ea, you gain access to real-time data interpretation, it makes informed decisions swiftly and c
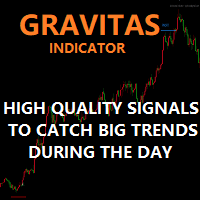
Gravitas indicator – High quality / Non-repainting Signals for day trading
If you are sick and tired of not being profitable each month or you simply want a safe earning while you are studying the markets or while you practice and master your strategy give this indicator a try. I called this indicator “Gravitas” as indication of seriousness and importance that trading is for me and respect for the market and the other traders involved in it. I developed it last

Fibonacci automatically draws Fibonacci retracement, Because Fibonacci automatically draws Fibonacci retracement, you can know at a glance the price to buy at a push or sell back. Therefore, you can trade in favorable conditions in a trending market.
We are live-streaming the actual operation of the system. Please check for yourself if it is usable. Please check it out for yourself. https://www.youtube.com/@ganesha_forex
We do not guarantee your investment results. Investments should be made

The chart pattern is automatically drawn. It also automatically tells you the price at which you are most likely to buy or sell according to the pattern. Therefore, there is no need to memorize patterns or draw lines by yourself.
We are live-streaming the actual operation of the system. Please check for yourself if it is usable. Please check it out for yourself. https://www.youtube.com/@ganesha_forex
We do not guarantee your investment results. Investments should be made at your own risk. We

The Drive Price Action Expert Advisor is developed on its own indicators. The EA works on more than one pair, which makes it possible to avoid losses. The EA also uses intuitive order closing and TrallStop. But TrallStop does not fire like you think every second. It works in certain situations in the market. Intuitive closing of orders can close an order at a loss if the trade has been open for a long time. There is also a built-in dynamic change of the Lot, depending on the deposit and ta

EURUSD H1 Simple Martingale that works on daily swing levels, low DD, TP and SL defined on the basis of certain pre-set calculations in the algorithm, executes one trade at a time, weekly trading no overnight on weekends, possibility to establish customized exit times, possibility of customize money management. average return of 7.92% per year with the factory settings of the V1, it is always constantly updated, it is recommended to use it with a GMT +2 server TESTED SINCE 2003
Happy trading
FREE

SYSTEM DESCRIPTION: Cyber Capital TRADE HUB is support software for traders who wish to improve and speed up the opening, closing, and management of trades, as well as their own risk management. The system is developed for MT4 and allows you to open and close positions with fixed or automated lots based on percentage risk in one click. All the features of the dashboard are listed below. In addition to the normal functions of a trading dahsboard there is the ability to open manual trades with th
FREE

The Volume Str indicator is an indicator based on tick volumes. The very name of the indicator "Volume Street" indicates the use and sorting of volumes. according to a certain algorithm, which leads to a good result at the output. Look at the screenshots and you will see what signals it gives. The indicator does not redraw and you can use its signals after the first bar closes.

Volume mag indicator is another indicator that is used to calculate entry points tick volume. The indicator rarely gives a signal, but this can be said to be its advantage. The indicator's signals are not redrawn and do not lag, but are issued after the close of the current candle. The indicator does not overload the terminal and calculates entry points within the BarsCount value, which is set in the menu, by default 500 bar.
The Volume New indicator is the main indicator for calculating direction of price movement by tick volumes. The indicator generates the maximum number of signals that it is possible to filter according to your strategies. The indicator does not redraw or lag and generates a signal according to the settings SIGNALBAR values, default 1 - after the close of the current candle. The number of history bars for calculation is set in the indicator menu by the value BarsCount, default is 500 bars.

Surf EA is a fully automatic grid based Expert Advisor that looks for reversal areas on the chart MT5 version: https://www.mql5.com/ru/market/product/99693 Nature of work: The EA uses several patterns, indicators and other important conditions to search for signals Buy and sell positions are independent of each other Only one order can be opened on one bar of the current period The indicators used in the EA are included in the standard set of the terminal Recommendations: Trading pair: AUDCAD
FREE

An advisor with atomic potential from the first days! Monitoring
All signals are managed by our advisors, details are disclosed only to existing clients - after purchasing/renting any product.
https://www.mql5.com/en/users/robotstroi/seller The advisor is based on chaos theory - the disorderly movement of the price. In the first strategy, the robot identifies moments when the price becomes most active and opens a grid of pending orders in the direction of the price. In the second strategy, pendi
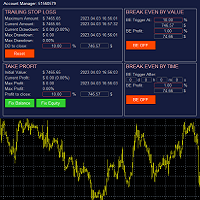
The account manager has a set of functions necessary for trading, which take into account the results of the entire account in total, and not for each individual open position: Trailing stop loss. Take profit. Break-even on the amount of profit. Breakeven by time. Stop Loss Typically, each of these options can be applied to each individual trade. As a result, the total profit on the account may continue to increase, and individual positions will be closed. This does not allow you to get the maxi

Mi favourite robot I used every day in my accounts Designed for forex trading This Forex trading robot has been developed by MRBEAST as a tool to facilitate day trading. Please note that using this robot involves certain risks and does not guarantee consistent profits in the forex market. The trading robot is based on algorithms and strategies that I have designed, which have been created using my knowledge and experience in the field of trading. However, past performance does not guarantee fut

after getting indic ator cont act me for Bonus E a. Non Repaint TMA channel with special conditioned arrows on price cross of channel lines plus market Volatility factor, which makes product much more accurate than any usual tma channel indicators. It is proven to be profitable with Ea built based on it which you will get as a BONUS in case of indicator purchase. Good luck.

You can change the time period of the chart at the touch of a button. You can also change multiple charts at the touch of a button. You can also change multiple charts at the touch of a button, saving you the trouble of changing time periods.
We are live-streaming the actual operation of the system. https://www.youtube.com/@ganesha_forex
We do not guarantee your investment results. Investments should be made at your own risk. We sharll not be liable for any disadvantage or damage caused by th
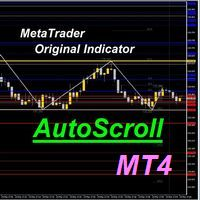
AutoScroll automatically scrolls the chart by the set width (pips). You can see the next milestone without having to operate the chart yourself. You can concentrate on trading.
We are live-streaming the actual operation of the system. Please check for yourself if it is usable. Please check it out for yourself. https://www.youtube.com/@ganesha_forex
We do not guarantee your investment results. Investments should be made at your own risk. We sharll not be liable for any disadvantage or damage c
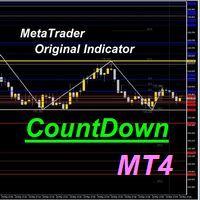
The time until the end of the bar is counted down. Therefore, you can time your order while watching the chart. You can concentrate on your trading.
We are live-streaming the actual operation of the system. Please check for yourself if it is usable. Please check it out for yourself. https://www.youtube.com/@ganesha_forex
We do not guarantee your investment results. Investments should be made at your own risk. We sharll not be liable for any disadvantage or damage caused by the use of the info

The system automatically draws resistance and support lines, The system automatically draws resistance and support lines, so you can see at a glance the price range where you are most likely to encounter resistance. Therefore, you can trade in price zones where you are less likely to encounter resistance.
We are live-streaming the actual operation of the system. Please check for yourself if it is usable. Please check it out for yourself. https://www.youtube.com/@ganesha_forex
We do not guaran

Based on the Dow Theory, the system automatically draws a turning point, which is the starting point for buying or selling. It also automatically tells you whether the market is in a buying or selling condition and recognizes the environment. It is also a good tool to prevent false trades and to make profitable trades.
We are live-streaming the actual operation of the system. Please check for yourself if it is usable. Please check it out for yourself. https://www.youtube.com/@ganesha_forex
We
MetaTrader 마켓은 개발자들이 거래 애플리케이션을 판매할 수 있는 간단하고 편리한 사이트이다.
제품을 게시하고 마켓용 제품 설명을 어떻게 준비하는가를 설명하는 데 도움이 됩니다. 마켓의 모든 애플리케이션은 암호화로 보호되며 구매자의 컴퓨터에서만 실행할 수 있습니다. 불법 복제는 불가능합니다.
트레이딩 기회를 놓치고 있어요:
- 무료 트레이딩 앱
- 복사용 8,000 이상의 시그널
- 금융 시장 개척을 위한 경제 뉴스
등록
로그인
계정이 없으시면, 가입하십시오
MQL5.com 웹사이트에 로그인을 하기 위해 쿠키를 허용하십시오.
브라우저에서 필요한 설정을 활성화하시지 않으면, 로그인할 수 없습니다.