通貨 / HIDE
HIDE: Alpha Architect High Inflation and Deflation ETF
22.96
USD
0.03
(0.13%)
HIDEの今日の為替レートは、0.13%変化しました。日中、通貨は1あたり22.96の安値と22.96の高値で取引されました。
Alpha Architect High Inflation and Deflation ETFダイナミクスに従います。リアルタイムの相場は、市場の変化に迅速に対応するのに役立ちます。 異なる時間枠に切り替えることで、為替レートの傾向とダイナミクスを分、時間、日、週、月単位で監視できます。この情報を使用して、市場の変化を予測し、十分な情報に基づいて取引を決定してください。
- H1
- H4
- D1
- W1
- MN
HIDE on the Community Forum
HIDEの取引アプリ

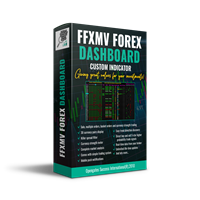
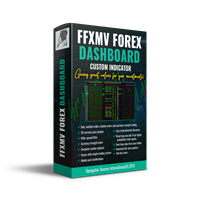
FULL FOREX MARKET VIEW ダッシュボードインジケーター MT5 これは、トレーダーに市場の全体像を提供するためにMT5プラットフォーム用に作成されたカスタムインジケーターです。リアルタイムデータを使用して市場を分析し、成功するために必要なすべての情報を表示します。 インストール方法: このインジケーターをチャートに適用する前に、MT5の「気配値表示」パネルで、不要または取引しない通貨ペアを非表示にし、必要なものだけを残してください。理由は、FFMVダッシュボードはMT5の「気配値表示」にあるすべての通貨ペアを表示するためです。最大で26ペアまで表示可能です。それ以上あると、FFMVダッシュボードのフォントや画像がぼやけ、崩れてしまいます!正しく表示されません。 使用目的: 単独取引用 バスケット取引用(スクリーンショット参照) 複数注文取引にも使用可能 自分の取引システムからのシグナルの確認 構成要素: 時間足: M1からMN1までの現在のローソク足の状態(買い/売り) トレンド: 通貨の全体的な傾向 インパクト: 通貨の動きの強さ/ボラティリティ(以下参照) Bu

The UTS Trading Stat indicator, developed by Ultron Trading Solutions, is a customizable tool designed to track and display trading statistics for the current chart's symbol. It presents a visual dashboard on the chart, offering real-time insights into trading performance with a toggleable panel (STAT SHOW/STAT HIDE) for user convenience. Below is a detailed description of its features and functionality: Trading Statistics Displayed : Current Positions : Number of open profit/loss trades and tot

SAFE, GOOD RISK REWARD EA, EA DOES NOT OVER TRADE AND IS FOR THOSE WHO LOOK AT THE BIGGER PICTURE OF GOOD YEARLY RETURNS Live Signal (3+ Months) >>> Click Here IT'S A PAID VERIFIED SIGNAL WITH LIVE PER SECOND UPDATES, ALSO I DON'T HIDE MY OPEN TRADES. After you bought EA, Please ask me if you need help to balance your lot sizes, so that SL'e on different pairs are not imbalanced. "The Good Buyer" Is a multipair strategy, each trade has a hard SL and TP. NO dangerous strategies like martingal

Based on an analysis of over 20 years of historical data, a simple and formidable strategy. I have earned a total of €9,500 in real profits on my personal trading account over the past year using my bot. Forget about complex and risky approaches. Our strategy is based on robust statistics (the major pair market is a very liquid market that does not perform out of the ordinary and gives us the perfect opportunity to hedge while arbitraging the pairs that go in the opposite direction). A formidab

FFXMV Dashboard + CSM is a custom indicator combined with Currency Strength Meter . It is created to give the Traders a full view of what is going on in the market. It uses a real time data to access the market and display every bit of information needed to make a successful trading. Before attaching this Indicator to your window chart, go to your MT4's Market Watch panel and HIDE all the Currency pairs you don't need or trade and leave the rest there. The reason is that FFMV Dashboard will DISP

FULL FOREX MARKET VIEWダッシュボードインジケーター
これは、トレーダーが市場で何が起こっているかを完全に把握できるようにするために作成されたカスタム指標です。 リアルタイム データを使用して市場にアクセスし、取引を成功させるために必要なあらゆる情報を表示します。
インストール:
このインジケーターをウィンドウ チャートに添付する前に、MT4 のマーケット ウォッチ パネルに移動し、不要な通貨ペアまたは取引しないすべての通貨ペアを非表示にして、残りをそこに残します。 その理由は、FFMV ダッシュボードが MT4 の気配値表示に表示されるすべての通貨ペアを表示するためです。 最大 30 通貨ペア以下を表示できます。 MT4 の気配値表示でそれ以上だと、FFMV ダッシュボードのフォントと画像がぼやけて変形します。 正しく表示されません。
使用法:
個人取引の場合
バスケット取引の場合 (方法についてはスクリーンショットを参照してください)
複数注文取引にも使用可能
独自の取引システムなどから受信したシグナルの有効性を

The HHHC-LLLC indicator uses candle by candle analysis, based on the principle of trend confirmation from Higher High, Higher Close candles (bullish) and Lower Low, Lower Close candles (bearish). There is no lag, no re-painting, and averaging is not used. HHHC-LLLC helps confirm: market structure and levels - look left to see them line up trends, pullbacks & reversals Bull moves (blue), Bear moves (red) Structure Zig Zags (black dotted lines), for summarizing market moves exhaustion and stalling
1日のレンジ
22.96
22.96
1年のレンジ
21.80
23.80
- 以前の終値
- 22.93
- 始値
- 22.96
- 買値
- 22.96
- 買値
- 23.26
- 安値
- 22.96
- 高値
- 22.96
- 出来高
- 1
- 1日の変化
- 0.13%
- 1ヶ月の変化
- 0.61%
- 6ヶ月の変化
- 1.19%
- 1年の変化
- -1.75%
31 8月, 日曜日