Devises / HIDE
HIDE: Alpha Architect High Inflation and Deflation ETF
22.96
USD
0.03
(0.13%)
Le taux de change de HIDE a changé de 0.13% aujourd'hui. Au cours de la journée, l'instrument a été échangé à un minimum de 22.96 et à un maximum de 22.96.
Suivez la dynamique Alpha Architect High Inflation and Deflation ETF. Les cotations en temps réel vous aideront à réagir rapidement aux changements du marché. En basculant entre différentes périodes, vous pouvez surveiller les tendances et la dynamique des taux de change par minutes, heures, jours, semaines et mois. Utilisez ces informations pour prévoir les changements du marché et prendre des décisions de trading éclairées.
- H1
- H4
- D1
- W1
- MN
HIDE on the Community Forum
Applications de Trading pour HIDE

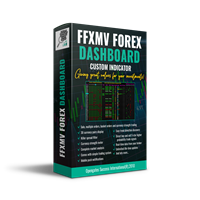
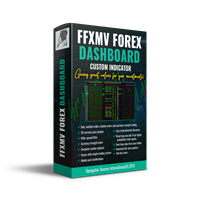
FULL FOREX MARKET VIEW Indicateur Tableau de Bord MT5 Il s'agit d'un indicateur personnalisé créé pour la plateforme MT5 afin de donner aux traders une vue complète de ce qui se passe sur le marché. Il utilise des données en temps réel pour analyser le marché et afficher toutes les informations nécessaires pour réussir vos transactions. INSTALLATION : Avant d’attacher cet indicateur à votre graphique, allez dans le panneau « Observation du marché » de votre MT5 et MASQUEZ toutes les paires de de

The UTS Trading Stat indicator, developed by Ultron Trading Solutions, is a customizable tool designed to track and display trading statistics for the current chart's symbol. It presents a visual dashboard on the chart, offering real-time insights into trading performance with a toggleable panel (STAT SHOW/STAT HIDE) for user convenience. Below is a detailed description of its features and functionality: Trading Statistics Displayed : Current Positions : Number of open profit/loss trades and tot

SAFE, GOOD RISK REWARD EA, EA DOES NOT OVER TRADE AND IS FOR THOSE WHO LOOK AT THE BIGGER PICTURE OF GOOD YEARLY RETURNS Live Signal (3+ Months) >>> Click Here IT'S A PAID VERIFIED SIGNAL WITH LIVE PER SECOND UPDATES, ALSO I DON'T HIDE MY OPEN TRADES. After you bought EA, Please ask me if you need help to balance your lot sizes, so that SL'e on different pairs are not imbalanced. "The Good Buyer" Is a multipair strategy, each trade has a hard SL and TP. NO dangerous strategies like martingal

Based on an analysis of over 20 years of historical data, a simple and formidable strategy. I have earned a total of €9,500 in real profits on my personal trading account over the past year using my bot. Forget about complex and risky approaches. Our strategy is based on robust statistics (the major pair market is a very liquid market that does not perform out of the ordinary and gives us the perfect opportunity to hedge while arbitraging the pairs that go in the opposite direction). A formidab

FFXMV Dashboard + CSM is a custom indicator combined with Currency Strength Meter . It is created to give the Traders a full view of what is going on in the market. It uses a real time data to access the market and display every bit of information needed to make a successful trading. Before attaching this Indicator to your window chart, go to your MT4's Market Watch panel and HIDE all the Currency pairs you don't need or trade and leave the rest there. The reason is that FFMV Dashboard will DISP

Indicateur de tableau de bord FULL FOREX MARKET VIEW
Il s'agit d'un indicateur personnalisé créé pour donner aux commerçants une vue complète de ce qui se passe sur le marché. Il utilise des données en temps réel pour accéder au marché et afficher toutes les informations nécessaires pour effectuer des transactions réussies.
INSTALLATION:
Avant de joindre cet indicateur à votre graphique de fenêtre, accédez au panneau Market Watch de votre MT4 et MASQUEZ toutes les paires de devises dont vous

The HHHC-LLLC indicator uses candle by candle analysis, based on the principle of trend confirmation from Higher High, Higher Close candles (bullish) and Lower Low, Lower Close candles (bearish). There is no lag, no re-painting, and averaging is not used. HHHC-LLLC helps confirm: market structure and levels - look left to see them line up trends, pullbacks & reversals Bull moves (blue), Bear moves (red) Structure Zig Zags (black dotted lines), for summarizing market moves exhaustion and stalling
Range quotidien
22.96
22.96
Range Annuel
21.80
23.80
- Clôture Précédente
- 22.93
- Ouverture
- 22.96
- Bid
- 22.96
- Ask
- 23.26
- Plus Bas
- 22.96
- Plus Haut
- 22.96
- Volume
- 1
- Changement quotidien
- 0.13%
- Changement Mensuel
- 0.61%
- Changement à 6 Mois
- 1.19%
- Changement Annuel
- -1.75%
31 août, dimanche