• 概要
  • レビュー (49)
  • コメント (91)
  • 最新情報

Smart Market Structure Concepts MT5

4.78

ICT, SMC, SMART MONEY CONCEPTS, SMART MONEY, Smart Money Concept, Support and Resistance, Trend Analysis, Price Action, Market Structure, Order Blocks, BOS/CHoCH, Breaker BlocksMomentum Shift, Supply&Demand Zone/Order Blocks, Strong Imbalance, HH/LL/HL/LH,  Fair Value Gap, FVG, Premium & Discount Zones, Fibonacci Retracement, OTE, Buy Side Liquidity, Sell Side Liquidity, BSL/SSL Taken, Equal Highs & Lows, MTF Dashboard, Multiple Time Frame, BigBar, HTF OB, HTF Market Structure,  Liquidity Voids, Long Wicks, Candle Timer, Fractals, ZigZag, Time Zone, Market Sessions, Asian Range, NY Midnight Open, NDOG, NWOG

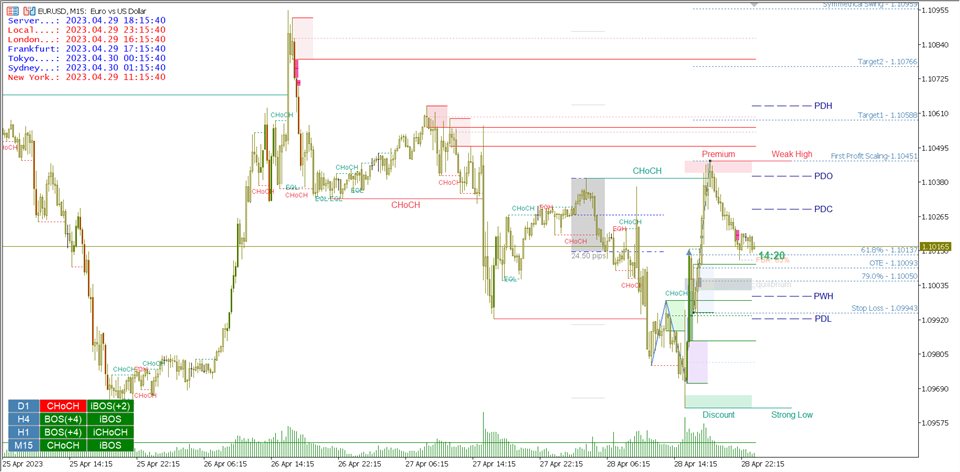
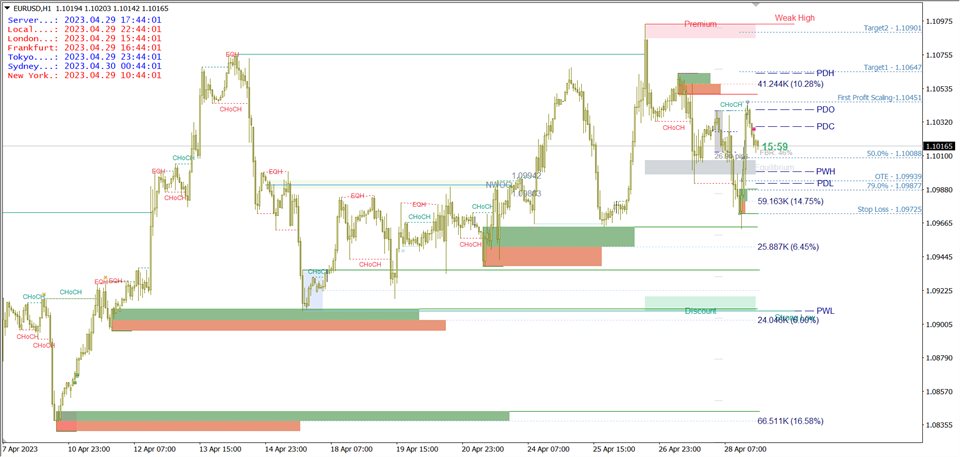
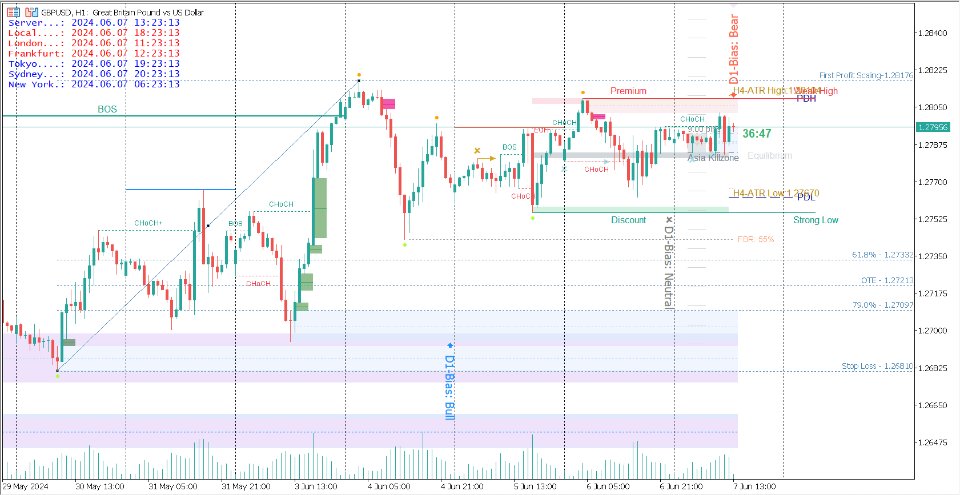
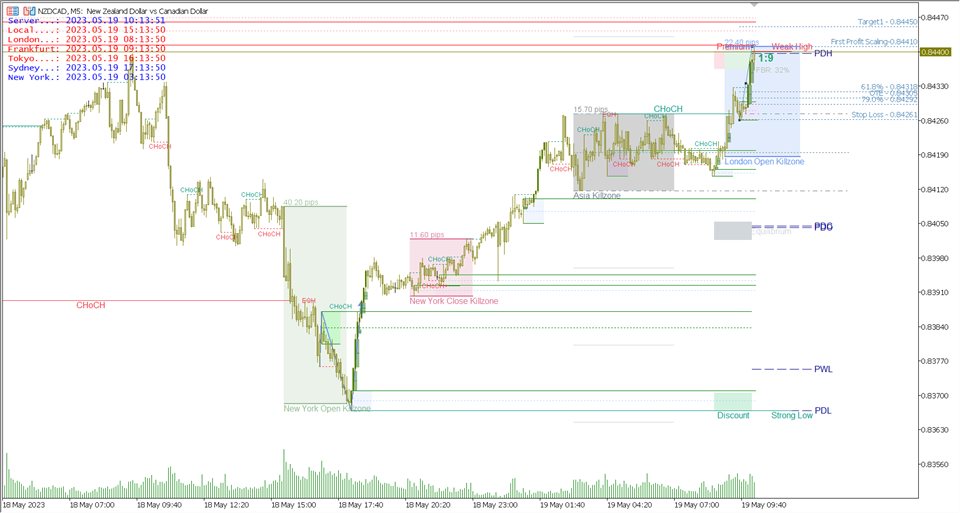
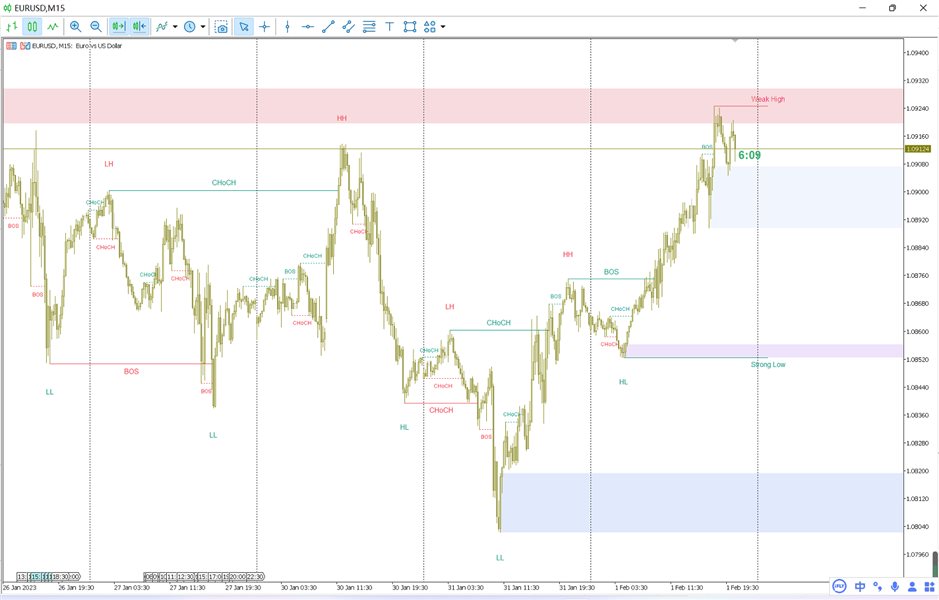
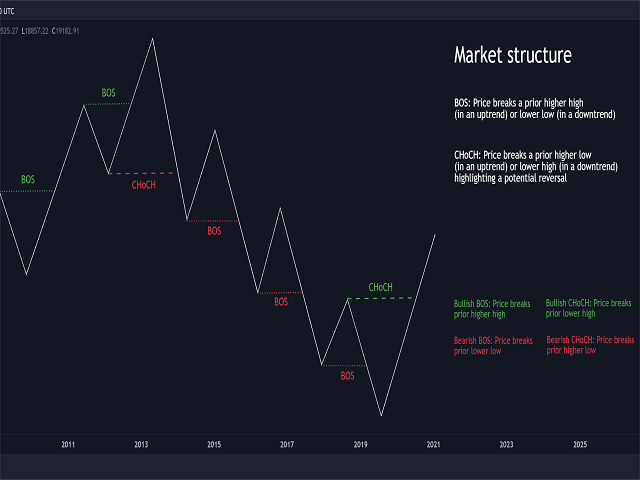
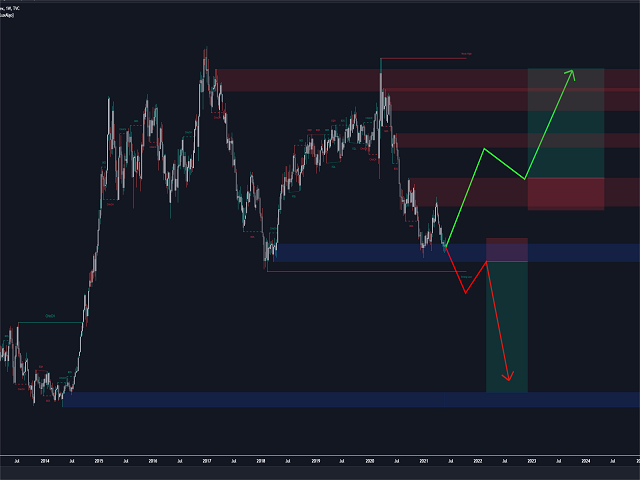
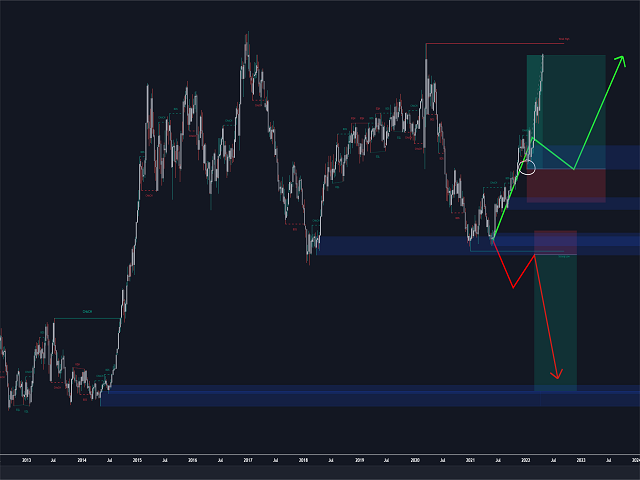
This all-in-one indicator displays real-time market structure (internal & swing BOS / CHoCH), order blocks, premium & discount zones, equal highs & lows, and much more...allowing traders to automatically mark up their charts with widely used price action methodologies. 

"Smart Money Concepts/Smart Market Structure Concepts" ( SMC ) is a fairly new yet widely used term amongst price action traders looking to more accurately navigate liquidity & find more optimal points of interest in the market. Trying to determine where institutional market participants have orders placed (buy or sell side liquidity) can be a very reasonable approach to finding more practical entries & exits based on price action.

This indicator contains alerts for almost all price characteristics, which you can set freely.

 (MT4 version here)

If you are not familiar with SMC trading, I have two materials here for you to study.

SMC Trading Part 1 - Common Abbreviations for SMC Concept & Multi-Time Frame Replay - Trading Systems - 9 April 2023 - Traders' Blogs (mql5.com)

Part 2, Part 3, Part 4, Part 5, Part 6,...

MARKET STRUCTURE AND POWERFUL SETUPS - Forex Market Price Action - Part 1 - Trading Systems - 10 April 2023 - Traders' Blogs (mql5.com)

Part 2, Part 3

This is my chart template for reference: Chart Template


Features

  • Full internal & swing market structure labeling in real-time
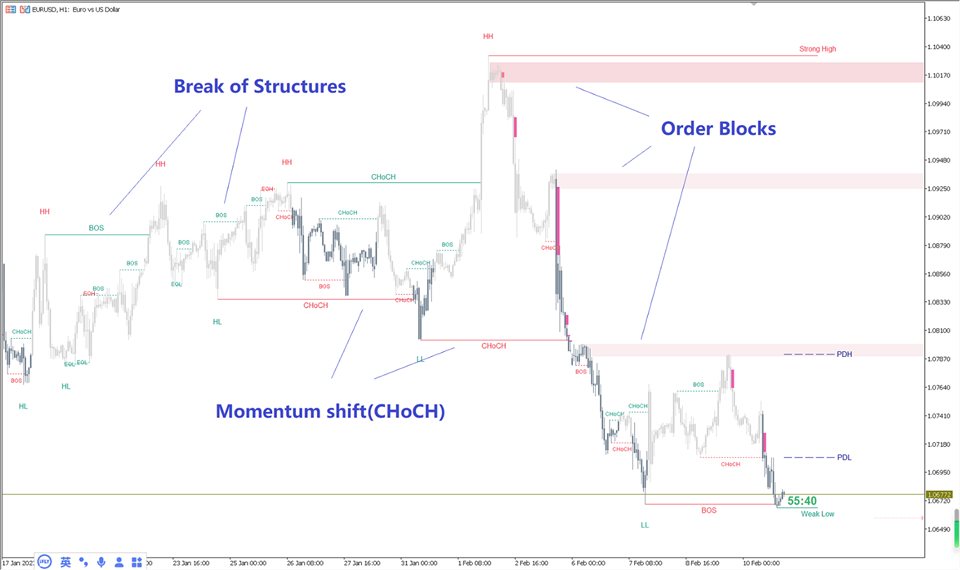
  • Break of Structure (BOS), Change of Character (CHoCH)/ Momentum shift (MS)
  • Support 3 types of breakthrough options
  • Order Blocks ( bullish & bearish ),  Order Blocks with Volume metrics
  • Swing Strong/Weak High/Low
  • Breaker Blocks labeling
  • Supply&Demand Zone/Order Blocks,  Strong Imbalance detection
  • High Timeframe ability. BigBar, HTF-BOS HTF-CHoCH HTF-OB HTF-Swing High/Low.
  • Multi-Timeframe Dashboard (Optional for 4 Period)
  • Fractal Points
  • Fibonacci Retracement/ Fibo OTE&Profit Target
  • BSL/SSL Taken Detect
  • Equal Highs & Lows
  • Fair Value Gap Detection,support high timeframe FVG display
  • Liquidity Voids , Volume Imbalance
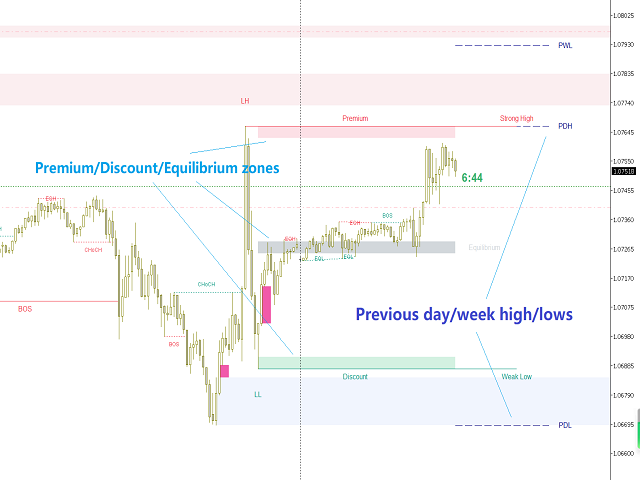
  • Previous Highs & Lows, Previous Open/Close
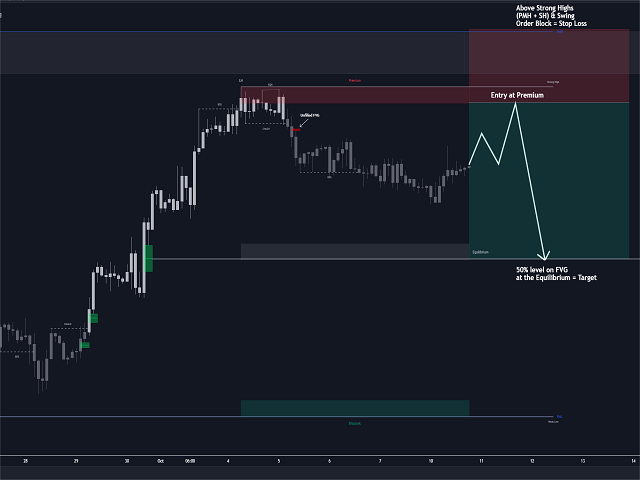
  • Premium & Discount Zones
  • Long Wicks detect
  • London/Frankfurt/Tokyo/Sydney/New York Market Time Zone
  • Asian Range, London Killzone, AM NY Killzone, PM NY Killzone
  • NY Midnight Open
  • NWOG/NDOG
  • Candle Timer
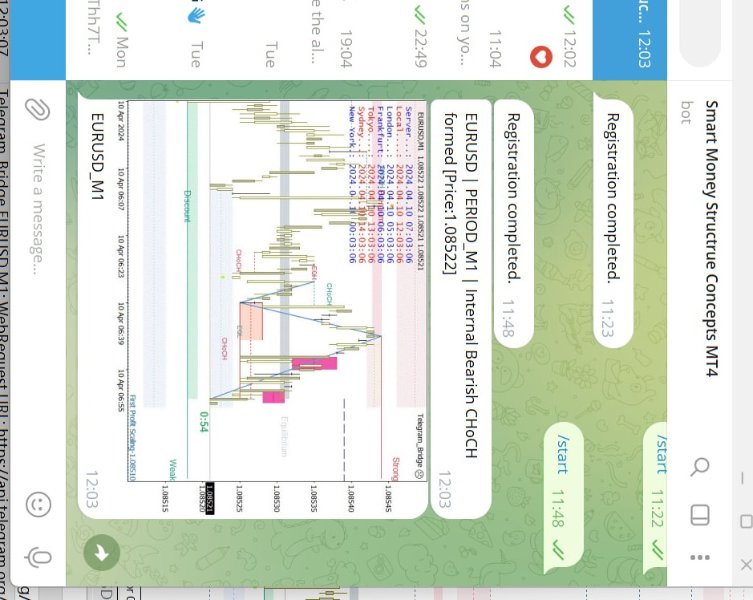
  • Alert for BOS CHoCH OB etc separately. Support setting to send Alert to mobile devices and Email.
  • Draw Candles by trend(MT5 version only)

SMART MARKET STRUCTURE CONCEPTS - SETTING INSTRUCTIONS(ENGLISH)

SMART MARKET STRUCTURE CONCEPTS - SETTING INSTRUCTIONS(中文版)

Free Demo Test:  SMC Indicator MT4/MT5 Free Demo Test - YouTube

Instructions Part1SMC Indicator MT4/MT5 instructions part1 - YouTube

Instructions Part2  SMC Indicator MT4/MT5 instructions part2 - YouTube

Instructions Part3  SMC Indicator MT4/MT5 instructions part3 - YouTube


レビュー 20
KhalidAliBey
234
KhalidAliBey 2023.06.01 19:13 
 

This could have you Bossed UP with the new Silver Bullet vibes!

Dimluck
19
Dimluck 2023.05.31 18:31 
 

I been using this indicator for two months and i can say that: 1.One of the best indicator 2.Fast analysis of Market structure 3.Seller super responsive 4.Continuous upgrading keep it up Jing Bo Wu!!! your are creating a masterpiece.

DGSIXX
284
DGSIXX 2023.05.22 23:20 
 

Great indicator best on the market

おすすめのプロダクト
Trend Fibonacci is a unique indicator that combines a power of Fibonacci sequences and ranges. How to read: - There are three zones --> red, gold and green - Red candlestick = downtrend - Green candlestick = uptrend   - Gold candlestick = no established trend Inputs: Per = number of bars used for calculations FirstRatio = first Fibonacci ratio (Or use any ratio you want) SecondRatio = second Fibonacci ratio (Or use any ratio you want) !! IF YOU PURCHASE THE INDICATOR, CONTACT ME FOR
47 USD
The trend is your friend! Look at the color of the indicator and trade on that direction. It does not  repaint. After each candle is closed, that's the color of the trend. You can focus on shorter faster trends or major trends, just test what's most suitable for the symbol and timeframe you trade. Simply change the "Length" parameter and the indicator will automatically adapt. You can also change the color, thickness and style of the lines. Download and give it a try! There are big movements
99 USD
プレミアムレベルは、正しい予測の精度が80%を超える独自の指標です。 この指標は、最高のトレーディングスペシャリストによって2か月以上テストされています。 あなたが他のどこにも見つけられない作者の指標! スクリーンショットから、このツールの正確さを自分で確認できます。 1は、1キャンドルの有効期限を持つバイナリーオプションの取引に最適です。 2はすべての通貨ペア、株式、商品、暗号通貨で機能します 手順: 赤い矢印が表示されたらすぐにダウントレードを開き、青い矢印が表示されたら閉じます。青い矢印の後に開くこともできます。 試してテストしてください!推奨設定はデフォルトです! 日足チャートで最高の精度を示します! インディケータは、2600 Pipsの収益性に対して、約10Pipsという非常に小さなマージンを使用します。
1 100 USD
Improved version of the free HMA Trend indicator (for MetaTrader 4) with statistical analysis. HMA Trend is a trend indicator based on the Hull Moving Average (HMA) with two periods. HMA with a slow period identifies the trend, while HMA with a fast period determines the short-term movements and signals in the trend direction. The main differences from the free version: Ability to predict the probability of a trend reversal using analysis of history data. Plotting statistical charts for analyz
30 USD
Scalper Pivot detects respectable small reversal areas that can be used to mark repeatable opportunity windows. Originally made for M1 timeframe. Setup/inputs: First, set one pip on price, e.g. EURUSD to 0.0001, or XAUUSD to 0.1. Set minimum and maximum range on pips, if you want scalp between 10 to 20 pips then set it to 10 and 20 respectively. Set detection window to any candle count you want. Set it too low or too high would be less accurate.
799 USD
Volality Index scalper indicator  Meant for Volality pairs such as Volality 10, 25, 50, 75 and 100 The indicator works on all timeframes from the 1 minute to the monthly timeframe the indicator is non repaint the indicator has 3 entry settings 1 color change on zero cross 2 color change on slope change 3 color change on signal line cross Orange line is your sell signal Blue line is your buy signal.
35 USD
回帰取引を意味する専門的かつ定量的なアプローチを実装する独自の指標。これは、価格が予測可能かつ測定可能な方法で迂回して平均に戻るという事実を利用しており、非定量的な取引戦略を大幅に上回る明確な出入りルールを可能にします。 [ Installation Guide | Update Guide | Troubleshooting | FAQ | All Products ] 明確な取引シグナル 驚くほど簡単に取引できます カスタマイズ可能な色とサイズ パフォーマンス統計を実装します ほとんどの取引戦略を上回ります 適切なSLおよびTPレベルを表示します 電子メール/音声/視覚アラートを実装します 使い方 インディケータは、より高い時間枠からの完全にカスタマイズ可能な移動平均の周りの標準偏差を測定し、トレンドフォローアプローチを使用して正確に取引を見つけます。取引は、現在のチャートの価格アクションに飛び込むことによって見つけられ、価格が選択したより高い時間枠から計算された平均価格帯に戻ったときに閉じられます。それがコード化される方法のために、指標は高ボラティリティと強いトレンドの
175 USD
This tool monitors MACD indicators on all time frames in the selected markets. Displays a table with signals to open a BUY trade (green) or SELL trade (red). You can set the conditions for the signal. You can easily add or delete market names / symbols. If the conditions for opening a trade on multiple time frames are met, you can be notified by e-mail or phone message (according to the settings in MT5 menu Tools - Options…) You can also set the conditions for sending notifications. The list of
49 USD
US30NinjaMT5
Satyaseelan Shankarananda Moodley
US30 Ninja is a 5 minute scalping indicator that will let know you when there is a trade set up (buy or sell). Once the indicator gives the trade direction, you can open a trade and use a 30 pip stop loss and a 30 pip to 50 pip take profit. Please trade at own own risk. This indicator has been created solely for the US30 market and may not yield positive results on any other pair. 
30 USD
Noize Absorption Index - is the manual trading system that measures the difference of pressure between bears forces and bulls forces. Green line - is a noize free index that showing curent situation. Zero value of index shows totally choppy/flat market.Values above zero level shows how powerfull bullish wave is and values below zero measures bearish forces.Up arrow appears on bearish market when it's ready to reverse, dn arrow appears on weak bullish market, as a result of reverse expectation.
199 USD
Modified Rainbow
Rafael Alejandro Rey Alves
Modified Rainbow   The Modified Rainbow indicator is intended to work in different scenarios. The indicator uses a combination of technical indicators to detect buy or sell opportunities (different Moving Averages and other technical indicators). The indicator works with any currency pair, stocks, cryptocurrencies and synthetic indices. The indicator can be used for both traditional trading and binary options. The indicator works with any time frame, from M1 to MN. When the blue arrow
30 USD
Perfect Sniper
Ignacio Agustin Mene Franco
Perfect Sniper! is a triple indicator with support resistance detection, downtrend channel, uptrend channel Bands included! where he hunts the rebounds in the red lines for sale, in the green lines mark purchase, in the lower bands that are the breaks gives another second entry either buy or sell, perfect to take advantage of the double entrance, It is used in any temporality, It is used to scalp and long on h1 or h4 to D1. It works for Forex markets, All pairs. It is used for the synthetic inde
100 USD
Be notified of every color change of Heiken Ashi (HA) candles. The indicator will trigger past and new signals every time that HA candles change their colors. ( Note : this tool is based on the code of Heiken Ashi indicator developed by MetaQuotes Software Corp.) Features The signals are triggered at closing of last bar/opening of a new bar; Any kind of alerts can be enabled: Dialog Box, Email message, SMS notifications for smartphones and tablets, and Sound alerts; By default, up arrows are p
35 USD
Supply Demand Ranger
Krzysztof Janusz Stankiewic
The indicator draws supply and demand zones. The zone timeframe is set independently of the chart timeframe. It is possible for instance to set the M5 zones on the H4 chart. The importance of zones can be adjusted with the zone strength parameter. Demand zones are displayed if at least one candle in the range of the zone will be entirely above the zone. Respectively, supply zones are displayed if at least one candle within the zone will be entirely below the zone.
30 USD
The Relative Cyclicality indicator defines the cycles of any price evolution. This indicator is computed by applying the "Cyclicality" mathematical transformation to the classic Relative Strength Index indicator made by J. Welles Wilder. The Relative Cyclicality defines very good entry and exit trading signals near the minimal and maximal points. It is better than RSI itself due to the unicity of the minimal and maximal points on a specific time interval. The Relative Cyclicality indicator can b
600 USD
This MT5 indicator has been designed to be used on any currency pair and any time frame . It has the scalper and swing trader in mind.  The indicator looks for short-term high-probability reversals in price and will indicate to you to go long (buy) or short (sell) if you see a green or red arrow next to the current candlestick respectively. The indicator provides the best trading opportunities to you during the active trading hours of London and New York, but it will continue to give signals al
199 USD
PipFinite Trend PRO MT5
Karlo Wilson Vendiola
4.86 (657)
Breakthrough Solution For Trend Trading And Filtering With All Important Features Built Inside One Tool! Trend PRO's smart algorithm detects the trend, filters out market noise and gives entry signals with exit levels. The new features with enhanced rules for statistical calculation improved the overall performance of this indicator. Important Information Revealed Maximize the potential of Trend Pro, please visit www.mql5.com/en/blogs/post/713938 The Powerful Expert Advisor Version Automa
98 USD
このインジケーターを購入して、$449 相当の Beast Super Signal EA MT4 バージョンを無料で手に入れましょう!       (完全な製品購入のみ)。 収益性の高い取引機会を簡単に特定するのに役立つ強力な外国為替取引インジケーターをお探しですか?ビースト スーパー シグナル以外に探す必要はありません。 この使いやすいトレンドベースのインジケーターは、市場の状況を継続的に監視し、新しいトレンドを検索したり、既存のトレンドに飛びついたりします。ビースト スーパー シグナルは、すべての内部戦略が一致し、互いに 100% 合流したときに売買シグナルを発するため、追加の確認は不要です。シグナル矢印アラートを受け取ったら、単に売買します。 購入後、プライベート VIP グループに追加されるようにメッセージを送ってください! (完全な製品購入のみ)。 購入後、最新の最適化されたセット ファイルについてメッセージを送ってください。 MT4版は こちらから。 Beast Super Signal EA は こちらから 入手できます。 コメント セ
199 USD
Magic Finger can help you identify trends and trading opportunities clearly. The finger points to the open position signal, and the discoloration line is confirmed by the trend. If you are a day trader, you can choose to trade during a period of active trading, referring to the discoloration line as the basis for the next order, finger signal as a filter. If you are a trend trader, you can choose a period above H1, wait for the appearance of the finger signal in the key price area, and enter
188 USD
A scalping indicator based on mathematical patterns, which on average gives signals with relatively small SL, and also occasionally helps to catch big moves in the markets (more information in the video) This indicator has three main types of notifications: The first type warns of a possible/upcoming signal on the next bar The second type indicates the presence of a ready signal to enter the market/open a position The third type is for SL and TP levels - you will be notified every time price r
1 350 USD
トレンドトレーディング は、タイミングのプルバックとブレイクアウトにより、市場で起こっているトレンドから可能な限り利益を得るように設計された指標です。確立されたトレンドの中で価格が何をしているかを分析することにより、取引の機会を見つけます。 [ インストールガイド | 更新ガイド | トラブルシューティング | よくある質問 | すべての製品 ] 自信を持って効率的に金融市場を取引する むち打ちにならずに確立されたトレンドから利益を得る 収益性の高いプルバック、ブレイクアウト、早期の逆転を認識する この指標は、独自の品質とパフォーマンスを分析します 複数時間枠のダッシュボードを実装します インジケーターは再描画されていません 電子メール/音声/視覚アラートを実装します 確立されたトレンドは多くの取引機会を提供しますが、ほとんどのトレンド指標はそれらを完全に無視しています。インジケーターの解釈はかなり簡単です: (1) トレンドの変化 (2) トレンドの方向への後退 (3) トレンドの方向へのブレイクアウト 赤いダッシュ は下降トレンド中の修正です 青いダッシュ は上昇ト
175 USD
Oscillator trading signals - это динамический индикатор, определяющий состояние к продолжению тенденции роста или падению цены торгового инструмента и отсечению зон с нежелательной торговлей. Индикатор состоит из 2 линий осцилляторов. Медленная и быстрая сигнальная линия.  Шкала отображения перевернутая. Зоны вблизи 0 свидетельствуют о тенденции роста цены валютной пары. Зоны -100 свидетельствуют о падении цены валютной пары. На основном графике в виде стрелок отображается потенциально выгодные
50 USD
MT5インジケーター。 3つのレベルのフィボナッチサポートとレジスタンスレベルが自動的に描画されます。 彼らです: 月レベル:ミディアムオーキッド ウィークリーレベル:オレンジレッド デイラインレベル:ターコイズ 色はパラメータで調整できます。 この指標は主に、より良いトレード分析のために将来のサポートとレジスタンスレベルを分析するために使用されます。 サポートレベルが何度も効果的にサポートされている場合、市場は以前の最高点を突破し、効果的なトレンドブレイクアウトは長くなります。 下降後、市場は何度も圧力レベルを超えることはできず、その後下降して以前の低価格を再び突破し、効果的なトレンドはショートポジションを突破します。 市場が過去の高値または安値の領域に達すると、チャートには2レベルのFibonacii線のみが描画され、インジケーターは市場の特定のスペースを待つ必要があるため、通常のレベルのプロンプトは表示されません。描画する前に引き戻すには、インジケーターが自動的に描画します。高価格帯でのフィルター処理された小さな変動は、短期間の有効なサポ
40 USD
Provided Trend is a complex signal formation indicator. As a result of the work of internal algorithms, you can see only three types of signals on your chart. The first is a buy signal, the second is a sell signal, and the third is a market exit signal. Options: CalcFlatSlow - The first parameter that controls the main function of splitting the price chart into waves. CalcFlatFast - The second parameter that controls the main function of splitting the price chart into waves. CalcFlatAvg - Par
100 USD
稼ぎと研究のためのツール。 トレーディングシグナルと戦略の中核は、価格予測パターンを形成するための著者のアルゴリズムに基づいています。どんな楽器にも使えます! MA「九尾の狐」に基づく制御システムが追加され、市場、機器、および作業期間に合わせて信号を可能な限り正確に更新および調整します。 対象:すべての市場のすべての商品(例外があります)。 対象者:ヘッジファンド、ファンドおよび資産運用会社、投資運用会社、投機家、投資家および利害関係者。 .................................................................................................................................................................................
25 920 USD
このインジケーターは、チャート上のすべての注文 (トランザクション/注文ラインにクローズ) に対して既に設定した TP および SL 値 (その通貨で) を表示し、すべての注文の利益と損失を見積もるのに大いに役立ちます。また、PIP 値も表示されます。表示されている形式は、「利益または損失の通貨値 / PIP 値」です。 TP 値は緑色で表示され、SL 値は赤色で表示されます。 ご質問や詳細については、fxlife.asia@hotmail.com で販売者にお気軽にお問い合わせください。 (そして、近日中にインジケータに追加される次の機能は、「自動または半自動の TP および SL 設定」であり、お客様は無料で更新バージョンを入手できます。よろしくお願いします。) (または、表示に何か機能を追加すべきだと思われる場合は、お気軽にお申し付けください)
99 USD
Price reach indicator. It also serves as the perfect term for supports and resistance. I use it in two experts. The basic tool for professional trading. The indicator analyzes the last 500 bar and uses this to determine the levels ( but it doesn't predict the future ) . Personally, I use it on TF H1.  It is very simple. Four lines on chart and that's all. Only two input parameters.  Thousands of indicators. Why this? Is good ? No! Is very good. Please test the indicator prior to purchasing. You
49 USD
A machine translation from English product description was used. We apologies for possible imprecisions. 英語の製品説明からの機械翻訳が使用されました。   不正確な可能性があることをお詫び申し上げます。 お気に入りのろうそく足の価格アクションパターンの視覚化システム。 アタッチされると、インジケーターはチャート上の次のパターンを自動的にマークします。 ピノキオバー - 長い「鼻」を持つ小さなボディのバー、非常によく知られている逆のパターン。 内側のバー - 範囲が前のバーの範囲内にあるバー。   それは市場の不確実性を表しています。 外側のバー - 範囲が前のバーの範囲を超えるバー。   それは市場の不確実性を表しています。 レールパターン - ほぼ等しく、より大きなボディを持つ 2 つの結果として生じる反対側のバー。   逆のパターン。これは、より高い時間枠のピノキオバーパターンと実際に一致します。 マスターキャンドル パターン - キャンドルの 5 つ、後続の 4 つのキャンド
30 USD
Blahtech VWAP - Volume Weighted Average Price (VWAP) is the ratio of price to total volume. It provides an average price over a specified time interval.  Links [  Install  |  Update  |  Documentation   ] Feature Highlights Configurable VWAP Line Sessions, intervals, anchored or continuous Previous day settlement line Standard Deviation bands Alerts at bar close or real time Automatic Broker or Tick volumes Significantly reduced CPU usage Input Parameters Expert Advisor Mode  - Reserved for
49 USD
このプロダクトを購入した人は以下も購入しています
これはMT5のインジケーターで、再描画なしで取引に参入するための正確なシグナルを提供します。 外国為替、暗号通貨、金属、株式、インデックスなど、あらゆる金融資産に適用できます。かなり正確な見積もりを提供し、取引を開始して終了するのに最適な時期を教えてくれます。1つのシグナルを処理しただけでインジケーターの元が取れた例の 動画 (6:22)をご覧ください。Entry PointsPro インジケーターの助けを借りたほとんどのトレーダーの最初の1週間の結果が改善しています。 Telegramグループ に登録してください。Entry Points Proインジケーターのメリットは次の通りです。 再描画のないエントリーシグナル 再描画されるインジケーターでは一度表示されたシグナルが削除されて大きな金銭的損失につながることがありますが、これと異なり、表示されて確認されたシグナルは消えることがありません。 エラーなしの取引開始 インジケーターアルゴリズムによって取引を開始する(資産を売買する)理想的な瞬間を見つけることができます。それを使用するすべてのトレーダーの成功率が向上します。
125 USD
Matrix Arrow Indicator MT5
Juvenille Emperor Limited
5 (11)
マトリックスアローインジケーターMT5は、すべてのシンボル/商品(外国為替、商品、暗号通貨、インデックス、株式)で使用できる100%再描画されていないマルチタイムフレームインジケーターに続くユニークな10in1トレンドです。マトリックスアローインジケーターMT5は、初期段階で現在のトレンドを判断し、最大10の標準インジケーターから情報とデータを収集します。 平均方向移動指数(ADX) 商品チャネルインデックス(CCI) クラシック平研アシキャンドル 移動平均 移動平均収束発散(MACD) 相対活力指数(RVI) 相対力指数(RSI) 放物線SAR ストキャスティクス ウィリアムズのパーセント範囲 すべてのインジケーターが有効な買いまたは売りシグナルを与えると、対応する矢印がチャートに印刷され、次のろうそく/バーの開始時に強い上昇トレンド/下降トレンドを示します。ユーザーは、使用するインジケーターを選択し、各インジケーターのパラメーターを個別に調整できます。マトリックスアローインジケーターMT5は選択されたインディケーターからのみ情報を収集し、それらのデータのみに基づいてアローを印
75 USD
Supply Demand uses previous price action to identify potential imbalances between buyers and sellers. The key is to identify the better odds zones, not just the untouched ones. Blahtech Supply Demand indicator delivers functionality previously unavailable on any trading platform. This 4-in-1 indicator not only highlights the higher probability zones using a multi-criteria strength engine, but also combines it with multi-timeframe trend analysis, previously confirmed swings and engulfing detecto
99 USD
これはほぼ間違いなく、MetaTraderプラットフォームで見つけることができる最も完全な調和価格形成自動認識インジケーターです。 19種類のパターンを検出し、フィボナッチプロジェクションをあなたと同じように真剣に受け止め、潜在的逆転ゾーン(PRZ)を表示し、適切なストップロスとテイクプロフィットレベルを見つけます。 [ インストールガイド | 更新ガイド | トラブルシューティング | よくある質問 | すべての製品 ] 19の異なる調和価格形成を検出します プライマリ、派生および補完フィボナッチ投影(PRZ)をプロットします 過去の価格行動を評価し、過去のすべてのパターンを表示します この指標は、独自の品質とパフォーマンスを分析します 適切なストップロスとテイクプロフィットのレベルを表示します ブレイクアウトを使用して適切な取引を通知します すべてのパターン比をグラフにプロットします 電子メール/音声/視覚アラートを実装します スコット・M・カーニーの本に着想を得て、この指標は最も純粋で急を要するトレーダーのニーズを満たすように設計されています。ただし、トレードを
249 USD
インジケーターガイド  |  Owl Smart Levels戦略   |   MT4版  |  インストールする方法?   |   FAQ Owl Smart Levels Indicator は、 Bill Williams の高度なフラクタル、市場の正しい波構造を構築する Valable ZigZag、エントリの正確なレベルをマークする Fibonacci レベルなどの一般的な市場分析ツールを含む 1 つのインジケーター内の完全な取引システムです。 利益を得るために市場と場所に。 取引システムの詳細な説明については、 Owl Trend Strategy - Smart Levels の記事を参照してください  力はシンプルさにあります! Owl Smart Levels 取引システムは非常に使いやすいので、専門家にも、市場を勉強し始めて自分で取引戦略を選択し始めたばかりの人にも適しています。 戦略と指標に秘密の数式や計算方法が隠されているわけではなく、すべての戦略指標は公開されています。 Owl Smart Levels を使用すると、取引を開始するためのシグナルをすばやく
97 USD
現在33%オフ 初心者にもエキスパートトレーダーにも最適なソリューション このインジケーターは独自の機能と新しい公式を多数内蔵しており、ユニークで高品質かつ手頃な取引ツールです。このアップデートでは、2つの時間枠ゾーンを表示できるようになります。より長いTFだけでなく、チャートTFとより長いTF(ネストゾーンを表示)の両方を表示できます。すべてのSupply Demandトレーダーの皆さんのお気に召すはずです。:) 重要情報の公開 Advanced Supply Demandの可能性を最大化するには、 https://www.mql5.com/ja/blogs/post/720245 にアクセスしてください。   エントリーまたはターゲットの正確なトリガーポイントを正確に特定できれば取引がどのように改善されるか想像してみてください。新しい基盤となるアルゴリズムに基づいて構築されているため、買い手と売り手の間の潜在的な不均衡をさらに簡単に特定できます。これは、最も強い需要と供給のゾーンと、過去のパフォーマンス(古いゾーンを表示)がグラフィカルに表現されるためです。これらの機能は、最適
199 USD
The Volume by Price Indicator for MetaTrader 5 features Volume Profile and Market Profile TPO (Time Price Opportunity). Get valuable insights out of currencies, equities and commodities data. Gain an edge trading financial markets. Volume and TPO histogram bar, line and metric charts. TPO letter and block marker charts including split structures. Positioning and styling options to suit the user's needs and context. Volume Profile and Market Profile TPO Point of Control (VPOC and TPOC), Imbalanc
179.95 USD
スイングトレーディング は、トレンドの方向のスイングと可能な反転スイングを検出するように設計された最初のインジケーターです。トレーディングの文献で広く説明されているベースラインスイングトレーディングアプローチを使用します。インディケータは、いくつかの価格と時間のベクトルを調査して、全体的なトレンドの方向を追跡し、市場が売られ過ぎまたは買われ過ぎて修正の準備ができている状況を検出します。 [ インストールガイド | 更新ガイド | トラブルシューティング | よくある質問 | すべての製品 ] むち打ちを起こさずに市場スイングの利益 インジケーターは常にトレンドの方向を表示します 色付きの価格帯は機会のベースラインを表します 色付きのダッシュは、可能な反転スイングを表します この指標は、独自の品質とパフォーマンスを分析します 複数時間枠のダッシュボードを実装します カスタマイズ可能なトレンドおよびスイング期間 電子メール/サウンド/プッシュアラートを実装します インジケータは再描画またはバックペインティングではありません Swing Tradingとは Swing Tradi
175 USD
MetaBands M5
Vahidreza Heidar Gholami
5 (2)
MetaBandsは、強力でユニークなアルゴリズムを使用してチャンネルを描画し、トレンドを検出して、トレーダーに取引の入出ポイントを提供することができます。チャンネル指標に加えて、強力なトレンド指標でもあります。入力パラメータを使用して新しいチャンネルを作成するために、異なるタイプのチャンネルを統合することができます。MetaBandsは、市場のイベントについてユーザーに通知するために、すべてのタイプのアラートを使用します。 特徴 ほとんどのチャンネルアルゴリズムをサポート 強力なトレンド検出アルゴリズム 異なるタイプのチャンネルを統合する能力 マルチタイムフレームおよびマルチカレンシー(シグナルマトリックス) すべてのタイプのアラート機能(サウンド、画面フラッシャー、プッシュ通知、メール、ポップアップ、矢印) 再描画しない トレンド検出 MetaBandsは、チャネル内を振動する青いラインを使用してトレンドを検出します。ラインがチャネルの上部バンドに達すると、下降トレンドの開始を示し、下部バンドに達すると上昇トレンドの開始を示します。青いラインが中心ラインに近づくと、市場はコンソ
129 USD
Stargogs Spike Catcher V3.11 This Indicator is Developed To milk the BOOM and CRASH indices . Send me Message if you need any help with the indicator.  CHECK OUT THE STARGOGS SPIKE CATCHER EA/ROBOT V3: CLICK HERE ALSO CHECK OUT SECOND TO NONEFX SPIKE CATCHER:   CLICK HERE STARGOGS SPIKE CATCHER V3.11 WHATS NEW! Brand New Strategy. This is the Indicator you need for 2023. The Indicator Gives you an Entry at a time when conditions are met and you should use TP & SL. New Trendline that changes col
100 USD
TPA True Price Action indicator reveals the true price action of the market makers through 100% non-repainting signals strictly at the close of a candle! TPA shows entries and re-entries, every time the bulls are definitely stronger than the bears and vice versa. Not to confuse with red/green candles. The shift of power gets confirmed at the earliest stage and is ONE exit strategy of several. There are available now two free parts of the TPA User Guide for our customers. The first "The Basics"
168 USD
Market Profile defines a number of day types that can help the trader to determine market behaviour. A key feature is the Value Area, representing the range of price action where 70% of trading took place. Understanding the Value Area can give traders valuable insight into market direction and establish the higher odds trade. It is an excellent addition to any system you may be using. Blahtech Limited presents their Market Profile indicator for the MetaTrader community. Inspired by Jim Dalton’s
99 USD
Royal Wave Pro M5
Vahidreza Heidar Gholami
3.67 (3)
Royal Wave is a Trend-Power oscillator which has been programmed to locate and signal low-risk entry and exit zones. Its core algorithm statistically analyzes the market and generates trading signals for overbought, oversold and low volatile areas. By using a well-designed alerting system, this indicator makes it easier to make proper decisions regarding where to enter and where to exit trades. Features Trend-Power Algorithm Low risk Entry Zones and Exit Zones Predictions for Overbought and Over
129 USD
Traders know that paying attention to volume can make the crucial difference in understanding how the market will move. Information such as the traded volume, frequency of executed trades and the correlation of buyers and sellers at a certain time period expand our understanding of volume and can significantly improve the accuracy of our trading forecast. The Volume at Price (or VAP) indicator displays the cumulative traded volume for each price level during a time period, as well as the corr
180 USD
ACB Breakout Arrows MT5
KEENBASE SOFTWARE SOLUTIONS
5 (1)
The ACB Breakout Arrows indicator provides a crucial entry signal in the market by detecting a special breakout pattern. The indicator constantly scans the chart for a settling momentum in one direction and provide the accurate entry signal right before the major move. Get multi-symbol and multi-timeframe scanner from here - Scanner for ACB Breakout Arrows MT 5 Key features Stoploss   and Take Profit levels are provided by the indicator. Comes with a MTF Scanner dashboard which tracks the br
145 USD
After working during many months, with the help of Neural Networks, we have perfected the ultimate tool you are going to need for identifying key price levels (Supports and Resistances) and Supply and Demand zones. Perfectly suitable to trigger your trades, set up your future actions, decide your Take Profit and Stop Loss levels, and confirm the market direction. Price will always move between those levels, bouncing or breaking; from one zone to another, all the remaining movements are just mark
79 USD
XQ Indicator MT5
Marzena Maria Szmit
5 (1)
The signal conditions are a combination of three indicators, and XQ Forex Indicators only display  medium and long-term trends . The indicator's efficacy has been improved with the addition of a filter that blocks out false signals. The XQ Forex Indicator can be used on  FX pairs, CFDs, and Cryptocurrencies . There are two type of signals:  Buy or Sell and Big Long or Big Short It is possible to enable sending emails when a major trend-change signal is detected, as well as to display the alerts
179 USD
The Traders Dynamic Index is a combination of multiple indicators into a complex array of signals that can be interpreted for market behavior.  It combines the RSI, Bollinger Bands and a Moving Average , first developed by Dean Malone it has seen prominent use as it combines an often used strategy into a single indicator.  The RSI will determine an overbought or oversold phase for the instrument that will be smoothed and filtered by the MA the Bollinger Bands will then assess the amplitude a
150 USD
初心者やエキスパートトレーダーに最適なソリューション! このインジケータは、独自の機能と秘密の数式を組み込んだ、ユニークで高品質かつ手頃な価格のトレーディングツールです。たった1枚のチャートで28の通貨ペアのアラートを表示します。新しいトレンドやスキャルピングチャンスの引き金となるポイントを正確に把握することができるので、あなたのトレードがどのように改善されるか想像してみてください! 新しい基本的なアルゴリズムに基づいて構築されているため、潜在的な取引の特定と確認がより簡単になります。これは、通貨の強さや弱さが加速しているかどうかをグラフィカルに表示し、その加速のスピードを測定するためです。加速すると物事は明らかに速く進みますが、これはFX市場でも同じです。つまり、反対方向に加速している通貨をペアにすれば、利益を生む可能性のある取引を特定することができるのです。 通貨の勢いを示す縦の線と矢印は、あなたの取引の指針となるでしょう。 ダイナミックマーケットフィボナッチ23レベルはアラートトリガーとして使用され、市場の動きに適応します。もしインパルスが黄色のトリガーラインに当た
128 USD
Sam TrendBlaster for MT5
AKILA THILINDA JAYARATHNA RANASINGHEGE
3.5 (2)
***** This is an indicator for MT5 providing accurate arrow signals without repainting. ***** Trade With Sam Simple Strategy Guide :  https://www.mql5.com/en/blogs/post/740855 MT4 version of the indicator Try Out and see the Difference The Sam's Trend Blaster indicator tracks the market trend with an unmatched reliability, by ignoring sudden fluctuations and market noise. It has been designed to trend-trade intraday charts and small timeframes. Its winning ratio is around 85%. This is a
144 USD
常に利益を出し続ける5つ星FXトレーダーになりたいですか? 1.私 たちのシンプルな取引 システムの 基本的な説明 と、2020年の主要な戦略のアップデートを お読み ください。 2. 購入時のスクリーンショットを送信すると、専用トレーディングチャットへご招待します。 FXパワー は、すべての時間軸で完全な履歴を持つ初の通貨強度メーターです。 すべての主要通貨の勢いと強さを分析し、高確率のトレードを決定します。 主な機能 主要通貨の完全な強さの履歴 すべての時間軸における通貨の強さの履歴 すべてのブローカー、チャートで同一の計算結果 100%信頼できるリアルタイム計算 -> リペイントなし ドロップダウン・リストで期間を選択可能 1つのチャートに複数のインスタンスを表示可能 FX Powerの表示をドラッグ&ドロップで移動可能 高解像度のQHD、UHD、4Kディスプレイにも対応 端末設定の自動化 タブレットやタッチスクリーンでの使用に最適化 メール、メッセージ、モバイル通知によるアラート機能 EAリクエストのためのアクセス可能なバッファ FX Powerで取引するには?
66 USD
Royal Scalping Indicator is an advanced price adaptive indicator designed to generate high-quality trading signals. Built-in multi-timeframe and multi-currency capabilities make it even more powerful to have configurations based on different symbols and timeframes. This indicator is perfect for scalp trades as well as swing trades. Royal Scalping is not just an indicator, but a trading strategy itself. Features Price Adaptive Trend Detector Algorithm Multi-Timeframe and Multi-Currency Trend Low
149 USD
AI Forecast MT5
Leonardo Antonio Camacaro Armas
The "AI Forecast" indicator is the result of a unique experiment in which I asked an AI how to create the best indicator to anticipate the market. The AI suggested measuring the past history of the price and its reactions to different levels, and then calculating the probabilities of the price reaction in the future. With this idea, I designed with the help of another AI the "AI Forecast" indicator, which adapts to any MetaTrader chart and shows you three lines: one for entry and two for poss
150 USD
This dashboard shows the latest available  Harmonic Patterns  for selected symbols. Free Indicator :   Basic Harmonic Pattern MT4 Version Columns Symbol Trend   (Bullish/ Bearish) Pattern   Type (Gartley/ Butterfly/ Bat/ Crab) Entry  (Entry Price) SL   (Stop Loss Price) TP1   (1st Take Profit Price) TP2  (2nd Take Profit Price) TP3  (3rd Take Profit Price) Current   (Current Price) Age   (Age of pattern in Bars) Alert Settings   (Set an alert if a new pattern is found) You can sort the dashboa
99 USD
The Price Action Finder Multi indicator is a multi-currency and multi-timeframe indicator. It searches for patterns of the Price Action system on all standard time frames at once and on a large (up to 60) number of instruments (currencies, stocks, metals, etc.). The resulting patterns are placed by the indicator in a table at the bottom of the screen. Patterns: At the moment, the indicator contains the following patterns: Outside bar , Inside bar , Pin bar , Force bar , PPR , as well as the In
149 USD
BTFX Daybreak
Bradley Thomas Farrington
5 (1)
Best Trades Fxによって作成された夜明けインジケーターは、ロンドン市場のオープン中にブレイクアウトに気付くようにゾーンをマークします。   ゾーンは標準でGMT + 2に設定されています。これをプラットフォームで有効にするには、ブローカーサーバーに応じて、午前12時GMTと一致する開始時間と午前7時GMTと一致する終了時間を選択する必要があります。   このインジケーターは、すべてのシンボルで使用できます。   このインジケーターの詳細については、Youtubeのビデオをご覧ください。   これとBTFXピボットポイントインジケーターは完璧に機能します。   サポートゾーンとレジスタンスゾーンがチャートに自動的にプロットされるため、分析を行う必要がないためです。   指標に関するご質問は、メールまたは電話でお問い合わせください。   support@besttradesfx.co.uk   01827 842 418   www.besttradesfx.co.uk
66 USD
Renko is a well-known Japanese charting technique that removes time from the chart. Instead of drawing bars in constant intervals (time) as a normal chart would, a Renko chart does so only when price moves beyond a predefined amount. In a Renko chart, a bar is created when price exceeds the previous bar’s high or low by a predefined amount or what we call the Box Size. The result is a chart with equally sized bars running up or down in 45 degree angles. Such a chart offers the following advant
97 USD
iVISTscalp5インジケーターをご紹介します。このインジケーターは、トレーディングにおいて独自でありながら効果的です。時間データに基づくこのインジケーターは、多年にわたる経験と金融市場の深い分析の結果です。iVISTscalp5インジケーターは、手動トレーディングにとって優れたツールです。便利さ、簡単さ、可視化 - すべての複雑さが内部に隠されています。私たちは、iVISTscalp5インジケーターの設定と使用を最大限に簡素化しました。このインジケーターは、MT5ターミナルにあるすべての金融商品に適しています。 稼働時間は、4時から20時(UTC+3)です。 iVISTscalp5インジケーターメニュー(スクリーンショット1を参照): History - 引用を計算する週数 dT_min - 時間間隔の選択(分) TFline - 水平ボリュームの作成(時間枠) BARSline - 水平ボリュームの作成(バー数) TFtrend1 - デイリーチャンネルの作成(時間枠) BARStrend1 - デイリーチャンネルの作成(バー数) TFtrend2 - 週次チャンネルの作成(時
500 USD
ToolBox 360 is the swiss knife of all indicators. It is full packed with useful tools to help you with your trading. It can be used to find best entry and exit points and help you to decide if you should open a trade or not. It shows market trends, candlestick formations outside / inside bars and you can sett time based allerts. Main features: Time based Fibonacci lines Choose a start and end time and the indicator shows you Fibonacci lines within the selected time range including range high
399 USD
Amazing Dashboards Create unlimited Multi-Indicator Dashboards Mix and match from 30 leading indicators and all timeframes, to create unlimited unique dashboards. 32 customizable trading strategy alerts (Trend, Breakout, Overbought, Oversold, Thresholds, Saucers etc). Scalper, Day or Long Term Trader?  Mega Dash has you covered, design your unique dashboard to suit your trading style. Mega Dash is probably the most flexible and easy to use dashboard there is - see the video below.  Unique graphi
69 USD
作者のその他のプロダクト
ICT, SMC, SMART MONEY CONCEPTS, SMART MONEY, Smart Money Concept, Support and Resistance, Trend Analysis, Price Action, Market Structure, Order Blocks, BOS/CHoCH,   Breaker Blocks ,  Momentum Shift, Supply&Demand Zone/Order Blocks , Strong Imbalance, HH/LL/HL/LH,    Fair Value Gap, FVG,  Premium  &   Discount   Zones, Fibonacci Retracement, OTE, Buy Side Liquidity, Sell Side Liquidity, BSL/SSL Taken, Equal Highs & Lows, MTF Dashboard, Multiple Time Frame, BigBar, HTF OB, HTF Market Structure,  L
65 USD
This is a derivative of John Carter's "TTM Squeeze" volatility indicator, as discussed in his book "Mastering the Trade" (chapter 11). Gray  dot on  the midline show that the market just entered a squeeze (Bollinger Bands are with in Keltner Channel). This signifies low volatility, market preparing itself for an explosive move (up or down). Blue dot signify "Squeeze release". Mr.Carter suggests waiting till the first blue after a gray dot, and taking a position in the direction of the mo
FREE
Trade History for MT4  This indicator is specially developed for that traders want to display his trades on the charts. Shows history and current deals on the chart. Trades show on the chart with a dotted line, and profit will show realtime. Buy trades are displayed in bull color, Sell trades in bear color. Tip: The historical order displayed by the indicator is associated with the "Account History", so please set the historical order display in the "Account History" of MT software. If yo
FREE
フィルタ:
ugendran ugen
33
ugendran ugen 2023.06.05 13:22 
 

Great Indicator, when will you convert this indicator to an expert advisor? This would be an impressive EA.

KhalidAliBey
234
KhalidAliBey 2023.06.01 19:13 
 

This could have you Bossed UP with the new Silver Bullet vibes!

Dimluck
19
Dimluck 2023.05.31 18:31 
 

I been using this indicator for two months and i can say that: 1.One of the best indicator 2.Fast analysis of Market structure 3.Seller super responsive 4.Continuous upgrading keep it up Jing Bo Wu!!! your are creating a masterpiece.

Jing Bo Wu
7095
開発者からの返信 Jing Bo Wu 2023.05.31 18:36
Thank you Dimluck. The tagging algorithm of Market Structure is not perfect enough, and I am considering how to make it accurately and perfectly.
Chris Kwon
43
Chris Kwon 2023.05.24 00:34 
 

powerful tool however, simple is always better. too many objects can be distracting

Jing Bo Wu
7095
開発者からの返信 Jing Bo Wu 2023.05.30 08:25
What you said makes sense, the road is as simple as possible. The main purpose of providing so many functions for indicators is to meet different needs of traders, and the functions used by each person's trading system may be different. So the indicators provide a lot of functions and give each function a separate switch. You just need to turn on the function you need.
C Franzener Fernando
67
C Franzener Fernando 2023.05.23 05:30 
 

Indicator with a lot of information, but little material to configure and understand the system. today the creator made an informative tutorial, just listing the functions, but still continuous with many doubts, acronyms that I do not know (PDB), can improve the information of settings that give better result, as I told the creator, it is no use having an airplane without manual, people who know the Smart Money strategy, has no need for an indicator, then it should further improve understanding.

Jing Bo Wu
7095
開発者からの返信 Jing Bo Wu 2023.05.30 08:29
What you said is reasonable. For traders who have just come into contact with SMC/ICT theory, I suggest learning the information I have provided. I will also slowly create explanatory videos so that more people can understand the SMC concepts corresponding to the setting items in the indicators.
DGSIXX
284
DGSIXX 2023.05.22 23:20 
 

Great indicator best on the market

Mctrading123
20
Mctrading123 2023.05.21 03:02 
 

No me permite poner la configuracion como tu imagen donde sale 26.06k de ordenes esas configuraciones no las tiene

Jing Bo Wu
7095
開発者からの返信 Jing Bo Wu 2023.05.21 10:34
Hi bro, if you have any setup issues, please send me a private message. Don't worry.
almheiri82
161
almheiri82 2023.05.20 08:42 
 

Extremely powerful tool and very useful for day traders. very satisfied with this indicator..the best in MQL5

Maicon Batista
36
Maicon Batista 2023.05.05 15:31 
 

could add language option 🙃

christian007
40
christian007 2023.05.02 10:10 
 

great work, best indikator for mt5 ;-) thank you

NoksMkhonza
27
NoksMkhonza 2023.04.30 16:22 
 

This is by far the best purchase I have ever made. I like this current version 9.4 with the new added features "OTE". Thank you very much for helping us to improve our trading skill.

Tyler Sanchez
428
Tyler Sanchez 2023.04.29 16:23 
 

The best I have seen in MQL5, the author is very attentive to suggestions, an indicator that has a lot of potential, I am excited to see how it will develop with updates, I can tell Jing is an excellent developer.

Darren V Hancock
143
Darren V Hancock 2023.04.25 12:28 
 

I am an ICT charter member and original 800.this indicator has some good features. You have clearly put in some great work here. I have noticed a few things though. The accuracy of Order Blocks is not correct, the thresholds are not inclusive of wicks and should be calculated on the body of the candle only, and the fib tool is not always pulling from the correct locations. One single pass through a FVG does not mean its done. If you could make it slowly deminish in color over a set number of passes that would be great. The liquidity voids are nice but the price imbalances (wicks only) should be noted and marked accordingly. I'd like to see and SMT tool overlay with alarm settings. Bearish and Bullish breakers would be great. This indicator has a lot of noise that isn't needed. IF these things I have mentioned were corrected, it would be a cool little indicator. Love the thought and the work that went into this. Is there any way this could be added to a bot to enhance semi auto trading?

Jing Bo Wu
7095
開発者からの返信 Jing Bo Wu 2023.04.25 12:46
Thank you for your evaluation. Unfortunately, my indicators did not meet your expectations. It is not as intelligent as humans and requires people to filter out some noise. If you have particularly good ICT/SMC related indicators, please recommend them to me so that I can learn about them.
BLAZE02
126
BLAZE02 2023.04.24 18:52 
 

Greetings Jing. Is it possible you include volume percentages for the Order Blocks. I guess it would be very useful in making an informed decision.

Jing Bo Wu
7095
開発者からの返信 Jing Bo Wu 2023.04.24 20:16
This feature is in the development plan
Henrique Ratao
292
Henrique Ratao 2023.04.24 08:47 
 

You're a legend! Masterpiece! I will buy it at the end of this rent month :)

Ubaldo Porto Lima
46
Ubaldo Porto Lima 2023.04.24 01:02 
 

Hello Jing Bo Wu, the indicator is very good, I started using it on Friday and I'm really enjoying it. I would like to know if there is any manual available, as it has some acronyms that I am not familiar with? Thank you very much, your work is of great value!!!

whitesaint
55
whitesaint 2023.04.20 22:01 
 

I purchased the tool 2days ago and it shows everything i have to see on the chart. Its such a powerful tool and i strongly recommend it to any serious trader

Roland Tradeorado
135
Roland Tradeorado 2023.04.13 16:34 
 

The indicator is an extremely useful tool and very well implemented. Unfortunately, I don't see how the MTF function would affect the chart - should I see a change in the chart by clicking on the fields?

Jing Bo Wu
7095
開発者からの返信 Jing Bo Wu 2023.04.13 16:54
Are you referring to the MTF Dashboard?
wisner86
20
wisner86 2023.04.10 14:06 
 

create order blocks with volume metric to find points of interest in market order block % + highest volume = point of interest

Coding2022MT4
55
Coding2022MT4 2023.04.06 13:11 
 

There are times the Fibo function is copied or appears twice forcing me to launch is several times, to clear the dublication. Could you check it out. Another thing is that during strong market volatility, the profit scaling and stop loss would be pressed over. Is that normal any way+ BECAUSE IT COULD BE MISLEADING AND RESULT INTO LOSSES. MAY CHANGE THE ALGORITHM SUCH AS FOR EXAMPLE WHEN FIRST PROFIT OR STOP LOSS IS TAKEN, THE ALGORITHM RECALCULATES AND SET NEWW FIRST PROFIT/ STOP LOSS LEVEL AND ERASES THE THE LAST ONE OR PREVIOUS ONE CONTUEOUSLY.

Jing Bo Wu
7095
開発者からの返信 Jing Bo Wu 2023.04.06 13:48
Thank you for your feedback. I will check for duplicate issues with fibo lines. At present, you can click on Fibo Line and right-click to delete duplicates without reloading the indicators.
123
レビューに返信
バージョン 11.2 2023.06.09
Fix bug in FIBO Levels.
バージョン 11.1 2023.06.07
Improve FVG Consequent Encroachment, add appearance attribute settings.
バージョン 11.0 2023.06.06
Fix bug in MTF Dashboard feature.
バージョン 10.9 2023.06.05
Applying two structure algorithms to HTF Structures.
バージョン 10.8 2023.06.05
Error in previous version.
バージョン 10.7 2023.06.05
Modify some default settings, fix bugs occurred when refreshing the indicator.
バージョン 10.6 2023.06.02
Resolve MTF dashboard function bugs caused by adding new features.

The market structure algorithm 2 can more accurately label the reversal of market structure. If you choose this algorithm, it is recommended to set the maxbars for structure smaller.
バージョン 10.5 2023.06.01
Add an algorithm for market structure, and the second algorithm strictly calculates and annotates according to the definition of market structure breakthroughs and reversals.
バージョン 10.4 2023.05.25
Modify some spelling errors in the settings and add an option to show or hide the strong high/low label.
バージョン 10.3 2023.05.19
Enable real-time updates of KILLZONE's high and low range.
バージョン 10.2 2023.05.18
Update Asia Killzone, London Killzone, New York Killzone, London Close Killzone, default to using standard definitions start and end times, the user can customize the start and end times.
バージョン 10.1 2023.05.17
Add London Killzone, AM New York Killzone, PM New York Killzone. Please set the start and end times for Killzone yourself.
バージョン 10.0 2023.05.16
Maxbars for swing and internal structures of MTF dashboard set to the current setting.
バージョン 9.9 2023.05.15
Implement CHoCH+ feature on the MTF dashboard.
バージョン 9.8 2023.05.10
Add Feature: Delete IMBs When filled.
バージョン 9.7 2023.05.08
Modify ZigZag algorithm.
Error modifying supply/demand zone.
バージョン 9.6 2023.05.05
Add Internal/Swing CHoCH+ formed alerts.
バージョン 9.5 2023.05.05
Add CHoCH+ Feature: When there is a formation of CHOCH, the structural high and low points do not break through the previous high and low points, and such CHOCH is labeled as CHOCH+.

Add more Style Options for PDL/PDH PWH/PWL PMH/PML PDC/PDO.
バージョン 9.4 2023.04.29
Add features of display internal OBs with volume metrics.
バージョン 9.3 2023.04.28
Fix a bug that labeling N-lines delay in the Breaker Blocks Feature.
バージョン 9.2 2023.04.27
Add Option for remove Asia Range Label text.
Add Style Options for PDHL/PDCO Lines.
バージョン 9.1 2023.04.27
Optimize and improve the Breaker blocks algorithm.
バージョン 9.0 2023.04.26
Add Breaker Blocks function and Breaker Blocks formed alert.
バージョン 8.9 2023.04.23
Add Volume Imbalance.
Optimize Asia Range function.
バージョン 8.8 2023.04.22
Modify Asian Range function:

Allow the start/end time of the Asian Range to be self-defined.
Add Prediction Lines for Price movement target.
バージョン 8.7 2023.04.19
Optimize the code to solve the problem of MTF Dashboard function slowing down the running speed of indicators.
バージョン 8.6 2023.04.19
Add Alerts for Bullish/Bearish OB formed.
Add Alerts for Supply/Demand OB formed.
Optimize some of the code.
バージョン 8.5 2023.04.18
Add Alerts for Price Touch Premium/Discount Zone.
バージョン 8.4 2023.04.18
Add Fibo-Retracement-OTE Alert.
Add Bullish/Bearish Strong Imbalance Alert.
バージョン 8.3 2023.04.17
Optimization structure breakthrough algorithm.
Add Strong Imbalance Detection and Labeling.
バージョン 8.2 2023.04.13
Applied the Structure Break Type settings to the HTF&MTF Dashboard.
バージョン 8.1 2023.04.11
Add 3 types of breakthroughs for internal structure and swing structure, the users can choose the type they want.
バージョン 8.0 2023.04.10
Add Supply&Demand OB Touch/Break Alert.
バージョン 7.9 2023.04.09
Add Supply&Demand Zone/OrderBlocks Detect. This function aims to identify areas of strong market imbalances and mark corresponding supply and demand regions.
バージョン 7.8 2023.04.04
Add OB Display Option: Display OB With Top-Bottom Lines.
バージョン 7.7 2023.04.01
Modify Fibo OTE function when the user double-click the fibo level line, the fibo level is taken out of program control, and only the user can modify and delete it.
バージョン 7.6 2023.03.31
Fix MTF Dashboard bugs(Sorry, this feature has caused a lot of bugs).
バージョン 7.5 2023.03.30
Add function for MTF Dashboard to display the number of consecutive BOS/iBOS occurrences.
バージョン 7.4 2023.03.30
Add option to change the style of the OB mean threshold.
Add FVG threshold for the users to filter out those too small and insignificant.
Rewrite the fractal point algorithm.
Fix some bugs.
バージョン 7.3 2023.03.29
Fix bug when setting True only for the Fibo OTE.
バージョン 7.2 2023.03.29
Fix the problem of FIBO repeatedly drawing lines.
バージョン 7.1 2023.03.28
Add Fibo levels for OTE and Profit target, the user can manually adjust the Fibo high and low points.
バージョン 7.0 2023.03.27
fix MTF Dashboard bug.
バージョン 6.9 2023.03.27
Add MTF Dashboard function.
バージョン 6.8 2023.03.24
Add HTF Premium&Discount Zone.
Add Option to extend NWOG/NDOG to current candle.
バージョン 6.7 2023.03.23
Add Options for internal structure and swing structures, user can set the label text size and line width.
バージョン 6.6 2023.03.23
Change the style of OB mean threshold.
バージョン 6.5 2023.03.22
Add Option to Time Zone / Asian Range / NWOG / NDOG, The user can set to display only the latest few results to avoid cluttering CHART with all of them displayed.
バージョン 6.4 2023.03.22
Fixed spelling errors in the settings panel.
Improved NWOG/NDOG algorithm.
バージョン 6.3 2023.03.22
Fix Trend Candle color setting bug.

Add HTF Strong/Weak High/Low
バージョン 6.2 2023.03.21
Add NWOG/NDOG function
バージョン 6.1 2023.03.20
Add Fractal Points & ZigZag Line
バージョン 6.0 2023.03.20
Add NY Midnight open line
バージョン 5.9 2023.03.19
Version 5.9

Add options for HTF OB style
Add options for Aisan Range
バージョン 5.8 2023.03.18
Version 5.8

Optimize Time Zone Function.
Add Asia Range function for day trade.
バージョン 5.7 2023.03.13
Version 5.7

Add HTF OB iOB function
バージョン 5.6 2023.03.12
Version 5.6

Add Continue to improve HTF functions.
バージョン 5.5 2023.03.11
Version 5.5

Add High Timeframe Structure ability.

BigBar, HTF iBOS, HTF BOS, HTF iCHoCH, HTF CHoCH
バージョン 5.3 2023.03.07
Version 5.3

Add Previous Day High/Low Price touch detect.
Input parameters verification.
Optimize some codes to make the indicator calculation faster.
バージョン 5.2 2023.03.06
Version 5.2

Update Time Zone algorithm
バージョン 5.1 2023.03.04
Version 5.1

Optimizing Candle Timer, not display the error countdown when there is no market data.
バージョン 5.0 2023.03.03
Version 4.9.1

Fix Candle Timer bug
バージョン 4.9 2023.03.03
Version 4.9

Optimize Time Zone and Candle Timer
バージョン 4.8 2023.03.02
Version 4.8

Add Candle Timer
Add Time Zone
バージョン 4.7 2023.03.01
Version 4.7

Add Liquidity Voids Detect
バージョン 4.6 2023.02.28
Version 4.6

Add Alerts to Email function
バージョン 4.5 2023.02.28
Version 4.5

Add FVG Touch alert
バージョン 4.4 2023.02.27
Version 4.4

Add Display full Fibo Levels Option
バージョン 4.3 2023.02.27
Version 4.3

Add FVG Extend Option: FVG extend to the current candle
バージョン 4.2 2023.02.25
Version 4.2

Add BSL/SSL Taken Alert
バージョン 4.1 2023.02.24
Version 4.1

fix BSL/SSL Taken bug
バージョン 4.0 2023.02.24
Version 4.0

Add BSL/SSL Taken Detect
バージョン 3.9 2023.02.22
Version 3.9

Add Fibonacci Retracement
バージョン 3.8 2023.02.20
Version 3.8

Fix bug of CHoCH BOS label text display options
バージョン 3.7 2023.02.20
Version 3.7

Add CHoCH BOS label text display options
バージョン 3.6 2023.02.20
Version 3.6
Add Alert when LW formed
Add Alert when LW filled
Add LW display options for filled
バージョン 3.5 2023.02.19
Version 3.5

Add Long Wicks detect function

Optimize OB mean threshold display
バージョン 3.4 2023.02.19
Version 3.4

Add OB iOB touch Alert
OB mean threshold and FVG Consequent Encroachment color Options
バージョン 3.3 2023.02.18
Version 3.3

Add OB mean threshold
Add FVG mean threshold
バージョン 3.2 2023.02.18
Version 3.2

Add Previous Day Open/Close
More concise OB display
バージョン 3.1 2023.02.15
Version 3.1

Optimize code
バージョン 3.0 2023.02.13
Version 3.0

Optimize code
Optimize FVG functions and support high timeframe FVG
バージョン 2.8 2023.02.12
FVG filled and FVG formed detect without delay.

Fixed some bugs
バージョン 2.7 2023.02.10
Version 2.7

Set alerts for BOS OB CHOCH etc separately
Support setting to send Alert to mobile devices.
バージョン 2.6 2023.02.09
Version 2.6
バージョン 2.5 2023.02.09
Version 2.5
バージョン 2.4 2023.02.08
Version 2.4

Fix Trend Candles bug
バージョン 2.3 2023.02.08
Version 2.3

Draw Candles by Trend
Previous day/week/monthly high/low
バージョン 2.2 2023.02.08
version 2.2

Modify Premium & Discount Zones
バージョン 2.1 2023.02.07
version 2.1

fix bug
バージョン 2.0 2023.02.07
version 2.0

Modify Fair Value Gap Detection
バージョン 1.3 2023.02.05
version 1.3

fix alert bug
バージョン 1.2 2023.02.03
version 1.2

EQH/EQL bug fix
add Alert function
バージョン 1.1 2023.02.03
version 1.0.1 :

fix bug