• Übersicht
  • Bewertungen (26)
  • Diskussion (24)
  • Neue Funktionen

Smart Market Structure Concepts MT5

5

ICT, SMC, SMART MONEY CONCEPTS, SMART MONEY, Smart Money Concept, Support and Resistance, Trend Analysis, Price Action, Market Structure, Order Blocks, BOS/CHoCH, Momentum Shift, HH/LL/HL/LH,  Fair Value Gap, FVG, Premium & Discount Zones, Fibonacci Retracement, OTE, Buy Side Liquidity, Sell Side Liquidity, BSL/SSL Taken, Equal Highs & Lows, MTF Dashboard, Multiple Time Frame, BigBar, HTF OB, HTF Market Structure,  Liquidity Voids, Long Wicks, Candle Timer, Fractals, ZigZag, Time Zone, Market Sessions, Asian Range, NY Midnight Open, NDOG, NWOG

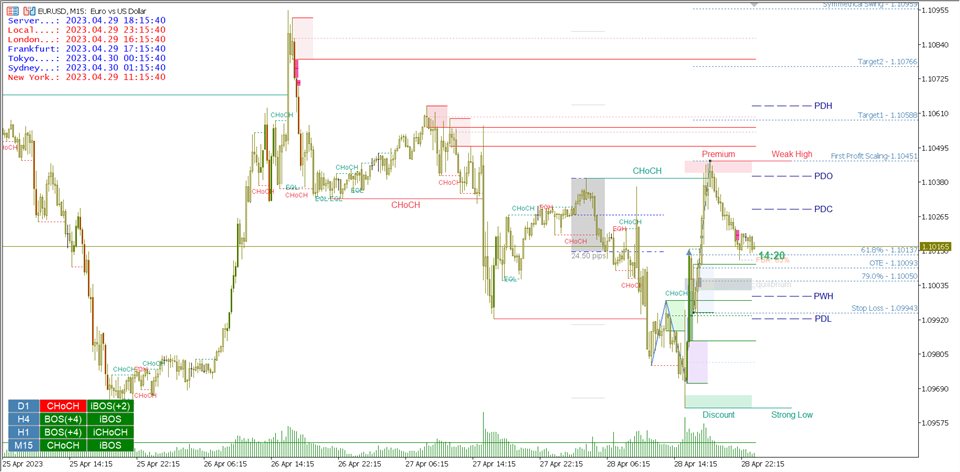
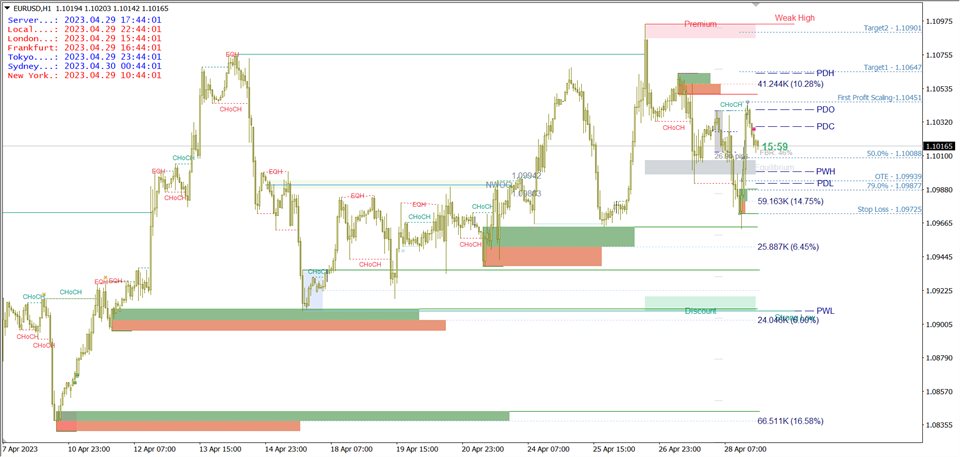
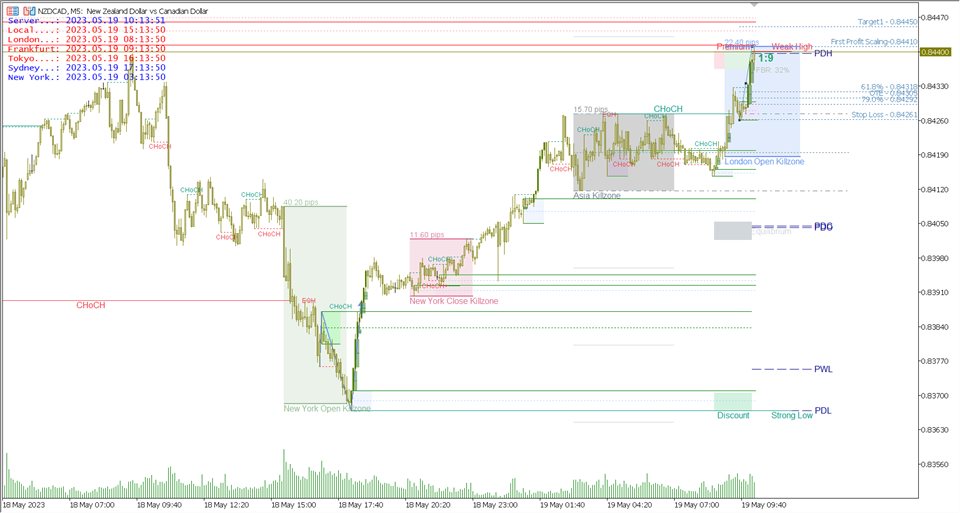
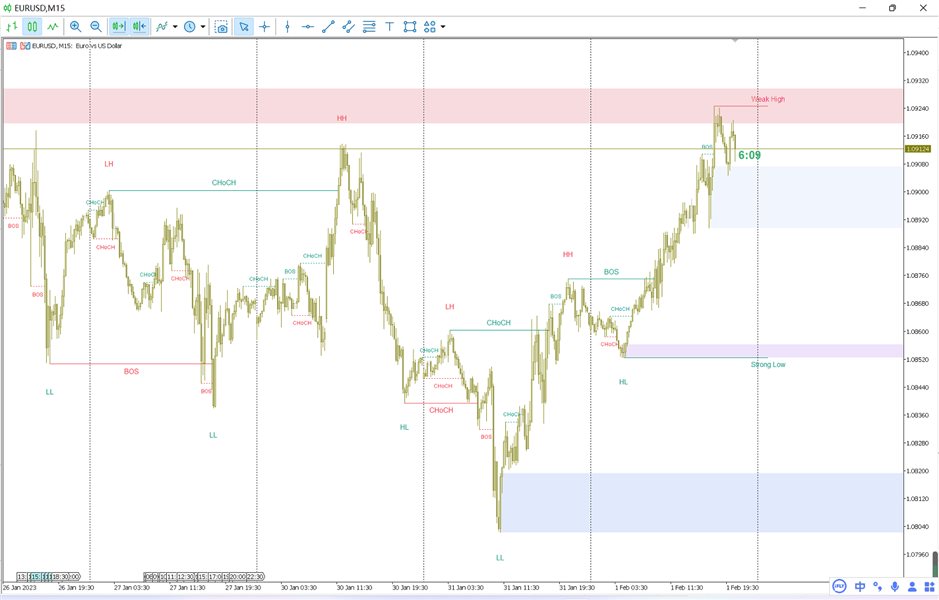
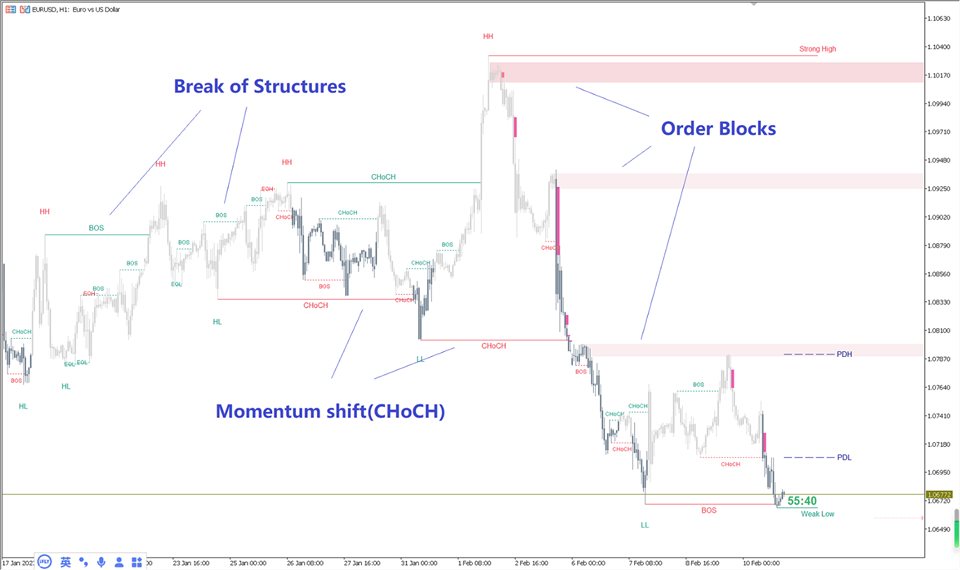
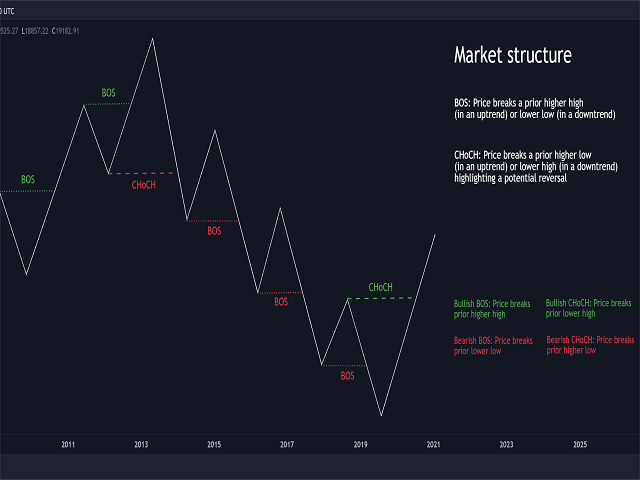
This all-in-one indicator displays real-time market structure (internal & swing BOS / CHoCH), order blocks, premium & discount zones, equal highs & lows, and much more...allowing traders to automatically mark up their charts with widely used price action methodologies. 

"Smart Money Concepts/Smart Market Structure Concepts" ( SMC ) is a fairly new yet widely used term amongst price action traders looking to more accurately navigate liquidity & find more optimal points of interest in the market. Trying to determine where institutional market participants have orders placed (buy or sell side liquidity) can be a very reasonable approach to finding more practical entries & exits based on price action.

This indicator contains alerts for almost all price characteristics, which you can set freely.

 (MT4 version here)

If you are not familiar with SMC trading, you can contact me and I can share a concise document for you to learn.

Features

  • Full internal & swing market structure labeling in real-time
  • Break of Structure (BOS)
  • Change of Character (CHoCH)
  • Order Blocks ( bullish & bearish )
  • Swing Strong/Weak High/Low
  • High Timeframe ability. BigBar, HTF-BOS HTF-CHoCH HTF-OB HTF-Swing High/Low.
  • Multi-Timeframe Dashboard (Optional for 4 Period)
  • Fractal Points
  • Fibonacci Retracement
  • BSL/SSL Taken Detect
  • Equal Highs & Lows
  • Fair Value Gap Detection,support high timeframe FVG display
  • Liquidity Voids
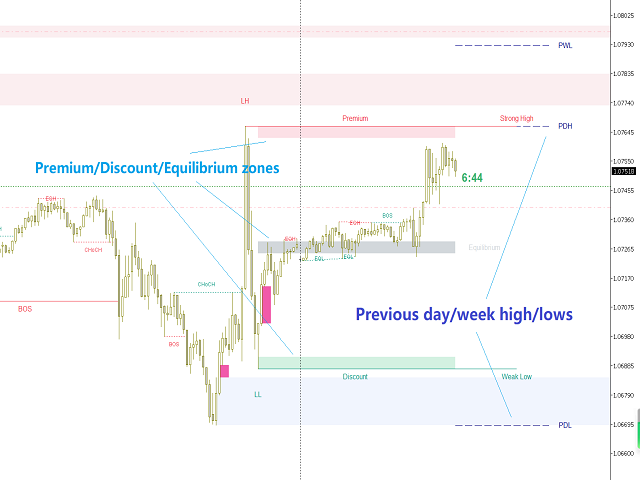
  • Previous Highs & Lows
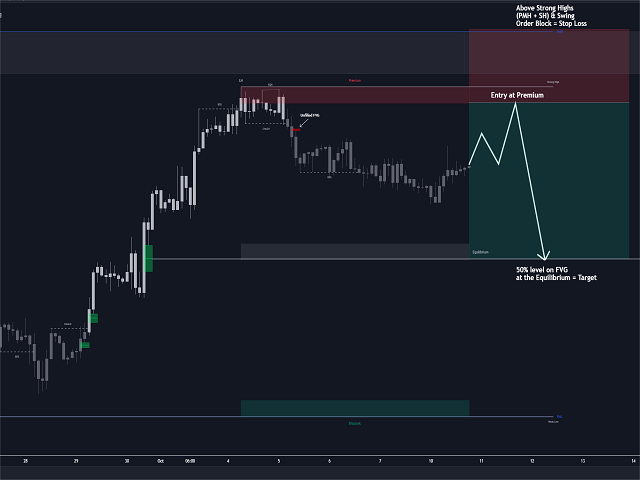
  • Premium & Discount Zones as a range
  • Long Wicks detect
  • Market Time Zone
  • Asian Range
  • NY Midnight Open
  • NWOG/NDOG
  • Candle Timer
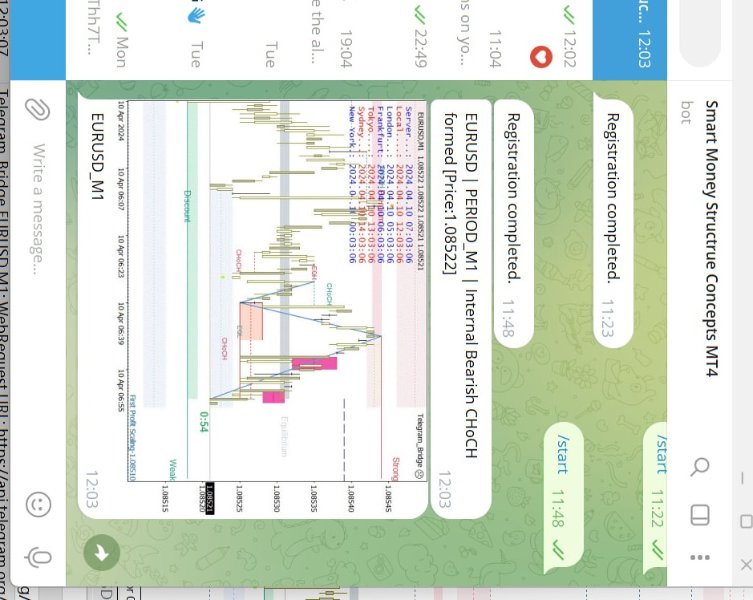
  • Alert for BOS CHoCH OB etc separately. Support setting to send Alert to mobile devices and Email.
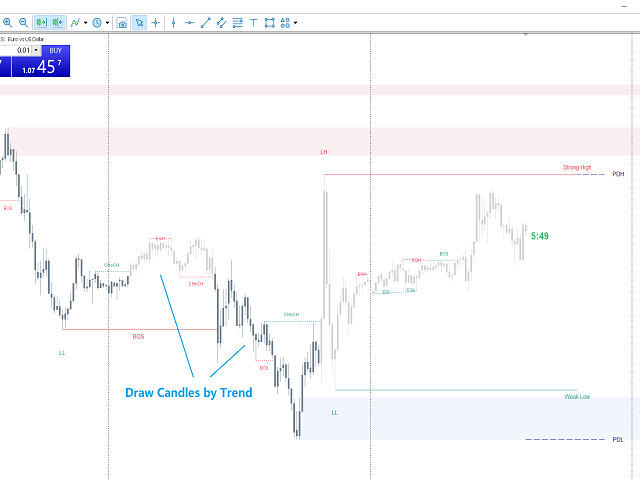
  • Draw Candles by trend(MT5 version only)
  • Options to style the indicator to more easily display these concepts


Settings

  • ----------General Settings----------
  • Allows to display historical Structure or only recent ones:  Allows the user to select Historical (default) or Present, which displays only recent data on the chart.
  • Max bars back for caculate: Allows the user to set the historical  number of max bars for indicator caculate. If you want to see more HTF information, you need to set this value higher.

  • ----------Internal Structure----------
  • Show Internal Structure: Displays the internal structure labels & dashed lines to represent them. (BOS & CHoCH).
  • Select iBullish Structure type: Allows the user to select display All bullish structure or BOS/CHoCH separately.
  • iBullish Structure Color: Allows the user to define the color you like.
  • iBullish Structure Text Size:  Allows the user to set the label text size and line width.
  • iBullish Structure Line Width:
  • Select iBear Structure type:  Allows the user to select display All bearish structure or BOS/CHoCH separately.
  • iBear Structure Color:  Allows the user to define the color you like.
  • iBear Structrue Text Size:  Allows the user to set the label text size and line width.
  • iBear Structrue Line Width:
  • Maxbars to find Internal Structure: Define the bars number for confirm Internal High/Low, For large TF, consider setting the value smaller, and the small TF larger.
  • Structure detect Filter: Filter non-significant internal structure breakouts.
  • ---------------------------
  • Show iBull BOS label text: Allows the user to turn off the display of Label text, If you don't like to see many text displays.
  • Show iBull CHoCH label text
  • Show iBear BOS label text
  • Show iBear CHoCH label text
  • --------------------------

  • ----------Swing Structure----------
  • Show Swing Structure: Displays the swing structure labels & solid lines on the chart (larger BOS & CHoCH labels).
  • Select Bullish Structure type:  Allows the user to select display All bullish structure or BOS/CHoCH separately.
  • Bullish Structure Color: Allows the user to define the color you like.
  • Bullish Structure Text Size:  Allows the user to set the label text size and line width.
  • Bullish Structure Line Width: 
  • Select Bear Structure type:  Allows the user to select display All bearish structure or BOS/CHoCH separately.
  • Bear Structure Color:  Allows the user to define the color you like.
  • Bear Structure Text Size:  Allows the user to set the label text size and line width.
  • Bear Structure Line Width: 
  • Show Swings Points(HH/HL/LL/LH): Displays swing points labels on chart such as HH, HL, LH, LL.
  • Maxbars to find Swing Structure:  Define the bars number for confirm Swing High/Low.
  • Show Strong/Weak High/Low: Display the latest High/Low lines, Conforming to the price trend is defined as Strong High/Low.
  • --------------------------
  • Show Bull BOS label text:  Allows the user to turn off the display of Label text, If you don't like to see many text displays.
  • Show Bull CHoCH label text
  • Show Bear BOS label text
  • Show Bear CHoCH label text
  • --------------------------

  • -----------Fractal Points----------
  • Show ZigZag Lines: Display ZigZag Lines on the chart.
  • Show Fractal Points:  Display Fractal Points on the chart.
  • Bars For Fractal: Bars number for calculate  Fractals.
  • ZigZag Line style: Allow the user to change the line color and style.
  • ZigZag Line color: 
  • Fractal High Color:   Allow the user to change the Fractal Points color.
  • Fractal Low Color: 

  • -----------Order Blocks----------
  • Show Internal Order Blocks: Enables Internal Order Blocks & allows the user to select how many most recent Internal Order Blocks appear on the chart.
  • Show Last iOB count: If you want to see more IOBs on the chart, set the number higher.
  • Show Swing Order Blocks: Enables Swing Order Blocks & allows the user to select how many most recent Swing Order Blocks appear on the chart.
  • Show Last OB count (min value 1): If you want to see more OBs on the chart, set the number higher.
  • Show OB mean threshold: Enables the Order Blocks mean threshold.
  • Order Block Filter: Use ATR to filter out extra long candles which will be defined as Order Block.
  • --------------------------
  • Bull Bear OB Alternating display(More concise): Default is false, This option is specially set for those who do not want to see a bunch of OBs.
  • If you don't want to see too many messy OB blocks,select true
  • --------------------------

  • -----------OB style settings----------
  • Internal Bullish OB Color: The set color will be applied to Internal Bullish Order blocks which display as filled rectangles.
  • Internal Bearish OB Color
  • Bullish OB Color
  • Bearish OB Color
  • Extend the OB rectangles: Extend the OB rectangles to the rightmost edge of the chart.
  • Bull OB mean threshold color
  • Bear OB mean threshold color

  • ----------High Timeframe Structure----------
  • Show High Timeframe Control Panel: Display control panel of HTF, You can quickly control the display and hide of bigBar ChoCH BOS OB through the buttons on the panel.In order to avoid too much messy information, it is recommended to turn off LTF related functions when using HTF functions. 
  • Select High Timeframe: Select HTF Period.The selected period must be greater than the period of the current chart.
  • Show HTF BigBar: Display the Candles of large period. BigBar will be displayed in the lower layer of the current candle graph. In order to avoid the color confusion of large and small period, it is recommended to set the color of candles in small period to light color.
  • Show HTF Internal BOS
  • Show HTF Swing BOS
  • Show HTF Internal CHoCH
  • Show HTF Swing CHoCH
  • Show HTF Internal OB
  • Show HTF Swing OB
  • Show HTF OB mean threshold
  • Show HTF Strong/Weak High/Low

  • -----------HTF Structure Style settings----------
  • Internal Bullish OB Color
  • Internal Bearish OB Color
  • Bullish OB Color
  • Bearish OB Color
  • Extend the OB rectangles
  • Bull OB mean threshold color
  • Bear OB mean threshold color
  • Internal Bullish Structure Color
  • Internal Bear Structure Color
  • Swing Bullish Structure Color
  • Swing Bear Structure Color
  • Bull BigBar color
  • Bear BigBar color

  • ----------MTF Structures Dashboard----------
  • Show MTF Structures Dashboard: Display Multi-Timeframe  Structures Dashboard in the four corners of the chart.
  • MTF Dashboard Panel Corner
  • Select Timeframe1: Allow the users to set any four period.
  • Select Timeframe2
  • Select Timeframe3
  • Select Timeframe4
  • Show Internal Structures: Display internal structures(Bull/Bear iCHoCH&iBOS)
  • Show External Structures: Display external structures(Bull/Bear CHoCH&BOS)
  • Bull Structure Label Text Color
  • Bear Structure Label Text Color
  • Bull Structure Label BgColor
  • Bear Structure Label BgColor

  • ----------Fibonacci Retracement----------
  • Show Fibonacci Retracement Line: When there is a market structure formed, Indicator start to detect the price retracement.
  • Select FB Retracement type: FB Retracement according to which type of market structrue, Internal or Swing
  • Fibonacci Retracement Line color: 
  • FBR Text color when price retracement exceeds 50%: When Price Retracement over 50%, change text color to a more striking color.
  • Display full FB levels:Display complete FB objects.
  • Level 1: You can customize FB levels parameters.
  • Level 2: You can customize FB levels parameters.
  • Level 3 You can customize FB levels parameters.
  • Level 4 You can customize FB levels parameters.
  • FB levels color

  • ----------BSL/SSL Taken Detect----------
  • Show BSL/SSL Taken Line: Enables the BSL/SSL Taken detection and display arrow line,Because of the limitation of the algorithm, it is recommended to enable this function only in large period.
  • Show BSL/SSL Taken Text: Display text option
  • BSL/SSL Taken threshold(minval=0.5, step=0.1): Filter out those BARs that are too much higher/lower than the previous high/low
  • BSL line and text color
  • SSL line and text color

  • ----------EQH/EQL----------
  • Show Equal High/Low: Displays EQH / EQL labels on chart for detecting equal highs & lows.
  • Bars Confirmation Length: Allows the user to select how many bars are needed to confirm an EQH / EQL symbol on chart.
  • Auto Threshold: Filter out non-significant fair value gaps.

  • ----------Fair Value Gaps----------
  • Display Fair Value Gaps: Display FVGs as rectangles on chart.For those who are used to trading with FVG, the indicator provides the function of extending the FVG rectangle to the right to the current BAR and displaying the HTF FVG.
  • Auto Threshold: Filter out too small FVG.
  • Timeframe: Allows the user to select display high-timeframe FVGs.
  • Bullish FVG Color
  • Bearish FVG Color
  • Extend FVG(minval = 0): Allows the user to define the distance that FVG rectangles extends to the right, If 1, it means extending to the right 1 Bar distance.
  • Extend FVG rectangle to current candle: You can extend FVG directly to the right to the current Bar.
  • Delete FVG when filled: Delete the FVG when price filled it.
  • Filled FVG color: If you choose not to delete FILLED FVGs, you can set colors to distinguish them from FILLED FVGs.
  • Show FVG Consequent Encroachment:  Enables the  FVG Consequent Encroachment
  • Bull FVG Consequent Encroachment color
  • Bear FVG Consequent Encroachment color

  • ----------Liquidity Voids----------
  • Display Liquidity Voids: Detect  Liquidity Voids and mark it. Here LV is defined as the gap imbalance between two candles. LVs rarely appear in the continuously traded foreign exchange market,The stock index market appears more frequently and is also more important. 
  • Auto Threshold
  • Liquidity Voids Color
  • Delete LVs when filled
  • Filled LVs color

  • ----------Long Wicks-----------
  • Show Long Wicks: Display Long Wicks at the High/Low area.
  • Long Wick threshold(minval=0.5,step=0.1): The higher the value, the longer the wick need to be displayed.
  • Bullish LW Color
  • Bearish LW Color
  • Delete LW when filled
  • Filled LW color

  • ----------Premium/Discount zones----------
  • Show Premium/Discount Zones: Allows the user to display Premium, Discount , and Equilibrium zones of last swing on the chart
  • Premium Zone Color
  • Equilibrium Zone Color
  • Discount Zone Color

  • ----------Previous Day/Week/Monthly High/Low----------
  • Show daily high/low
  • Line Color for daily 
  • Show weekly high/low
  • Line Color for weekly 
  • Show Monthly high/low
  • Line Color for monthly

  • ----------Previous Day Open/Close----------
  • Show previous  day open/close
  • Line Color for PDO/PDC

  • ----------Time Zone----------
  • Show Market Time Zone with rectangle: Automatically mark the trading time zone of each foreign exchange market.
  • Number of Each Market Time Zone to display(0 means all):  The user can set to display only the latest few results to avoid cluttering CHART with all of them displayed.
  • Time Zone Rectangle color
  • Time Zone label font size
  • Show London Time Zone
  • Show Frankfurt Time Zone
  • Is European Summer Time: When European time is summer time, set it to true.
  • Show Tokyo Time Zone
  • Show Sydney Time Zone
  • Show New York Time Zone
  • Is US Summer Time:  When US time is summer time, set it to true.
  • -------------------------
  • Show Asian Range: For day trade, the use of Asian Range and Opening Price are key. See ICT theory.
  • Number of Asian Box to display(0 means all):  The user can set to display only the latest few results to avoid cluttering CHART with all of them displayed.
  • Asian Range Box Color
  • Asian Range Line Color
  • Asia Max Favourable Range
  • -------------------------
  • Show NY Midnight Open
  • Show NY Midnight VLine
  • NY Midnight VLine style
  • NY Midnight VLine color
  • NY Midnight HLine style
  • NY Midnight HLine color
  • -------------------------
  • Show Tokyo Open Price
  • Show Sydney Open Price
  • Show London Open Price
  • Show Frankfurt Open Price
  • Show NewYork Open Price
  • Open Line Color
  • Open Line Width
  • -------------------------
  • Show Time Zone Panel at top left corner 
  • Panel text color
  • Panel text color for market opening

  • ----------NWOG/NDOG----------
  • Display New Week Open Gap
  • Number of NWOG to display(0 means all)
  • NWOG Box Color
  • Show NWOG Label 
  • NWOG Label color
  • Show NWOG C.E.
  • NWOG C.E. Line style
  • NWOG C.E. Line color
  • -------------------------
  • Display New Day Open Gap
  • Number of NDOG to display(0 means all)
  • NDOG Box Color
  • Show NDOG Label 
  • NDOG Label color
  • Show NDOG C.E.
  • NDOG C.E. Line style
  • NDOG C.E. Line color

  • ----------Candle Timer----------
  • Show Candle Timer: Display the countdown of each candle.
  • Text Size
  • Text Font 
  • Text Color
  • Text Color Countdown
  • Text Shift Bars(Candle Location)
  • Text Shift Price(Candle Location)
  • Enable Alarm when the Candle is going to finished: Turn on the candle countdown alarm clock.
  • Set Countdown seconds for Candle Alarm: Set countdown
  • Sound Wav File: Select the sound file. You can put the sound file in the sounds directory of the MT installation directory.

  • ----------Draw Candles by Trend----------(MT5 version only)
  • Draw Candles by Trend: Draw candles color according to internal trend.
  • Bull Candles Color
  • Bear Candle Color

  • ----------Alerts----------
  • Alert when Bullish CHoCH formed
  • Alert when Bullish BOS formed
  • Alert when Bearish CHoCH formed
  • Alert when Bearish BOS formed
  • Alert when Internal Bullish CHoCH formed
  • Alert when Internal Bullish BOS formed
  • Alert when Internal Bearish CHoCH formed
  • Alert when Internal Bearish BOS formed
  • -------------------------
  • Alert when Internal Bullish OB break
  • Alert when Internal Bearish OB break
  • Alert when Bullish OB break
  • Alert when Bearish OB break
  • -------------------------
  • Alert when Internal Bullish OB touched
  • Alert when Internal Bearish OB touched
  • Alert when Bullish OB touched
  • Alert when Bearish OB touched
  • OB Touch threshold(minval=0, maxval=1, step=0.1)
  • -------------------------
  • Alert when EQH formed
  • Alert when EQL formed
  • Alert when Swing High formed
  • Alert when Swing Low formed
  • -------------------------
  • Alert when Bullish FVG formed
  • Alert when Bearish FVG formed
  • Alert when Bullish FVG filled
  • Alert when Bearish FVG filled
  • Alert when Bullish FVG touched
  • Alert when Bearish FVG touched
  • FVG Touch threshold(minval=0, maxval=1, step=0.1)
  • -------------------------
  • Alert when Bullish LW formed
  • Alert when Bearish LW formed
  • Alert when Bullish LW filled
  • Alert when Bearish LW filled
  • -------------------------
  • Alert when BSL Taken
  • Alert when SSL Taken
  • -------------------------
  • Alert when Previous Day High touched
  • Alert when Previous Day Low touched
  • PDH/PDL Touch threshold(minval=0, maxval=0.5, step=0.1)

  • ----------Alerts to mobile----------
  • Alert to your MT4/5 mobile device
  • To realize this function you need:
  • 1.MetaQuotes IDs are specified.(Tools->Options->Notifications->MetaQuotes ID)
  • 2.Enable Push Notifications.(Tools->Options->Notifications->Enabel Push Notifications)

  • ----------Alerts to Email---------- (MT5 version only)
  • Alert to your Email address
  • To realize this function you need:
  • 1.Enable Email Notifications.(Tools->Options->Email->Enable Email Notifications)
  • 2.Setup an Email Account at www.gmx.com.(Video tutorial: https://www.youtube.com/watch?v=lSomE8aFa2Q)
  • 3.Enable access to GMX account via POP3 and IMAP.(GMX Email->Settings->POP3 & IMAP)
  • 4.Fill in the mailbox information for sending mail.(Tools->Options->Email->SMTP Server/SMTP login/SMTP psw/From/To)


Bewertungen 20
Sergey Gubenko
160
Sergey Gubenko 2023.03.31 08:51 
 

Good afternoon Jing Bo Wu, thank you very much for the indicator.

Sebastian Schmidt
891
Sebastian Schmidt 2023.03.31 06:53 
 

unbeatable price - performance ratio, for beginners and advanced traders with this indicator you learn something for life many thanks for the good work and the fair price.

phenphen
30
phenphen 2023.03.24 06:35 
 

It's the best indicator I've ever had, be patient till graph hit DZ/SZ.

Empfohlene Produkte
Swiss VWAPsimple
Terence Gronowski
5 (3)
Swiss VWAPsimple Motivation Ich fand keinen zuverlässigen gratis VWAP Indikator für MT5. VWAP ist ein sehr wichtiger Indikator. Aber Vorsicht, er ist unpräzise, insbesondere am Abend, falls die Summen schon sehr gross sind. Um den Computer zu schonen und Abstürze zu vermeiden wird der VWAP nur immer von Mitternacht aus gezeichnet. Bei geschlossenen Märkten wird nichts angezeigt, ausser man deaktiviert useBarsSinceMidnight. Was ist VWAP, wie wird er angewandt?  VWAP steht für Volume Weighed Ave
FREE
Weis Wave Double Side Alert
Eduardo Da Costa Custodio Santos
Der Weis Wave Bouble Side Indicator für MT5 ist Teil des Toolkits (Wyckoff Academy Wave Market) Der Weis Wave Bouble Side Indicator für MT5 wurde basierend auf dem bereits etablierten Weis Wave von David Weis entwickelt. Der Weis Wave Double Side Indikator liest den Markt in Wellen, wie es R. Wyckoff im Jahr 1900 tat. Es hilft bei der Identifizierung von Aufwand x Ergebnis, Ursache und Wirkung sowie Angebot und Nachfrage Sein Unterschied besteht darin, dass es unterhalb der Nullachse verwendet w
60 USD
White Weis Volume This indicator shows the sum of the volume in each wave, bulish or bearish, as idealized by David Weis , but it brings an important addition , which is the marking of the bar with the highest volume of the wave (White Bar)! In coding the indicator, it was sought to optimize the code to require minimal processing during use and not to overload mt5. The indicator can be used for pre-trading analysis and study, where the trader analyzes possible points of support and resi
30 USD
O  GRIDBOT WIM  robô de investimento para Mini Índice. Parametrizado com grade linear ou zona de expansão (FIMATHE). CONFIGURAÇÕES: Ponto de entrada Pivot dia anterior    double r1 = pivot + distance;    double r2 = r1 + distance;    double r3 = r2 + distance;    double r4 = r3 + distance;    double r5 = r4 + distance;    double r6 = r5 + distance;    double r7 = r6 + distance;    double r8 = r7 + distance;    double r9 = r8 + distance;    double r10 = r9 + distance;        double s1 = pivot
30 USD
Stackable VWAP
Flavio Jarabeck
3.8 (5)
Volume Weighted Average Price (VWAP) is a trading benchmark commonly used by Big Players that gives the average price a Symbol has traded throughout the day. It is based on both Volume and price. Additionally we put in this indicator the MVWAP (Moving Volume Weighted Average Price). For those who do not know the usage and the importance od this indicator I recommend a great article about this subject at Investopedia ( https://www.investopedia.com/articles/trading/11/trading-with-vwap-mvwap.asp
FREE
Simple Weis Wave
Jean Jacques Huve Ribeiro
4 (4)
One of the best tools for analyzing volume, Weis Wave was idelized by David Weis, to facilitate the reading of directional flow. For the VSA method disciples it is an evolution of the practices created by Richard Wycoff, facilitating a predictive reading of the market, always seeking an accumulation and distribution of the negotiated contracts. Cumulative wave volume  Range of wave ( removed) Average Wave volume Ref "Tim Ord lectures" ( removed)
FREE
MIDAS Super VWAP
Flavio Jarabeck
4.23 (13)
Imagine VWAP, MVWAP and MIDAS in one place... Well, you found it! Now you can track the movement of Big Players in various ways, as they in general pursue the benchmarks related to this measuring, gauging if they had good execution or poor execution on their orders. Traders and analysts use the VWAP to eliminate the noise that occurs throughout the day, so they can measure what prices buyers and sellers are really trading. VWAP gives traders insight into how a stock trades for that day and deter
FREE
VWAP and MVWAP
Flavio Jarabeck
4.29 (7)
Volume Weighted Average Price (VWAP) is a trading benchmark commonly used by Big Players that gives the average price a Symbol has traded throughout the day. It is based on both Volume and price. Additionally we put in this indicator the MVWAP (Moving Volume Weighted Average Price). For those who do not know the usage and the importance od this indicator I recommend a great article about this subject at Investopedia ( https://www.investopedia.com/articles/trading/11/trading-with-vwap-mvwap.asp )
FREE
The idea of a Value Chart indicator was presented in the very good book I read back in 2020 , " Dynamic Trading Indicators: Winning with Value Charts and Price Action Profile ", from the authors Mark Helweg and David Stendahl. The idea is simple and the result is pure genius: Present candlestick Price analysis in a detrended way! HOW TO READ THIS INDICATOR Look for Overbought and Oversold levels. Of course, you will need to test the settings a lot to find the "correct" one for your approach.
FREE
VWAP Indicator
LUC JACOBUS A VERHEECKE
4.19 (16)
Volume Weighted Average Price (VWAP) The volume weighted average price (VWAP) is a   trading   benchmark   used by traders that gives the average price a security has traded at throughout the day, based on both volume and price. It is important because it provides traders with insight into both the trend and value of a security. This indicator VWAP V2 is free and is the manual version of the extended Easy VWAP indicator (30 Euro), where the date and time properties are automatically entered. Wit
FREE
Volume Weighted Average Price (VWAP) is a trading benchmark commonly used by Big Players that gives the average price a Symbol has traded throughout the day. It is based on both Volume and price. For those who do not know the usage and the importance od this indicator I recommend a great article about this subject at Investopedia ( https://www.investopedia.com/articles/trading/11/trading-with-vwap-mvwap.asp ). We do not recommend to trade solely on this indicator. Use it as a one more tool in yo
FREE
Der Indikator ermöglicht es Ihnen, die aktuelle Kursrichtung und Marktvolatilität zu bestimmen. Diese Version des Traders Dynamic Index hat das Neuzeichnen der historischen Daten eliminiert, die Berechnungsgeschwindigkeit des Algorithmus optimiert, mehr externe Parameter für eine genauere Anpassung und seine Funktionalitäten erweitert: die Auswahl des anfänglichen Oszillators und die Glättungsmethoden der Durchschnitte hinzugefügt . Parameter: Mode Osc - A uswahl des Schätzoszillators Period Osc
35 USD
Weis Wave Double Side
Eduardo Da Costa Custodio Santos
Der Weis Wave Bouble Side Indicator für MT5 ist Teil des Toolkits (Wyckoff Academy Wave Market) Der Weis Wave Bouble Side Indicator für MT5 wurde basierend auf dem bereits etablierten Weis Wave von David Weis entwickelt. Der Weis Wave Double Side Indikator liest den Markt in Wellen, wie er gemacht wurde von R. Wyckoff im Jahr 1900. Es hilft bei der Identifizierung von Aufwand x Ergebnis, Ursache und Wirkung sowie Angebot und Nachfrage Sein Unterschied besteht darin, dass es unterhalb der Nullach
30 USD
VWAP Bands
Rafael Caetano Pinto
This indicator uses VWAP and projects this VWAP into up to 3 levels, shifted by a percentage of the chart's symbol. How to configure: Choose the symbol and desired graphic time Set the start time of the symbol (in bovespa, WIN and WDO start at 9 o'clock). This time is used as the cutoff reference for VWAP. Check which VWAP period fits the chart better: Ideally, a period when VWAP is not too distant from the chart Set percentage levels: Ideally, you should set levels based on history, so that l
30 USD
VWAP with more settings
Maria Cristina Sabatini
I developed this vwap with more settings in order to be customized as much as possible.  VWAP is a really strong indicator for your trading. It can be used to check if the market is in balance or ranged, and also you can use the levels as support/resistence/target.  In the pictures you can see the main settings, and you can select the use of real volume from the broker. Hope you will find it useful. Many thanks in advance.  
35 USD
Aggression Volume
Flavio Jarabeck
3.79 (19)
Aggression Volume Indicator is the kind of indicator that is rarely found in the MQL5 community because it is not based on the standard Volume data provided by the Metatrader 5 platform. It requires the scrutiny of all traffic Ticks requested on the platform... That said, Aggression Volume indicator requests all Tick Data from your Broker and processes it to build a very special version of a Volume Indicator, where Buyers and Sellers aggressions are plotted in a form of Histogram. Additionally,
FREE
Die Einzigartigkeit dieses Indikators liegt im Volumenabrechnungsalgorithmus: Die Akkumulation erfolgt direkt für den ausgewählten Zeitraum ohne Bezug auf den Tagesbeginn. Die letzten Balken können aus der Berechnung ausgeschlossen werden, dann haben die aktuellen Daten weniger Einfluss auf die vorher gebildeten signifikanten Niveaus (Volumina). Für eine genauere Berechnung werden standardmäßig Daten aus dem M1-Diagramm verwendet. Der Verteilungsschritt der Preismengen ist geregelt. Standardmäßi
35 USD
Follow The Line MT5
Oliver Gideon Amofa Appiah
4.23 (22)
This indicator obeys the popular maxim that: "THE TREND IS YOUR FRIEND" It paints a GREEN line for BUY and also paints a RED line for SELL. (you can change the colors). It gives alarms and alerts of all kinds. IT DOES NOT REPAINT and can be used for all currency pairs and timeframes. Yes, as easy and simple as that. Even a newbie can use it to make great and reliable trades. NB: For best results, get my other premium indicators for more powerful and reliable signals. Get them here: https://www.m
FREE
Dieser Z-Score Indikator zeigt den korrekten Z-Score eines Assets, da es die normierten (normal-verteilten) Preisdaten benutzt. Das ist der einzige Weg den Z-Score richtig zu berechnen. Der Z-Score darf nur basierend auf normal-verteilten Daten berechnet werden, deshalb wird für die Berechnung die normierten Returns benutzt, als normalverteilt angenommen werden. Die Berechnung des Z-Scores basierend nur auf dem Preis selbst ist nicht zulässig, da der Preis einer eher log-normal Verteilung folgt.
99 USD
Weis Waves
Flavio Jarabeck
3.3 (23)
The original author is David Weis, an expert in the Wyckoff Method. The Weis Wave is a modern adaptation of the 1930's Wyckoff Method, another expert in Tape Reading techniques and Chart Analysis. Weis Waves takes market volume and stacks it into waves according to price conditions giving the trader valuable insights about the market conditions. If you want to learn more about this subject you can find tons of videos in YouTube. Just look for "The Wickoff Method", "Weis Wave" and "Volume Spread
FREE
Bar Color Trend
Germano Chagas
4.5 (8)
Combining the best of Price Action , Directional Movement , and Divergence/Convergence analysis, Candle Color Trend is a easy and reliable way to identify trend direction. The indicator automatically paints the candles according to the assumption that an uptrend is defined by prices that form a series of higher highs and higher lows. In contrast, a downtrend is defined by prices that form a series of lower highs and lower lows. Additionally, ADX Wilder indicator is used to measure trend weakness
FREE
The best time to trade Using this Indicator is when the time reach exactly hour,half,45 minutes,15 minutes and sometimes 5 minutes.. This indicators is helpful to those who trade boom and crash indecies.How to read this indicator first you'll see Blue allow and Red allow all these allows used to indicate or to detect the spike which will happen so the allow happens soon before the spike happen.This indicator works properly only in boom and crash trading thing which you have to consider when
30 USD
FiboTrendMT5
Andrey Spiridonov
3 (4)
FibotrendMT5 is a powerful indicator from the set of professional trader. The indicator forms a short-term trend line and plots the Fibonacci grid. The trend line for a downtrend is formed based on the High prices of two previous candles, Low prices are used for an uptrend. The indicator should be attached in the usual way. It works on any timeframes from M1 to MN and with any currency pairs. Parameters TrendLineColors - color of the trend line (red by default) Tips on the Indicator Use Reco
FREE
Waves Sizer
Flavio Jarabeck
3 (2)
Wyckoff fans, enjoy! Ideally to be used with the Weis Waves indicator, but it can be easily used alone, the Waves Sizer puts the range (in resulting Price movement) done by the Price on its market swings. You can control how accurate or loose will be the swings. This tool is very helpful for visually know how much the Price has traveled in your Timeframe. This way you can confront this level of effort with the resulting Volume, etc... Weis Waves indicator: https://www.mql5.com/en/market/pro
FREE
A countdown timer for the  Volume bar chart generator  and  Tick chart generator  products, which are available for download from the MQL5 Market: Tick chart generator: https://www.mql5.com/en/market/product/29215 Volume bar chart generator: https://www.mql5.com/en/market/product/47197 The counter conveniently displays the number of ticks or transactions (depending on the chart) that need to pass for a new bar to start printing. The user can set the following indicator inputs. Volume type
FREE
Indicador de Volume
Edilson Domingos
4.5 (2)
Dieser Indikator ist ein Volumenindikator, der die Farbe der Kerzen entsprechend einer bestimmten Anzahl von Ticks ändert, und diese Anzahl von Ticks kann der Benutzer sowohl über die Anzahl der Ticks als auch über die Farbe der Kerzen informieren. Dieser Indikator funktioniert in jeder grafischen Zeit oder einen Vermögenswert, vorausgesetzt, der Vermögenswert verfügt über eine Tickernummer, über die informiert werden muss. Dieser Indikator soll dem Benutzer die Anzeige beim Analysieren von
FREE
Wave Box Market Frenquency
Jean Jacques Huve Ribeiro
4.75 (4)
Totally linked to the result of a movement and the duration he had. Its height records how many ticks the asset walked during a given movement, its width shows us the duration that movement had. Its configuration must be in line with the Weis Wave Indicator configuration to observe the movement force and can indicate a possible accumulation or distribution of the movement;
FREE
This indicator is the MACD (Moving Average Convergence/Divergence) supporting Virtual Trading mode of Knots Comparer . When the mode is turned on, the indicator will be recalculated based on the displayed candlesticks. When the mode is turned off, the indicator will be recalculated based on the original chart candlesticks. Types of the applied price: Close Open High Low Median Price (HL/2) Typical Price (HLC/3) Weighted Price (HLCC/4) KC-Indicators: KC-MA (Moving Average) KC-ENV (Envelopes) KC
FREE
Key level wedge MT5
Presley Annais Tatenda Mfck
The   Key level wedge MT5   indicator automatically draws rising wedge pattern and falling wedge pattern for you on the chart. This pattern is really good when used as a confirmation entry at key support & resistance, supply & demand and reversal zones. Advantages  The   Key level wedge MT5   block DOES NOT RE-PAINT, giving you confidence when a signal appears and also helps when looking back.  The   Key level wedge MT5   includes an on/off button on the chart to easily keep the charts cle
59 USD
Vwap Bar
Jean Jacques Huve Ribeiro
VWAP BAR  It´s power full indicator of candle by candle when lined up   with greate analysis, you have great opportunity, finder defense candle. Is a good ideia from order flow method, now your meta trader 5   inside you time frame chart .   What is the Volume Weighted Average Price (VWAP)? The volume weighted average price (VWAP) is a trading benchmark used by traders that gives the average price a security has traded at throughout the day, based on both volume and price. It is important
FREE
Käufer dieses Produkts erwarben auch
Dies ist ein Indikator für MT5, der genaue Signale für den Einstieg in einen Handel ohne Repainting (Neuzeichnen) liefert. Er kann auf alle Finanzwerte angewendet werden: Forex, Kryptowährungen, Metalle, Aktien, Indizes. Er liefert ziemlich genaue Schätzungen und sagt Ihnen, wann es am besten ist, eine Position zu eröffnen und zu schließen. Sehen Sie sich das Video (6:22) mit einem Beispiel für die Verarbeitung nur eines Signals an, das sich für den Indikator gelohnt hat! Die meisten Händler ver
125 USD
Advanced Supply Demand MT5
Bernhard Schweigert
4.36 (11)
Derzeit 33% Rabatt! Die beste Lösung für jeden Anfänger oder erfahrenen Händler! Dieser Indikator ist ein einzigartiges, qualitativ hochwertiges und erschwingliches Trading-Tool, da wir eine Reihe von proprietären Funktionen und eine neue Formel integriert haben. Mit diesem Update werden Sie in der Lage sein, doppelte Zeitrahmenzonen anzuzeigen. Sie können nicht nur einen höheren TF (Zeitrahmen) anzeigen, sondern sowohl den Chart-TF als auch den höheren TF: SHOWING NESTED ZONES. Alle Supply Dema
199 USD
Owl Smart Levels MT5
Sergey Ermolov
5 (1)
Indikator-Leitfaden  |  Owl Smart Levels-Strategie  |   MT4-Version  |  Wie installiert man?   |   FAQ Der Owl Smart Levels Indikator ist ein komplettes Handelssystem innerhalb eines Indikators, der so beliebte Marktanalysetools wie die fortschrittlichen Fraktale von Bill Williams , Valable ZigZag, das die richtige Wellenstruktur des Marktes aufbaut, und Fibonacci-Levels , die die genauen Einstiegslevels markieren, enthält in den Markt und Orte, um Gewinne mitzunehmen. Eine detaillierte Beschre
97 USD
Royal Wave Pro M5
Vahidreza Heidar Gholami
5 (2)
Royal Wave is a Trend-Power oscillator which has been programmed to locate and signal low-risk entry and exit zones. Its core algorithm statistically analyzes the market and generates trading signals for overbought, oversold and low volatile areas. By using a well-designed alerting system, this indicator makes it easier to make proper decisions regarding where to enter and where to exit trades. Features Trend-Power Algorithm Low risk Entry Zones and Exit Zones Predictions for Overbought and Over
129 USD
Matrix Arrow Indicator MT5
Juvenille Emperor Limited
5 (11)
Matrix Arrow Indicator MT5   ist ein einzigartiger 10-in-1-Trend, der zu   100 % nicht neu gezeichnet   werden kann. Multi-Timeframe-Indikator, der für alle Symbole/Instrumente verwendet werden kann:   Forex ,   Rohstoffe ,   Kryptowährungen ,   Indizes ,   Aktien .  Der  Matrix Arrow Indicator MT5  wird den aktuellen Trend in seinen frühen Stadien bestimmen und Informationen und Daten von bis zu 10 Standardindikatoren sammeln, die sind: Durchschnittlicher Richtungsbewegungsindex (ADX) Rohstoff
75 USD
Royal Scalping Indicator M5
Vahidreza Heidar Gholami
5 (8)
Royal Scalping Indicator is an advanced price adaptive indicator designed to generate high-quality trading signals. Built-in multi-timeframe and multi-currency capabilities make it even more powerful to have configurations based on different symbols and timeframes. This indicator is perfect for scalp trades as well as swing trades. Royal Scalping is not just an indicator, but a trading strategy itself. Features Price Adaptive Trend Detector Algorithm Multi-Timeframe and Multi-Currency Trend Low
149 USD
Blahtech Supply Demand MT5
Blahtech Limited
4.45 (11)
Supply Demand uses previous price action to identify potential imbalances between buyers and sellers. The key is to identify the better odds zones, not just the untouched ones. Blahtech Supply Demand indicator delivers functionality previously unavailable on any trading platform. This 4-in-1 indicator not only highlights the higher probability zones using a multi-criteria strength engine, but also combines it with multi-timeframe trend analysis, previously confirmed swings and engulfing detecto
142 USD
Stargogs Spike Catcher
Lorenzo Edward Beukes
5 (6)
Stargogs Spike Catcher V3 This Indicator is Developed To milk the BOOM and CRASH indices . Send me Message if you need any help with the indicator.  CHECK OUT THE STARGOGS SPIKE CATCHER EA/ROBOT V3: CLICK HERE ALSO CHECK OUT SECOND TO NONEFX SPIKE CATCHER:   CLICK HERE STARGOGS SPIKE CATCHER V3 WHATS NEW! Brand New Strategy. This is the Indicator you need for 2023. The Indicator Gives you an Entry at a time when conditions are met and you should use TP & SL. New Trendline that changes color in
100 USD
Automated Trendlines MT5
Georgios Kalomoiropoulos
Trendlinien sind das wichtigste Werkzeug der technischen Analyse im Devisenhandel. Leider zeichnen die meisten Händler sie nicht richtig. Der automatische Trendlinien-Indikator ist ein professionelles Tool für ernsthafte Trader, das Ihnen hilft, die Trendbewegung der Märkte zu visualisieren. Es gibt zwei Arten von Trendlinien Bullische Trendlinien und Bärische Trendlinien. Im Aufwärtstrend wird die Forex-Trendlinie durch die niedrigsten Swing-Punkte der Preisbewegung gezogen. Wenn man m
99 USD
Market Profile defines a number of day types that can help the trader to determine market behaviour. A key feature is the Value Area, representing the range of price action where 70% of trading took place. Understanding the Value Area can give traders valuable insight into market direction and establish the higher odds trade. It is an excellent addition to any system you may be using. Blahtech Limited presents their Market Profile indicator for the MetaTrader community. Inspired by Jim Dalton’s
142 USD
PZ Swing Trading MT5
PZ TRADING SLU
5 (4)
Swing Trading ist der erste Indikator, der Schwankungen in Trendrichtung und mögliche Umkehrschwankungen erkennt. Es wird der in der Handelsliteratur weit verbreitete Baseline-Swing-Trading-Ansatz verwendet. Der Indikator untersucht mehrere Preis- und Zeitvektoren, um die aggregierte Trendrichtung zu verfolgen und erkennt Situationen, in denen der Markt überverkauft oder überkauft ist und zur Korrektur bereit ist. [ Installationsanleitung | Update-Anleitung | Fehlerbehebung | FAQ | Alle Produkte
125 USD
Automatisierte Angebots- und Nachfragezonen der nächsten Generation. Neuer und innovativer Algorithmus, der bei jedem Diagramm funktioniert. Alle Zonen werden dynamisch entsprechend der Preisbewegung des Marktes erstellt. ZWEI ARTEN VON WARNUNGEN --> 1) WENN DER PREIS EINE ZONE ERREICHT 2) WENN EINE NEUE ZONE BILDET WIRD Sie erhalten keinen weiteren nutzlosen Indikator. Sie erhalten eine vollständige Handelsstrategie mit nachgewiesenen Ergebnissen.     Neue Eigenschaften:    
149 USD
Italo Volume Indicator MT5
Italo Santana Gomes
5 (9)
BUY INDICATOR AND GET EA FOR FREE AS A BONUS + SOME OTHER GIFTS! ITALO VOLUME INDICATOR  is the best volume indicator ever created, and why is that? The Indicator works on all time-frames and assets, indicator built after 6 years of experience on forex and many other markets. You know many volume indicators around the internet are not complete, does not help, and it's difficult to trade, but the Italo Volume Indicator is different , the Italo Volume Indicator shows the wave volume, when market
65 USD
PZ Trend Trading MT5
PZ TRADING SLU
3.67 (3)
Trend Trading ist ein Indikator, der so weit wie möglich von den Markttrends profitiert, indem er Pullbacks und Breakouts zeitlich festlegt. Sie findet Handelsmöglichkeiten, indem sie analysiert, was der Preis während etablierter Trends tut. [ Installationsanleitung | Update-Anleitung | Fehlerbehebung | FAQ | Alle Produkte ] Handeln Sie mit Zuversicht und Effizienz an den Finanzmärkten Profitieren Sie von etablierten Trends, ohne ins Wanken zu geraten Profitable Pullbacks, Ausbrüche und vor
125 USD
PZ Day Trading MT5
PZ TRADING SLU
2.6 (5)
Dieser Indikator erkennt Preisumkehrungen im Zick-Zack, wobei nur Preisaktionsanalysen und ein Donchian-Kanal verwendet werden. Es wurde speziell für den kurzfristigen Handel entwickelt, ohne dass ein Nachlackieren oder ein Backpainting erforderlich ist. Es ist ein fantastisches Werkzeug für clevere Trader, die darauf abzielen, das Timing ihrer Operationen zu verbessern. [ Installationsanleitung | Update-Anleitung | Fehlerbehebung | FAQ | Alle Produkte ] Erstaunlich einfach zu handeln Es bi
125 USD
Sind Sie es leid, Unterstützungs- und Widerstandslinien zu zeichnen? Der Unterstützungswiderstand ist ein Multi-Zeitrahmen-Indikator, der Unterstützungs- und Widerstandslinien mit einer sehr interessanten Wendung automatisch erkennt und zeichnet: Wenn das Preisniveau im Laufe der Zeit getestet wird und seine Bedeutung zunimmt, werden die Linien dicker und dunkler. [ Installationsanleitung | Update-Anleitung | Fehlerbehebung | FAQ | Alle Produkte ] Steigern Sie Ihre technische Analyse über Nacht
99 USD
God win spike system
Israr Hussain Shah
1 (1)
• Non Repaint • DelayNo Lag •Pop Up notification • 98% Verified Accuracy • Real time arrows to catch spikes at least 4-8 bars We forward guide video how milk spikes  We also add in telegram group for better quality help  +see live trading results  https://youtu.be/DCG4CAWlg4I you will see an arrow signal and open trade for spike stop-loss of trade will be 8 or 10 candles if no spike exit you just need to follow spike arrow signals and for more good results follow inst
200 USD
Divergenzen sind schwierig zu finden und seltener anzutreffen. Sie sind eines der zuverlässigsten Handelsszenarien. Dieser Indikator sucht automatisch mit Ihrem bevorzugten Oszillator nach regelmäßigen und versteckten Abweichungen. [ Installationsanleitung | Update-Anleitung | Fehlerbehebung | FAQ | Alle Produkte ] Einfach zu handeln Findet regelmäßige und versteckte Abweichungen Unterstützt viele bekannte Oszillatoren Implementiert Handelssignale basierend auf Ausbrüchen Zeigt geeignete
125 USD
Introduction to X3 Chart Pattern Scanner X3 Cherart Pattern Scanner is the non-repainting and non-lagging indicator detecting X3 chart patterns including Harmonic pattern, Elliott Wave pattern, X3 patterns, and Japanese Candlestick patterns. Historical patterns match with signal patterns. Hence, you can readily develop the solid trading strategy in your chart. More importantly, this superb pattern scanner can detect the optimal pattern of its kind. In addition, you can switch on and off individu
250 USD
Trade system "PAX Multi TMA/HMA 8" for MT5 it is a ready-made trading system for trading on any instrument and any timeframe. An experienced trader on one instrument can get a profit   from 100% to 400% per day . Completely ready for manual trading and use in robots. Not redrawn signals. It is convenient to work on any timeframe. Tested on metals, currency pairs, oil, international stocks, Russian stocks, cryptocurrencies, monetary and cryptocurrency indices. What the trading sy
144 USD
FIBO Trend PRO mt5
Evgenii Aksenov
5 (3)
The indicator allows you to instantly determine the current trend by color and FIBO levels. Higher Timeframe the panel shows the current trend of higher periods, helping to determine the strength of the trend. Trade according to the trend when changing the color of candles or trade against the trend when the price hit the extreme levels of the FIBO Trend PRO  indicator   Advantages of the FIBO Trend PRO Indicator never repaint and does not change their values Very easy to use and intuitive App
75 USD
Ultimate Supply Demand MT5
Ramon Sobrevals Arce
5 (2)
After working during many months, with the help of Neural Networks, we have perfected the ultimate tool you are going to need for identifying key price levels (Supports and Resistances) and Supply and Demand zones. Perfectly suitable to trigger your trades, set up your future actions, decide your Take Profit and Stop Loss levels, and confirm the market direction. Price will always move between those levels, bouncing or breaking; from one zone to another, all the remaining movements are just mark
79 USD
"AV Stop Hunter MT5" ist ein Indikator für MetaTrader 5, welcher Einstiegspfeile für Long und Short nach sogenannten Stop-Hunt-Kerzen zeichnet und über mehrere Benachrichtigungen darüber verfügt. Da es sich hier um ein Smart Money Konzept handelt, eignen sich die Perioden H1 und H4 am besten. NEU: Steigendes Volumen verstärkt das Signal, Linien und Pfeile sind dann dicker. Die MQL5 Variante hat farbige Stop-Hunting-Kerzen. Definition / Strategie: Als "Stop Hunting" wird bezeichnet, we
120 USD
TrendLine PRO MT5
Evgenii Aksenov
4.78 (50)
The Trend Line PRO indicator is an independent trading strategy. It shows the trend change, the entry point to the transaction, as well as automatically calculates three levels of Take Profit and Stop Loss protection Trend Line PRO is perfect for all Meta Trader symbols: currencies, metals, cryptocurrencies, stocks and indices Advantages of Trend Line PRO Never redraws its signals The possibility of using it as an independent strategy It has three automatic levels Take Profit and Stop Loss lev
75 USD
WAPV Full MT5
Eduardo Da Costa Custodio Santos
## Arbeiten Sie professionell mit WAPV Full und verfolgen Sie Wo ist das Geld der großen Spieler? Stellen Sie sich vor, Sie hätten ein Werkzeug in der Hand, das allein das Lesen übernimmt der wichtigsten Marktteilnehmer mit den besten Handelsregionen basierend auf Preis- und Volumenanalyse. WAPV Full ist ein komplettes Tool, das sich zu 100 % auf den Betrieb von R. Wyckoff konzentriert Neben der Abbildung von Marktbewegungen in Handelswellen werden auch Abbildungen erstellt den Markt, indem Sie
199 USD
Golden Hunter MT5
Rodrigo Arana Garcia
LETZTE KOPIE BEI ​​75 $ ---> Weiter: 99 $ !!!  MT4 Version Golden Hunter   wurde für Trader entwickelt, die manuell an den Märkten handeln. Es ist ein sehr leistungsfähiges Instrument, das aus 3 verschiedenen Indikatoren besteht: Leistungsstarke Einstiegsstrategie: Besteht aus einem Indikator, der die Volatilität des Währungspaares misst und den Markttrend identifiziert. LSMA: Glättet die Preisdaten und ist nützlich, um den kurzfristigen Trend zu erkennen. Heikin Ashi: Sobald der Indikator an
75 USD
Offer 249 down from 350 for the next 3 copies. then back to 350 $ Are you tired of using outdated indicators that leave you guessing where to set your profit targets? Look no further than the AK CAP Opening Range Breakout Indicator. This powerful tool is backed by a US patent and has already helped countless traders pass funded challenges like FTMO. We use it daily on our prop traders and internal funds, and now it's available to you as well. The calculation behind the indicator is incredibly
249 USD
Introduction Harmonic Patterns are best used to predict potential turning point. Traditionally, Harmonic Pattern was identified manually connecting peaks and troughs points in the chart. Manual harmonic pattern detection is painfully tedious and not suitable for everyone. You are often exposed under subjective pattern identification with manual pattern detection. To avoid these limitations, Harmonic Pattern Plus was designed to automate your harmonic pattern detection process. The functionality
98 USD
Wolfe Waves sind natürlich vorkommende Handelsmuster, die an allen Finanzmärkten vorhanden sind und einen Kampf um einen Gleichgewichtspreis darstellen. Diese Muster können sich über kurze und lange Zeiträume entwickeln und sind eines der zuverlässigsten prädiktiven Umkehrmuster, die es gibt und die normalerweise starken und langen Kursbewegungen vorausgehen. [ Installationsanleitung | Update-Anleitung | Fehlerbehebung | FAQ | Alle Produkte ] Klare Handelssignale Erstaunlich einfach zu handeln
99 USD
VTrende Pro
Andrey Dyachenko
VTrende Pro - MTF indicator for trend trading with a display panel for MT5 *** Videos can be translated into any language using subtitles (video language - Russian) Although the signals of the VTrende Pro indicator can be used as signals of a full-fledged trading system, it is recommended to use them in conjunction with the Bill Williams TS. VTrende Pro is an extended version of the VTrende indicator. Difference between Pro version and VTrende: - Time zones - Signal V - signal 1-2 waves
697 USD
Weitere Produkte dieses Autors
ICT, SMC, SMART MONEY CONCEPTS, SMART MONEY, Smart Money Concept, Support and Resistance, Trend Analysis, Price Action, Market Structure, Order Blocks, BOS/CHoCH,   Momentum Shift, HH/LL/HL/LH,    Fair Value Gap, FVG,  Premium  &   Discount   Zones, Fibonacci Retracement, OTE, Buy Side Liquidity, Sell Side Liquidity, BSL/SSL Taken, Equal Highs & Lows, MTF Dashboard, Multiple Time Frame, BigBar, HTF OB, HTF Market Structure,  Liquidity Voids, Long Wicks, Candle Timer, Fractals, ZigZag, Time Zone,
63 USD
Trade History for MT4  This indicator is specially developed for that traders want to display his trades on the charts. Shows history and current deals on the chart. Trades show on the chart with a dotted line, and profit will show realtime. Buy trades are displayed in bull color, Sell trades in bear color. Tip: The historical order displayed by the indicator is associated with the "Account History", so please set the historical order display in the "Account History" of MT software. If yo
FREE
Auswahl:
Sergey Gubenko
160
Sergey Gubenko 2023.03.31 08:51 
 

Good afternoon Jing Bo Wu, thank you very much for the indicator.

Sebastian Schmidt
891
Sebastian Schmidt 2023.03.31 06:53 
 

unbeatable price - performance ratio, for beginners and advanced traders with this indicator you learn something for life many thanks for the good work and the fair price.

difuzor102
104
difuzor102 2023.03.30 18:00 
 

Очень, очень хороший инструмент, лучшее из того что я видел для "SMC"!!! Еще бы мультивалютный сканер к этому индикатору, что бы показывал "CHOCH" во вложенных блоках заказов, я бы такой с удовольствием купил. Спасибо автору за труд!!!

phenphen
30
phenphen 2023.03.24 06:35 
 

It's the best indicator I've ever had, be patient till graph hit DZ/SZ.

cavayiro
559
cavayiro 2023.03.23 10:52 
 

GREAT INDICATOR and perfect communication with the programmer

Jeditraderz
36
Jeditraderz 2023.03.22 17:34 
 

I'm new to SMC and still learning it but this indicator is the best thing you can buy to improve your SMC knowledge and skills kudos to the Jing Bo Wu! Great thing is that he continues to update the indicator,happy costumer here!

Nenad_2010
261
Nenad_2010 2023.03.22 16:59 
 

Excellent job.

marcdjcooper
69
marcdjcooper 2023.03.22 01:01 
 

Fantastic indicator, and continually updated. Good job!

Ohima
19
Ohima 2023.03.21 16:34 
 

Best indicator i ever used worth the money

Ruhail Ashraf Khan
601
Ruhail Ashraf Khan 2023.03.18 21:15 
 

Mr.Jing Bo Wu this is wonderful work.

multinat
181
multinat 2023.03.13 19:17 
 

Excellent work. This tool has no equal. Not even on Tradingview. Thank-you

DNkRockzzzzZ
36
DNkRockzzzzZ 2023.03.11 17:29 
 

Good job. Thanks to your Indicator I can cancel my Tradingview plan. Was using the Lux Smart Money Concepts Indicator.

Jean Sarkissian
169
Jean Sarkissian 2023.03.10 16:36 
 

Wow man ! Very great work ! I just bought it, really clean, a LOTof settings, OB threshold and so much more ! Thank you for that great work of yours ! I recommend this to any ICT/SMC trader out there looking for an assistant in drawing liquidity, mitigated ob's and non-mitigated, it even has premium/discount zones of last swing move & autofibo of last swing too. Couldn't do better !! thank you, it's going to help see thing you sometimes don't see easily in MT !

tobol
247
tobol 2023.03.04 08:00 
 

Приобрёл индикатор 14.03.2023. К сожалению фибо уровни остаются на графике после их запрета в индикаторе?

Jing Bo Wu
2910
Antwort vom Entwickler Jing Bo Wu 2023.03.04 13:05
Пожалуйста, дайте мне скриншот.
Anton K
49
Anton K 2023.03.03 15:14 
 

This is the best indicator I've worked with! The author is simply the best! Thanks!

leonardcastro
30
leonardcastro 2023.03.01 18:42 
 

Hello, I have recently purchased the indicator, do you have a manual or guide on the information that the indicator has and how it can be configured? Also, could you give me the guide on how to operate with smart money concept? thank you

VinS
262
VinS 2023.03.01 14:45 
 

This indicator is pure gold if you trade ICT's SMC like me. It accurately identifies areas of price action, I just have to focus and be disciplined to wait for my setup. Jing is also attentive to requests and works hard to constantly improve the tool. 5 stars is mandatory.

Jing Bo Wu
2910
Antwort vom Entwickler Jing Bo Wu 2023.03.01 14:53
Thanks, VinS, you are so kind, wish you more success in your trading career.
blaznking01
194
blaznking01 2023.02.23 00:34 
 

Every update gets better and better. Highly recommended.

Jing Bo Wu
2910
Antwort vom Entwickler Jing Bo Wu 2023.02.27 05:52
Thank you blaznking01.
Yocrz
269
Yocrz 2023.02.22 02:11 
 

I payment for smc trading other on mql5. Almost it very bad not work. If you understand smc system. This is great tool for smc trading. I like it.

Jing Bo Wu
2910
Antwort vom Entwickler Jing Bo Wu 2023.02.22 09:12
Thank you Yocrz.
Lizette Brooks
113
Lizette Brooks 2023.02.21 18:43 
 

Very good indicator!! Helps me a lot

Jing Bo Wu
2910
Antwort vom Entwickler Jing Bo Wu 2023.02.22 09:12
Thanks, Lizette Brooks.
12
Antwort auf eine Rezension
Version 7.6 2023.03.31
Fix MTF Dashboard bugs(Sorry, this feature has caused a lot of bugs).
Version 7.5 2023.03.30
Add function for MTF Dashboard to display the number of consecutive BOS/iBOS occurrences.
Version 7.4 2023.03.30
Add option to change the style of the OB mean threshold.
Add FVG threshold for the users to filter out those too small and insignificant.
Rewrite the fractal point algorithm.
Fix some bugs.
Version 7.3 2023.03.29
Fix bug when setting True only for the Fibo OTE.
Version 7.2 2023.03.29
Fix the problem of FIBO repeatedly drawing lines.
Version 7.1 2023.03.28
Add Fibo levels for OTE and Profit target, the user can manually adjust the Fibo high and low points.
Version 7.0 2023.03.27
fix MTF Dashboard bug.
Version 6.9 2023.03.27
Add MTF Dashboard function.
Version 6.8 2023.03.24
Add HTF Premium&Discount Zone.
Add Option to extend NWOG/NDOG to current candle.
Version 6.7 2023.03.23
Add Options for internal structure and swing structures, user can set the label text size and line width.
Version 6.6 2023.03.23
Change the style of OB mean threshold.
Version 6.5 2023.03.22
Add Option to Time Zone / Asian Range / NWOG / NDOG, The user can set to display only the latest few results to avoid cluttering CHART with all of them displayed.
Version 6.4 2023.03.22
Fixed spelling errors in the settings panel.
Improved NWOG/NDOG algorithm.
Version 6.3 2023.03.22
Fix Trend Candle color setting bug.

Add HTF Strong/Weak High/Low
Version 6.2 2023.03.21
Add NWOG/NDOG function
Version 6.1 2023.03.20
Add Fractal Points & ZigZag Line
Version 6.0 2023.03.20
Add NY Midnight open line
Version 5.9 2023.03.19
Version 5.9

Add options for HTF OB style
Add options for Aisan Range
Version 5.8 2023.03.18
Version 5.8

Optimize Time Zone Function.
Add Asia Range function for day trade.
Version 5.7 2023.03.13
Version 5.7

Add HTF OB iOB function
Version 5.6 2023.03.12
Version 5.6

Add Continue to improve HTF functions.
Version 5.5 2023.03.11
Version 5.5

Add High Timeframe Structure ability.

BigBar, HTF iBOS, HTF BOS, HTF iCHoCH, HTF CHoCH
Version 5.3 2023.03.07
Version 5.3

Add Previous Day High/Low Price touch detect.
Input parameters verification.
Optimize some codes to make the indicator calculation faster.
Version 5.2 2023.03.06
Version 5.2

Update Time Zone algorithm
Version 5.1 2023.03.04
Version 5.1

Optimizing Candle Timer, not display the error countdown when there is no market data.
Version 5.0 2023.03.03
Version 4.9.1

Fix Candle Timer bug
Version 4.9 2023.03.03
Version 4.9

Optimize Time Zone and Candle Timer
Version 4.8 2023.03.02
Version 4.8

Add Candle Timer
Add Time Zone
Version 4.7 2023.03.01
Version 4.7

Add Liquidity Voids Detect
Version 4.6 2023.02.28
Version 4.6

Add Alerts to Email function
Version 4.5 2023.02.28
Version 4.5

Add FVG Touch alert
Version 4.4 2023.02.27
Version 4.4

Add Display full Fibo Levels Option
Version 4.3 2023.02.27
Version 4.3

Add FVG Extend Option: FVG extend to the current candle
Version 4.2 2023.02.25
Version 4.2

Add BSL/SSL Taken Alert
Version 4.1 2023.02.24
Version 4.1

fix BSL/SSL Taken bug
Version 4.0 2023.02.24
Version 4.0

Add BSL/SSL Taken Detect
Version 3.9 2023.02.22
Version 3.9

Add Fibonacci Retracement
Version 3.8 2023.02.20
Version 3.8

Fix bug of CHoCH BOS label text display options
Version 3.7 2023.02.20
Version 3.7

Add CHoCH BOS label text display options
Version 3.6 2023.02.20
Version 3.6
Add Alert when LW formed
Add Alert when LW filled
Add LW display options for filled
Version 3.5 2023.02.19
Version 3.5

Add Long Wicks detect function

Optimize OB mean threshold display
Version 3.4 2023.02.19
Version 3.4

Add OB iOB touch Alert
OB mean threshold and FVG Consequent Encroachment color Options
Version 3.3 2023.02.18
Version 3.3

Add OB mean threshold
Add FVG mean threshold
Version 3.2 2023.02.18
Version 3.2

Add Previous Day Open/Close
More concise OB display
Version 3.1 2023.02.15
Version 3.1

Optimize code
Version 3.0 2023.02.13
Version 3.0

Optimize code
Optimize FVG functions and support high timeframe FVG
Version 2.8 2023.02.12
FVG filled and FVG formed detect without delay.

Fixed some bugs
Version 2.7 2023.02.10
Version 2.7

Set alerts for BOS OB CHOCH etc separately
Support setting to send Alert to mobile devices.
Version 2.6 2023.02.09
Version 2.6
Version 2.5 2023.02.09
Version 2.5
Version 2.4 2023.02.08
Version 2.4

Fix Trend Candles bug
Version 2.3 2023.02.08
Version 2.3

Draw Candles by Trend
Previous day/week/monthly high/low
Version 2.2 2023.02.08
version 2.2

Modify Premium & Discount Zones
Version 2.1 2023.02.07
version 2.1

fix bug
Version 2.0 2023.02.07
version 2.0

Modify Fair Value Gap Detection
Version 1.3 2023.02.05
version 1.3

fix alert bug
Version 1.2 2023.02.03
version 1.2

EQH/EQL bug fix
add Alert function
Version 1.1 2023.02.03
version 1.0.1 :

fix bug