Night Crawler
- インディケータ
- バージョン: 1.0
- アクティベーション: 5
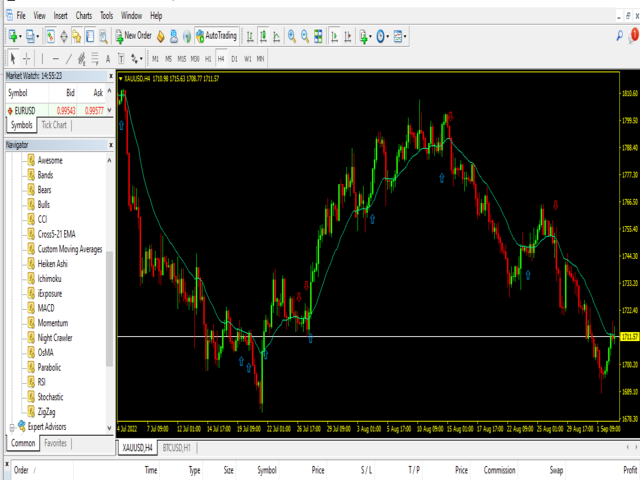
Night Crawler is a moving average trend trading strategy and delivers over 89 to 90% wining ratio when applied and traded properly.
It work for all Timeframe and for every currency pairs trading on the MQL4 Platform.
To have a clear trend bias of the market Apply EMA 50 and EMA 21 to your chat to get the best out of this strategy for your overall Trend View.
The Best Timefarme to use is H1 or H4
ENTRY RULES :
For Buy trades :
1. Wait for EMA 21 to Cross Above 50
2. When the arrow (Blue) appears , Buy after the candle close without hesitation.
3. Place the SL below the arrow.
4. As soon price moves 20pips in your favour , move Sl to breakeven.
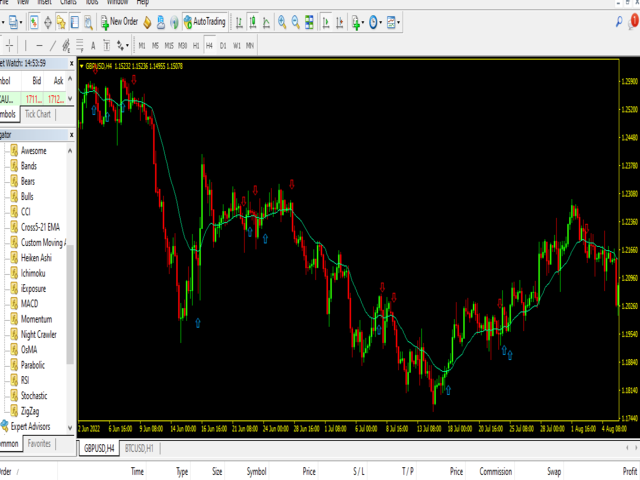
For Sell trades :
1. Wait for EMA 21 to Cross Below 50
2. When the arrow (Red) appears , Sell After the candle close without hesitation.
3. Place the SL Above the arrow.
4. As soon price moves 20pips in your favour , move Sl to breakeven.
To your Success............... Kmadu