Gold Scalping Pro Signal

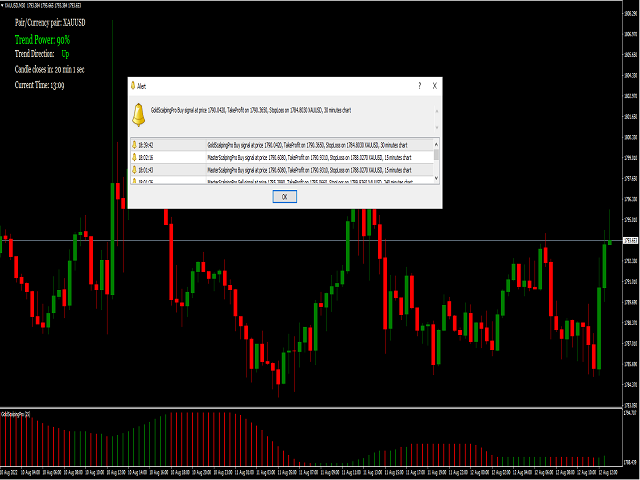
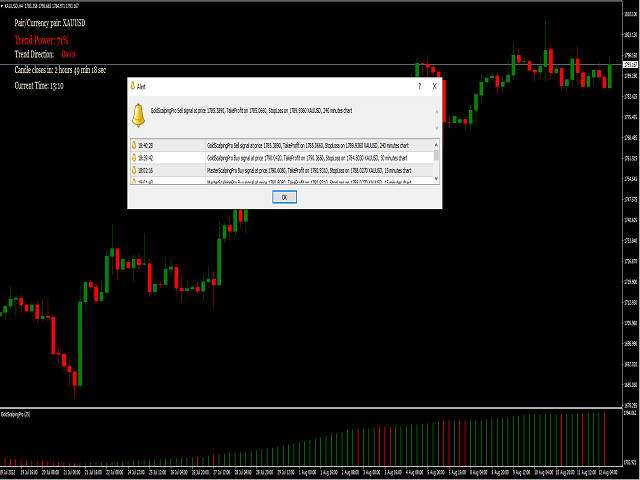
Gold Scalping Pro Signal Indicator

Pairs : XAUUSD, XAGUSD, Crude OIL , BTCUSD, ETHUSD, EURUSD, GBPUSD, USDJPY, AUDUSD, USDCHF, GBPJPY

Setting : Once Market Are Up And Down Side , The Indicator Are Provide Buy And Sell Order Push Notification

Time Frame - 5 Mins, 15 Mins, 1 Hour, 4 Hour

Additional : You Have Also Trade Manual , Once Trend Power Is Up , Enter Buy  Or Trend Power is Down, Enter Sell 


おすすめのプロダクト
Pirate
Anatoliy Lukanin
3.9 (20)
Deposit :   from 100 deposit units Trading pairs: I recommend currency pairs: EURAUD, CHFJPY, EURCHF, EURGBP, AUDCHF, CADCHF, USDCHF. Trading period :  Any Account: You should use ECN-ECN.Pro accounts with five-digit quotes with a moderate size (spread). Parameters: USING - Choice, trading risk or fixed lot RISK/LOT - Lot Risk Value RESTORING_THE_BALANCE - Restoring balance* HOW_THE_RESET_WINDOW - Reset the Global Variable TAKE_PROFIT - Set profit STOP_LOSS - Set loss COUNT_BUY - The number of s
ギャラクティックボリュームスプレッド分析(VSA)は、ボリュームを視覚化するために設計されたインジケーターであり、異なるペアのスプレッドのボラティリティに影響する割合です。 戦略は以下から構成されます。 ブルトレンド: 常にトレンドに賛成し、Galactic VSAインディケーターによって示される高ボリュームと一致する限り、トレンドの低価格でのオープン購入オペレーション。 下降トレンド: 常にトレンドに賛成し、トレンドの高値でオープンな営業活動を行います。ただし、Galactic VSAインディケーターによって示される高ボリュームと一致します。 優先ペア: EURUSD、GBPUSD、USDJPY H1未満の時間枠を推奨するのではなく、スイング取引でインジケーターをテストしました。 
Free informative Indicator-helper. It'll be usefull for traders who trade many symbols or using grid systems (Averaging or Martingale). Indicator counts drawdown as percent and currency separate. It has a number of settings: Count deposite drawdown according equity value and send e-mail or notifications to user if DD more than set; Sending e-mail when max open orders reached; Shows price and remaining pips amount before MarginCall on current chart and Account generally; Display summary trade lot
FREE
BinaryUniversal is a signal indicator for binary options and Forex. In its work, the indicator uses a complex algorithm for generating signals. Before forming a signal, the indicator analyzes volatility, candlestick patterns, important support and resistance levels. The indicator has the ability to adjust the accuracy of the signals, which makes it possible to apply this indicator for both aggressive and conservative trading. The indicator is set in the usual way, it works on any time period and
Golden Key是一款完全自动化的智能交易系统, 采用 独家专利的行情相位识别技术,并 深度融合了 精妙的价格行为分析与专为黄金市场定制的神经网络。 该系统 内置3种不同模式的交易策略,当你拥有了 Golden Key, 相 当于你同时拥有了3款不同的交易系统 ,你可以根据自己的交易风格和风险偏好,选择适合自己的策略。 近年来,我们倾尽全力,反复雕琢Golden Key的每一个细节,直至确信它能完美地适应市场的变化。Golden Key绝非普通交易助手,它是无数个日夜深耕黄金市场、洞悉其律动,以及创新研发独家算法的集大成者。 交易对象: XAUUSD(GOLD) 时间范围: 任意时间范围 适合人群: ️ 希望自动化交易黄金的上班族 ️ 寻求对冲手工交易风险的职业交易员 ️ 机构资金管理人(支持千万级资金量) 核心策略: 趋势追踪模式  采用自主训练的多时间框架趋势模型 每个订单都自动设有止损止盈,不带有任何高风险交易 追踪止损止盈算法:固态点数正止损和动态ATR止损止盈相结合 建议起始资金不低于$500 实时信号: Golden Key Classic 智能网格
Market Profile 3
Hussien Abdeltwab Hussien Ryad
3 (2)
Market Profile 3 MetaTrader 4 indicator  — is a classic Market Profile implementation that can show the price density over time, outlining the most important price levels, value area, and control value of a given trading session. This indicator can be attached to timeframes between M1 and D1 and will show the Market Profile for daily, weekly, monthly, or even intraday sessions. Lower timeframes offer higher precision. Higher timeframes are recommended for better visibility. It is also possible t
FREE
Max LotSize
Luis Alberto Atuncar Sanchez
5 (2)
LotSize Indicator Discover the appropriate lot size to use in your trades based on the available margin. This indicator provides valuable information for risk management. If the indicator shows a value of 0, it means that your balance or available margin is insufficient for trading. It is important to maintain adequate margin levels for safe trading practices. This indicator is exclusively designed for the MT4 platform, a popular and reliable trading platform in the market. With the LotSize Indi
FREE
Koala Supply Demand
Ashkan Hazegh Nikrou
5 (2)
MetaTrader 4 の Koala Supply Demand Indicator をご紹介します (他のトレーダーがあなたの経験から恩恵を受けられるように、肯定的なものでも否定的なものでも、レビューやフィードバックを共有することをお勧めします)。 Koala Supply Demandインジケーターへようこそ。このインジケーターは連続したサプライとデマンドゾーンを特定するために設計されています。このインジケーターはトレーダーが市場をゾーンエリアとして表示できるようにし、いくつかの強力なゾーンがどのように価格を尊重しているかを見るのに役立ちます。このインジケーターはまた、ゾーン内で形成されたときに価格アクションのシグナルを表示することもできます。 Koala Trading Solutionチャンネル で最新のKoala製品に関する最新情報を入手するために、mql5コミュニティに参加してください。参加リンクは以下です: https://www.mql5.com/en/channels/koalatradingsolution https://www.mql5.com/en/bl
FREE
AI Driven Forex Trading Signal Indicator MT4 This advanced MT4 indicator leverages artificial intelligence to identify high-probability market reversal points with up to 90% accuracy. Designed for traders who demand precision, it analyzes price action in real time and highlights optimal entry opportunities for both buy and sell trades. Suitable for all major Forex pairs and timeframes, this tool is ideal for intraday and swing trading strategies. Key Features: AI-powered reversal detection Clear
Sharp Scalper
Mazin Salim Said Ba Abbad
The “Sharp Scalper” indicator is high-frequency trading tool designed for quick, short term trades in the forex market. It focus on identifying rapid price movement and generating signals for best entry. This indicator is known for its ability to capture small profit opportunities multiple times throughout the day making it ideal for scalpers looking to capitalize on market volatility. The” sharp scalper” indicator employs advance algorithms to detect market trends and fluctuation, helping trade
This indicator displays in a separate window the difference between the number of points which increased the price, and the number of points that decreased the price during the time interval specified in the settings. The time interval for calculation is expressed as the number of bars of the chart the indicator is attached to. This approach allows you to evaluate the movement direction (growth or fall) of the instrument's price, the strength of the movement and the size of the movement in point
This indicator is designed for scalping on low timeframes (M1-M15) in volatile markets like major forex pairs (e.g., EURUSD, GBPUSD). It generates non-repainting buy (green up arrow) and sell (red down arrow) signals based on EMA crossover confirmed by RSI momentum and MACD crossovers, minimizing false signals in ranging markets. How to Use: Attach the indicator to your MT4 chart. Look for arrows on the chart: Buy on green up arrow, Sell on red down arrow. Signals appear at the open of the new
This is the complete REX package. It consists of the lite, pro and ULTRA version.  Perfect for beginners and intermediates. REX complete is 100% non repaint. The strategy is based on a mix of different strategies, statistics, including pivot points, oscillators and patterns.  As the trading idea consists of a variety of some classic indicators like Momentum, Williams Percent Range, CCI, Force Index, WPR, DeMarker, CCI, RSI and Stochastic, it is clear that the fundamental indicators have being u
Простое визуальное и эффективное обнаружение тренда.Сигнал поступает на " закрытой свече  ".Работает на всех символах и таймфреймах.Индикатор не использует входных параметров.Все алгоритмы для расчета заложены в код.Индикатор может использовать для разработки советников.Изменение цвета индикатора,характеризует поведение рынка.Зеленый цвет сигнализирует восходящее движение.Красный цвет сигнализирует о нисходящем движении.Желтый цвет показывает флет.Желаю всем удачной торговли!!!
価格グリッドナビゲーターインジケーター 価格グリッドナビゲーターは、トレーダーが主要なサポートレベルとレジスタンスレベルを動的に特定できるように設計された、強力で直感的な取引ツールです。潜在的なエントリーポイント、エグジットポイント、そして反転ゾーンを明確に視覚的に表示するため、経験レベルを問わずトレーダーにとって不可欠なツールとなっています。これらのレベルを動的に計算・描画することで、このインジケーターは潜在的なエントリーポイント、エグジットポイント、そして反転ゾーンを明確に視覚的に表示します。外国為替、指数、コモディティなど、どのような取引でも、このツールは動的な原則の適用を簡素化し、正確かつ自信を持って情報に基づいた取引判断を下せるよう支援します。 メリットと機能 1. 正確なサポートレベルとレジスタンスレベル: このインジケーターは、現在の価格帯に基づいて主要な価格レベルを動的に計算・描画することで、正確性と関連性を確保します。 2. カスタマイズ可能な期間: Pパラメーターを使用すると、最高値と最安値を計算する期間を調整できるため、さまざまな取引スタイルや時間枠に適応で
FREE
MAXLUM SYSTEM is a Trading System that uses anti-Margin Call without using SL with a positive correlation Hedging Strategy Simple example of BUY on EURUSD and SELL on GBPUSD at the same time This kind of trading will not occur as a Margin Call By calculating the GAP difference between the 2 pairs we can take advantage of the GAP This indicator will be more effective if you use Data Analysis download excel file on telegram Group Please join the Maxlum System Telegram group for details t.me/max
Smart FVG インジケーター MT4 – MetaTrader 4 向け高度なフェアバリューギャップ検出 Smart FVG インジケーター MT4 は、MetaTrader 4 上で Fair Value Gap(FVG)をプロフェッショナルレベルで検出・監視し、アラートまで行うツールです。ATR ベースのフィルタリングと相場構造を考慮したロジックを組み合わせることで、ノイズを取り除き、流動性に応じて適応し、本当に重要な不均衡だけを残して精度の高い判断をサポートします。 主な特長 正確な FVG 検出:単なるローソク足のギャップではなく、市場の本質的な非効率を捉えます。 ATR ベースの精度:市場や時間軸が変わっても、低品質なシグナルを自動的にフィルタリング。 有効性のリアルタイム追跡:価格がゾーンを埋める/ブレイクすると、ゾーンが自動で延長・調整・削除されます。 カスタマイズ可能な表示:色・ラインスタイル・塗りつぶしを自由に設定し、どんなテンプレートにも合わせられます。 実用的なアラート:新規 FVG や、埋められた/無効化されたゾーンをリアルタイム通知。 パフォーマンス
FREE
This advisor enters the market at the opening of   London Market . It has a automatic function that give buy (arrow up green) and sell (arrow down red) signal when the indicator met high probabilities requirements.Once the signal is generated it is the trader discretions to start the order button and do trade manually. Stop loss are base on ATR. Recommended Take profit is 20pips.  The trading system is suitable for both experienced traders and beginners.  Timeframe is  M5 . Minimum account bal
FFx Bulls Power
Eric Venturi-Bloxs
3.67 (3)
The purpose of this new version of the MT4 standard indicator provided in your platform is to display in a sub-window multiple timeframes of the same indicator. See the example shown in the picture below. But the display isn’t like a simple MTF indicator. This is the real display of the indicator on its timeframe. Here's the options available in the FFx indicator: Select the timeframes to be displayed (M1 to Monthly) Define the width (number of bars) for each timeframe box Alert pop up/sound/ema
FREE
BinaryScalping is a professional indicator for trading binary options and scalping. The algorithm of the indicator is based on the calculation of pivot points for each time period separately, the location of the price of the trading instrument relative to the pivot points is analyzed and the probability of a trading operation is calculated. The indicator has a built-in filter of trading signals based on the global trend. The indicator is installed in the usual way and works with any trading inst
Mr Beast Sniper
Luis Mariano Vazquez Marcos
Asesor Experto "Sniper FX": Precisión Milimétrica para Tus Operaciones El asesor experto "Sniper FX" redefine la precisión en el trading automatizado al ofrecer un enfoque estratégico centrado en pocas, pero extraordinariamente precisas, entradas en el mercado. Inspirado por la agudeza de un francotirador, este asesor experto utiliza algoritmos avanzados para identificar oportunidades óptimas de compra y venta, maximizando el potencial de beneficios mientras minimiza la exposición al mercado.
FREE
Basic Theme Builder
Mehran Sepah Mansoor
5 (1)
Basic Theme Builder: チャートカスタマイズを簡単に Basic Theme Builder   インジケーターで、MetaTrader 4     のチャート外観のカスタマイズをシンプルに変革しましょう。この直感的なインジケーターは、使いやすいパネルを提供し、さまざまなテーマやカラースキームを簡単に切り替えることができます。これにより、取引環境の視覚的な魅力と機能性が向上します。 Free MT5 version Basic Theme Builder   インジケーターは、MetaTrader 4 のチャートを簡単にパーソナライズしたいトレーダーに最適なツールです。シンプルなパネルインターフェースとさまざまなテーマプリセットを使用して、取引スタイルや気分に合わせてチャートの外観をすぐに調整できます。クラシックなルックからモダンな美学まで、多彩なオプションを提供する   Basic Theme Builder   で、視覚体験を最適化しましょう。 主な機能: 簡単なテーマ管理:   便利なパネルインターフェースを使用して、ワンクリックでチャートのテーマを素早く変更
FREE
YOU CAN NOW DOWNLOAD FREE VERSIONS OF OUR PAID INDICATORS . IT'S OUR WAY OF GIVING BACK TO THE COMMUNITY ! >>>    GO HERE TO DOWNLOAD   The system is a free open source pine script originally published on TradingView by everget   . It was converted to Mt4 by Forex Robot Makers. This system is a  popular trend indicator based on ATR ( Average True Range ) , Moving Averages and the Donchian channel . System BackGround ATR The average true range is an indicator of the price volatility of an asse
FREE
ReboltP
David Theodore Caro-greene
リバランスオーバーレイテクノロジー(Rebolt)を使用すると、トレーダーは、あるチャートから別のチャートへのお金の流れを視覚化できます。 Rebolt Probabilityは、ユーザーが指定した間隔で、指定された期間、あるチャートから別のチャートにお金が流れた確率を示します。 ReboltがCyanまたはBlueを読み取る場合、これらはユーザーが指定した時間の間、または競合する信号が発生するまでの間、適切なサインを購入しています。 ReboltがVioletまたはRedを読み取ると、ユーザーが指定した時間の間、または競合する信号が発生するまでの間、売りの兆候が見られます。 Reboltは、価格変化の推定値(Rebolt Delta)、予想価格変化あたりの推定ドル値(Rebolt Delta $)、および予想される変化がチャートに追加または減算されて、将来の予想価格を表すオーバーレイとしても公開されます( Rebolt Overlay)。
Discover the power of precision and efficiency in your trading with the " Super Auto Fibonacci " MT4 indicator. This cutting-edge tool is meticulously designed to enhance your technical analysis, providing you with invaluable insights to make informed trading decisions. Key Features: Automated Fibonacci Analysis: Say goodbye to the hassle of manual Fibonacci retracement and extension drawing. "Super Auto Fibonacci" instantly identifies and plots Fibonacci levels on your MT4 chart, saving you tim
FREE
El indicador "MR BEAST PATTERNS WITH ALERTS" es una herramienta avanzada diseñada para identificar y notificar automáticamente patrones de oportunidad en el mercado financiero. Basándose en una combinación de análisis técnico y algoritmos inteligentes, este indicador escanea constantemente el gráfico en busca de patrones específicos que podrían indicar momentos propicios para la toma de decisiones. Características Principales: Detección de Patrones: El indicador identifica patrones de oportunida
Sentinel Power follow trend. Color change trend changed. Works in USDTRY/EURTRY/GOLD/SILVER/EURUSD/EURJPY/GBPUSD/EURGBP/GBPJPY/AUDJPY/AUDUSD/AUDCAD/US500/JP225 and all pairs Best timeframes 5M/15M/1H/4H/DAILY Signal on close of a bar. DOES NOT repaint. DOES NOT repaint. DOES NOT repaint. DOES NOT repaint. DOES NOT recalculate. DOES NOT recalculate. DOES NOT recalculate. DOES NOT recalculate Settings EmailOn : true/false  PushNotificationOn : true/false  SoundOn : true/false 
CCI Currency Strength Meter uses CCI (Commodity Channel Index) to monitor how strong a currency is, or in other words, if it's being bought or sold by the majority compared to the other currencies. If you load this indicator on a chart, it will first display the strength-lines of the currencies (base and counter currency of the chart) with changeable solid lines. Also, you can add up to five additional currencies to the "comparison pool," that already has the base and the profit (counter) curren
リアル口座での実際の運用成績はこちら: https://www.mql5.com/en/signals/2346679 この口座は 2025年12月2日に開設しました 。 ここからどのように成長していくのか、ぜひ楽しみに見守ってください。 商品説明文 本EAは 過剰なバックテストのフィッティングを行っていません。 長期的に安定して動くこと、そして「現実的な運用」を最優先に設計しています。 また、 預金をただ眠らせたままにしておくのはもったいない という考えから開発を始めました。 ロットを無理に上げる必要はありません。 むしろ ロットを上げすぎないことが最も大切 です。 このEAを導入してから、 毎日MT4を見てドキドキしながら過ごす時間がなくなりました。 必要以上にチャートに張り付かず、 淡々とした運用ができるようになったことを実感しています。   Gold Impulse Split — 製品説明 トレーダーの皆さま、こんにちは。私は Gold Impulse Split です。 リリース特別キャンペーン — 1か月お試しレンタル:$30 期間限定で、 Gold
EA Scalping Expert
Gerard Valldosera Gomez
3 (1)
This is a fully automated scalping Expert Advisor that can be run successfully using EURUSD currency pair at H1 timeframe. This EA can't run in the same account. If you want an Expert Advisor that trades daily this is not because it requires patience to wait for a few days or weeks on the right opportunity for it to trade. It takes advantage of the volatility of the price movement.
FREE
このプロダクトを購入した人は以下も購入しています
BinaryIndicator is a highly accurate indicator for trading binary options. It shows excellent results in scalping. This indicator is based in multifactor analysis of trend indicators, as well as confirmation oscillators, which in the end gives an increased accuracy of signals. Advantages of the indicator Increased accuracy of signals. Excellent results when trading binary options with a short expiration time from M30 to M1 . It works on any timeframes. Works with any trade symbols. Parameters
Rtc ML Ai | Predictor CORE MACHINE LEARNING ENGINE Adaptive ML Market Predictor – Multi-Bar Trend & Candle Forecast What This Indicator Does This indicator is a  real-time market prediction engine  designed to analyze price behavior and estimate  future market tendencies . Unlike conventional indicators, this system  does not rely on static parameters or historical curve-fitting , but adapts its internal state dynamically during live market operation. Instead of using static rules, the indic
FFx Engulfing Setup Alerter gives trade suggestions with Entry, Target 1, Target 2 and StopLoss. Below are the different options available: Entry suggestion - pips to be added over the break for the entry 3 different options to calculate the SL - by pips, by ATR multiplier or at the pattern High/Low 3 different options to calculate the 2 TPs - by pips, by ATR multiplier or at Risk/Reward Offset the dashboard - any place on the chart Remove the suggestion once the price reached the SL line Lines
FFx InsideBar Setup Alerter gives trade suggestions with Entry, Target 1, Target 2 and StopLoss. Below are the different options available: Entry suggestion - pips to be added over the break for the entry Minimum candle size - to avoid too close buy/sell entry suggestions 3 different options to calculate the SL - by pips, by ATR multiplier or at the pattern High/Low 3 different options to calculate the 2 TPs - by pips, by ATR multiplier or at Risk/Reward Offset the dashboard - any place on the c
FFx OutsideBar Setup Alerter gives trade suggestions with Entry, Target 1, Target 2 and StopLoss. Below are the different options available: Entry suggestion - pips to be added over the break for the entry. 3 different options to calculate the SL - by pips, by ATR multiplier or at the pattern High/Low. 3 different options to calculate the 2 TPs - by pips, by ATR multiplier or at Risk/Reward. Offset the dashboard - any place on the chart. Remove the suggestion once the price reached the SL line.
FFx PinBar Setup Alerter gives trade suggestions with Entry, Target 1, Target 2 and StopLoss. Below are the different options available: Entry suggestion - pips to be added over the break for the entry Minimum candle size - to avoid too small candles 3 different options to calculate the SL - by pips, by ATR multiplier or at the pattern High/Low 3 different options to calculate the 2 TPs - by pips, by ATR multiplier or at Risk/Reward Offset the dashboard - any place on the chart Remove the sugges
The purpose of this new version of the MT4 standard indicator provided in your platform is to display in a sub-window multiple timeframes of the same indicator with its divergences. See the example shown in the picture below. But the display isn't like a simple MTF indicator. This is the real display of the indicator on its timeframe. Here's the options available in the FFx divergences indicator: Select the timeframes to be displayed (M1 to Monthly) Define the width (number of bars) for each tim
The purpose of this new version of the MT4 standard indicator provided in your platform is to display in a sub-window multiple timeframes of the same indicator with its divergences. See the example shown in the picture below. But the display isn't like a simple MTF indicator. This is the real display of the indicator on its timeframe. Here's the options available in the FFx divergences indicator: Select the timeframes to be displayed (M1 to Monthly). Define the width (number of bars) for each ti
The FFx Dashboard MTF alerter will show you on a single chart all the timeframes (M1 to Monthly) with their own status for the indicator. 2 Alert Options: Single timeframe: each selected timeframe alert separately when a signal occurs Multi timeframes: all selected timeframes must agree for an alert to be triggered Both options have an input to select the timeframes to be used for the alert(s). How to Understand the Status: Green/Red square: histogram above/below 0 line Green square + Red bord
The FFx Dashboard MTF alerter will show you on a single chart all the timeframes (M1 to Monthly) with their own status for the indicator. 2 Alert Options: Single timeframe: each selected timeframe alert separately when a signal occurs Multi timeframes: all selected timeframes must agree for an alert to be triggered Both options have an input to select the timeframes to be used for the alert(s). How to understand the status: Green/Red square: RSI above/below 50 line Green square + Red border: R
The FFx Dashboard MTF alerter will show you on a single chart all the timeframes (M1 to Monthly) with their own status for the indicator. 2 Alert Options: Single timeframe: each selected timeframe alert separately when a signal occurs Multi timeframes: all selected timeframes must agree for an alert to be triggered Both options have an input to select the timeframes to be used for the alert(s). How to understand the status: Green/Red square: Stoch above/below 50 line Green square + Red border:
The FFx Dashboard MTF alerter will show you on a single chart all the timeframes (M1 to Monthly) with their own status for the indicator. 2 Alert Options: Single timeframe: each selected timeframe alert separately when a signal occurs Multi timeframes: all selected timeframes must agree for an alert to be triggered Both options have an input to select the timeframes to be used for the alert(s). How to understand the status: Green/Red square: Price above/below Cloud (Kumo) Green square + Red bo
The FFx Dashboard MTF alerter will show you on a single chart all the timeframes (M1 to Monthly) with their own status for the indicator. 2 Alert Options: Single timeframe: each selected timeframe alert separately when a signal occurs Multi timeframes: all selected timeframes must agree for an alert to be triggered Both options have an input to select the timeframes to be used for the alert(s). How to understand the status: Green/Red square: MA pointing Up/Down Green square + Red border: MA po
The FFx Dashboard MTF alerter will show you on a single chart all the timeframes (M1 to Monthly) with their own status for the indicator. 2 Alert Options: Single timeframe: each selected timeframe alert separately when a signal occurs. Multi timeframes: all selected timeframes must agree for an alert to be triggered. Both options have an input to select the timeframes to be used for the alert(s). How to understand the status: Green square: Price above PSAR Red square: Price below PSAR Options
The FFx Dashboard MTF alerter will show you on a single chart all the timeframes (M1 to Monthly) with their own status for the indicator. 2 Alert Options: Single timeframe: each selected timeframe alert separately when a signal occurs Multi timeframes: all selected timeframes must agree for an alert to be triggered Both options have an input to select the timeframes to be used for the alert(s). How to understand the status: Green/Red square: CCI above/below levels (ie. 100/-100) Grey square: C
The FFx Dashboard MTF alerter will show you on a single chart all the timeframes (M1 to Monthly) with their own status for the indicator. 2 Alert Options: Single timeframe: each selected timeframe alert separately when a signal occurs Multi timeframes: all selected timeframes must agree for an alert to be triggered Both options have an input to select the timeframes to be used for the alert(s). How to understand the status: Green/Red square: ADX above level Grey square: ADX below level Red bor
The FFx Dashboard MTF alerter will show you on a single chart all the timeframes (M1 to Monthly) with their own status. 2 Alert Options: Single timeframe: each selected timeframe alert separately when a signal occurs Multi timeframes: all selected timeframes must agree for an alert to be triggered Both options have an input to select the timeframes to be used for the alert(s). How to understand the status: Green/Red square: bullish/bearish candle Options available in the FFx Dashboard Alerter
The [GRAFF] III manual trading system is based on multiple MetaTrader (MT4) indicators. Together, the entire PACK of GRAFF III indicators makes an advanced trading tool. The system consists of over 20 different custom-built indicators which have been carefully selected and tested in the long term to produce strong and efficient trading signals. The particular indicators are based on different mathematical formulas, so the entire system is calibrated to remove false signals from its own indicator
FFx Universal Strength Meter PRO is more than a basic strength meter. Instead of limiting the calculation to price, it can be based on any of the 19 integrated strength modes + 9 timeframes. With the FFx USM, you are able to define any period for any combination of timeframes. For example, you can set the dashboard for the last 10 candles for M15-H1-H4… Full flexibility! Very easy to interpret... It gives a great idea about which currency is weak and which is strong, so you can find the best pai
Pan PrizMA CD Phase is an analogue of the МetaТrader 5 indicator , and is an option based on the Pan PrizMA indicator. Details . Averaging by a quadric-quartic polynomial increases the smoothness of lines, adds momentum and rhythm. Extrapolation by the sinusoid function near a constant allows adjusting the delay or lead of signals. The value of the phase - wave status parameter (which is close in meaning to the trigonometric phase or the angle of the radius-vector rotation in the trigonometric p
MetaTrader 5 version available here : https://www.mql5.com/en/market/product/24882 FFx Basket Scanner is a global tool scanning all pairs and all timeframes over up to five indicators among the 16 available. You will clearly see which currencies to avoid trading and which ones to focus on. Once a currency goes into an extreme zone (e.g. 20/80%), you can trade the whole basket with great confidence. Another way to use it is to look at two currencies (weak vs strong) to find the best single pairs
NostradamusMT4
Andrey Spiridonov
1 (1)
NostradamusMT4 is a powerful indicator from the set of professional trader. The indicator is based on Andrei Spiridonov's original price calculation method (ESTIMATED PRICE) for the current candle price. Advantages The indicator does not redraw. It works on any timeframes. Works with any trading instruments. Perfectly suitable for scalping and trading binary options. Parameters Color - color of the ESTIMATED PRICE FUTURE line. How to work with the indicator The indicator forms the ESTIMATED P
MetaTrader 5 version available here: https://www.mql5.com/en/market/product/25794 FFx Pivot SR Suite PRO is a complete suite for support and resistance levels. Support and Resistance are the most used levels in all kinds of trading. Can be used to find reversal trend, to set targets and stop, etc. The indicator is fully flexible directly from the chart 4 periods to choose for the calculation: 4Hours, Daily, Weekly and Monthly 4 formulas to choose for the calculation: Classic, Camarilla, Fibonac
The arrows are calculated with: -     2 Parabolic  parameters -     2 ADX parameters -     4 Stochastic parameters We recommend to combine it with Parabolic, ZigZag or Elliot waves indicator. Always trade the trend! If you make sure to draw your trend lines and support/resistance zones you will just have to wait for the signal to appear. Take the trade. For Binary Options it is advisable to set the expiry time to 5-15 min in M1 chart. THIS INDICATOR IS ZERO REPAINT Best assets to trade: - EUR
Let´s try to make some real money! Call me profit addicted. I thought why not try to make THE dream come reality. With discipline, a clear strategy and this indicator I focus on entering the perfect trades. This indicator is very easy to use as you will get perfect entry points for Put or Call trades. The arrows are calculated with: -     Momentum  parameters -     Candle stick patterns -     Fundamental Price action We recommend to combine it with Parabolic, ZigZag or Elliot waves indicator
SystemPro - a professional indicator, is a full-fledged, self-sufficient author's strategy for working in the Forex market. A unique algorithm for analyzing the foreign exchange market is based on the calculation of reference points for three different time periods. Thus, the indicator simultaneously analyzes the long-term, medium-term and short-term price behavior before issuing a signal. The indicator is set in the usual way and works with any trade symbols. Advantages of the indicator It is
Pisces TheProfitZone "Pisces TheProfitZone MT4 Indicator Powered byFxGangster" This indicator will calculate new support and resistant zone everyday, and that give us a trading zone such as thats telling us TP and SL, So it still telling us for where should the price will go reach? Fore Example. Uptrend : If Price can stay upper a Line and price close higher above a Line, then the price will continue go up to reach next Line. Downtrend : If Price can't pass to stay upper a Line and the price
作者のその他のプロダクト
Forex MasterMind Algo AI Multiple Trading Are 3 Type Of Trading Strategy   Velocity Trading Breakout Trading Reversal Trading   Velocity Trading Strategy:-                Velocity Trading Strategy Are Longer Then Candle Buy Or Sell Its Same Side More Than Trade. For Example, in Market Are Buy Side Long Candle, The EA Is Buy, Only Fixed Lot Is Working On Strategy  Breakout Trading Strategy:-                   Breakout Trading Strategy Instantly Place Order BuyStop And SellStop, Once Breakout
KingMaker Ultimate Scalper Expert Advisor TimeFrame - 5 Mins Minimum Balance - 200$ Pairs - Major Currency Pairs , Like - EURUSD, GBPUSD, USDJPY .... etc Run Low Spread Forex Broker Or ECN Broker Money Management Adjust Risk Management SafeMode - True/False Setting : You Have Deposit 200$ , Run EA On 2 or 3 Currency Pairs Only  Automatic Increase And Decrease Lot Size 
ADX Pro Indicator This Indicator Are Advanced Pro ADX Indicator  Multi Time Frame Are Same Window Multi Currency Are Same Windows All Time Frame And All Currency ADX Strenght Are Same Window Monitring  You Will Add Manully All Currency Pairs , And Metel , And Also Crypto Currency Pairs : EURUSD , GBPUSD, USDJPY .... Etc , Metel : XAUUSD , XAGUSD ... Etc , Crypto : BTCUSD, ETHUSD... Etc
Master Trend Signal Indicator TimeFrame - 15 Mins & More Pairs  - All Forex Currency Pairs , Gold , Silver , Crypto, Stock Once Trend Is UP Cross The Yellow Line, It's Show Colour For Green Once Trend Is Down Cross The Yellow Line, It's Show Colour For Red Easy TO Identify Trend Strength ON Trading For Scalping, Intraday Trading 5 Purchases left & The Price Increases
Golden Scalping & Day Trading Signal Indicator  You Can Enable Or Disable Scalping Signal Option Once Enable For Scalping More Order Signals Option Or Disable For Scalping Option Intraday Signal Option Pairs :   XAUUSD, XAGUSD  - EURUSD, GBPUSD,USDJPY, AUDUSD, USDCAD, BTCUSD , USDCHF, GBPJPY Time Frame : 15 Mins, 30 Mins , 1 Hour  5 Purchases left & The Price Increases
Gold Trend Pro Buy & Sell Signal Indicator Pairs : XAUUSD - XAGUSD  - Crude OiL, EURUSD,GBPUSD,USDJPY,AUDUSD,GBPJPY,BTCUSD TimeFrame - 1 Min , 5Min, 15Min  Once All Are Green Bar , And Also Englufing The Candle You Can Enter To Buy Once All Are Red Bar, And Also Engulfing The Candle You Can Entry To Sell And Next Once Change The Bar Colour , You Can Exit The Buy & Sell Order
Super Signal Buy And Sell Indicator Pairs - XAUUSD - XAGUSD - Oil - BTCUSD - EURUSD - GBPUSD - USDJPY - AUDUSD - GBPJPY .... etc TimeFrame - 15Mins - 30Mins - 1Hour - 4Hour - 1Day - 1Week - 1Month   Setting : -  Once Show On Green Arrow And Next Engulfing For Candle You Can Place The Buy Order Once Show For Red Arrow And Next Engulfing For Candle You Can Place The Sell Order Otherwise Please Wait For Conformation Push Notification Alert
フィルタ:
レビューなし
レビューに返信