Super Signal Buy And Sell Indicator
- インディケータ
-
Pappathi Murugesan
 Premium Forex Expert Advisor And Indicator
Visit The Link For All Product : https://www.mql5.com/en/users/tamil_forex_crypto/seller - バージョン: 3.96
- アクティベーション: 10
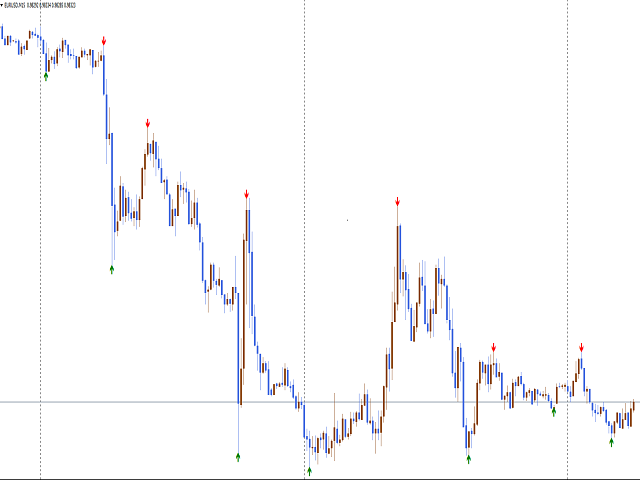
Super Signal Buy And Sell Indicator
Pairs - XAUUSD - XAGUSD - Oil - BTCUSD - EURUSD - GBPUSD - USDJPY - AUDUSD - GBPJPY .... etc
TimeFrame - 15Mins - 30Mins - 1Hour - 4Hour - 1Day - 1Week - 1Month
Setting : -
Once Show On Green Arrow And Next Engulfing For Candle You Can Place The Buy Order
Once Show For Red Arrow And Next Engulfing For Candle You Can Place The Sell Order
Otherwise Please Wait For Conformation
Push Notification Alert