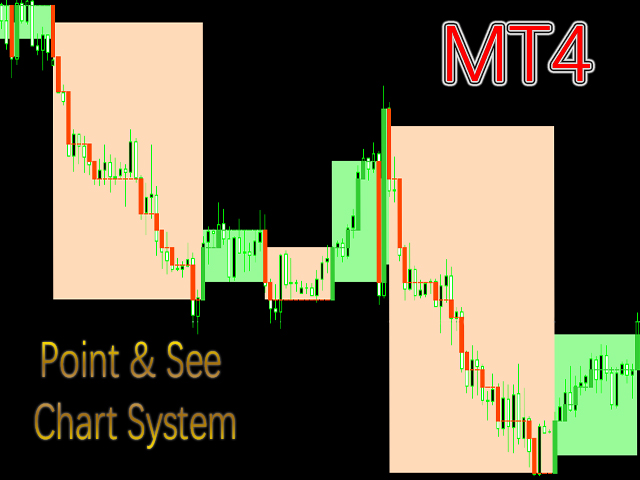
Point and See Chart System

This is a Manual Indicator to help Manual traders see the Trend Visually it allows you to fully control how the candle closes with many different options, and you can plot the path with many different options.

This Indicator is best used in Timeframe: H1 or higher


Close Candle Methods

  • Close
  • Open
  • High
  • Low
  • Median
  • Typical
  • Weighted Close
  • Median Body (Open+Close)/2
  • Average (High+Low+Open+Close)/4
  • Trend Biased
  • Heiken Ashi Close
  • Heiken Ashi Open
  • Heiken Ashi High   
  • Heiken Ashi Low
  • Heiken Ashi Median
  • Heiken Ashi Typical
  • Heiken Ashi Weighted Close
  • Heiken Ashi Median Body
  • Heiken Ashi Average
  • Heiken Ashi Trend Biased   

Methods of Plotting Modes:

  • Simple Moving Average
  • Exponential Moving Average
  • Wilder Exponential Moving Average
  • Linear Weighted Moving Average
  • Sine Weighted Moving Average
  • Triangular Moving Average
  • Least Square Moving Average (or EPMA, Linear Regression Line)
  • Smoothed Moving Average
  • Hull Moving Average
  • Zero-Lag Exponential Moving Average
  • Double Exponential Moving Average
  • T3
  • Instantaneous Trendline
  • Moving Median
  • Geometric Mean
  • Regularized EMA 
  • Integral of Linear Regression Slope
  • Combination of LSMA and ILRS
  • Triangular Moving Average generalized
  • Volume Weighted Moving Average
  • RoyalPrince Smoothing
  • Simplified SMA
  • AL Moving Average
  • Triple Exponential Moving Average
  • T3
  • Laguerre filter
  • Dynamic
  • Two-pole modified Butterworth filter
  • Three-pole modified Butterworth filter
  • SuperSmoother 
  • Simple Decycler
  • Modified eVWMA
  • Exponential Weighted Moving Average
  • Double Smoothed EMA
  • Triple Smoothed EMA
おすすめのプロダクト
Hello Guys! I want to share with you a very useful tools. Anyone of us who has used MT4 for some time knows how impractical this platform can be for discretionary trading. That's why I created this graphical interface!  Interface is very simple, all the info that you need are in the video and in the screenshot. NB: Before to run the EA Interface, remember to copy the file in the comment in your MT4 folder "Controls". PATH: .../MQL4/INCLUDE/CONTROLS NB: unfortunately the interface can't be test
Targets
Jose Ramon Miranda Ramos
5 (1)
Targets is an indicator to determine potential turning  points , targets  are calculated to determine levels in which the sentiment of the market could change from "bullish" to "bearish." This indicator can be used in any timeframe and any currency pair: IN CASE YOU DON'T SEE THE INDICATOR WHEN YOU ADD IT TO YOUR CHARTS JUST OPEN THE INDICATOR MENU AND CLOSE THE MENU AGAIN PLEASE TAKE NOTICE: For best results use this indicator as an extra tools after you have completed your regular analysis an
FREE
The Sentiment Ratio indicator gauges current Market Sentiment between -100% and 100%, where lower than -40% is considered Bearish and higher than 40% is Bullish. The channel between the two is considered Neutral. The indicator has been a very useful filter tool for signals within a trading system. Example call function:  int SentimentIndicator(double triggerLevel)//Return sentiment if trigger level is activated {   double sentimentRatio=iCustom(NULL,0,"Sentiment Ratio",0,0,0);   if(sentimentRat
FREE
MQLTrend
Mohammad Reza Aghaei
This tool helps you to control the situation at other times and include them in your trades when analyzing the market  This tool scans the market and reports the movement of the market at different times With the help of this tool, you can prevent many wrong analyzes With the help of this tool, you can have an overview of the market in the shortest time and save your time
FREE
Market Ticker
John Louis Fernando Diamante
The only Market Ticker on the market! Add a professional novelty to your workspace, with built in mini-charts A scrolling Market Ticker that displays price changes from all symbols in the Market Watch list. Provides an easy snapshot of symbol prices, and keeps scrolling automatically while you trade and analyse the chart. The ticker color (+/- price changes) are based on either the current or completed candle, and the previous candle. Options include: - MTF, eg choose to show price changes of
Fibonacci BB Breakout Indicator is a powerful MT4 tool that automatically detects Bollinger Bands breakouts and draws Fibonacci extension levels as trend lines on your chart. It simplifies trading by highlighting potential support, resistance, and target zones after strong moves, with customizable alerts and an info panel for quick status checks.  Key Features - Automatic Breakout Detection: Spots bullish (price closes above upper BB) or bearish (below lower BB) breakouts on the previous close
This is Command Prompt(CP) for MT4. By using this,you can access info that only brokers and programmers can access. For example,do you know your freeze level,margin mode,or how much memory used by MT4? Knowing these info,you can improve your trading. How to Use Type following commands into command prompt box(Shown in photos.) and press Enter. For example,if you want to know maximum permitted amount of a lot,then type "maxlot". By typing "info",CP will show all commands available. By typing "hel
The MT4 " DayLevelsSignalPro " indicator . Signal Indicator – generates the most accurate buy / sell signals . Noise filtering indicator  – reduces false signals . Signal information with a clear , understandable and visually convenient view . User- friendly graphical interface ( colors , sound notifications , customization options ) . - Generation of a breakdown signal for significant peaks of the Current day . - Generation of a signal for the breakdown of the previous Day 's Level - Generation
When the market breaks the glass ceiling someone has to use the   broom   and pick up the glass from the floor. Broom   is the system that detects this break and collects the crystals. Being a very aggressive scalping system, it should only be used in pairs with a low spread and low commissions. This system is suitable for small accounts and can be used with only  $ 100. You can download the demo and test it yourself.   Very stable growth curve as result of smart averaging techniques. "Sa
The Supply and Demand Zone Indicator is a powerful and easy-to-use tool designed to help traders identify critical supply and demand zones on the chart. These zones can provide valuable insight into potential market reversals, breakouts, and important price levels where buyers or sellers are likely to take control. The best   FREE Trade Manager . If you want to create your own Hedging or Grid strategies without any coding make sure to check out the   ManHedger Key Features: Automatic Zone Detect
FREE
The Auto Percentage SL TP is not taking any trade! It was made especially for Proptrading Challenges like FTMO, Myforexfunds, Fundednext and many more. Most Propfirms ban your funded Live-Account if you do not set SL and TP soon after the trade. It is a tool to help setting automatically TP and SL based on given percentage in settings. You can add e.g. 1% risk for a trade and it sets the stop loss to 1% from your balance. Same with stop loss, which is default also 1%. But these values can be cha
初心者またはプロフェッショナルである当社のベストセラーのマルチタイムフレームPivotProfは、スペシャリストが使用するサポート層とレジスタンス層を使用して、売買を美化し、一流の変更の可能性を提供します。ピボットの売買は、主要な範囲で市場に出入りするための簡単で優れた手法であり、当局によって長い間使用されており、外国為替、暗号、株式、インデックスなどのすべてのシンボルで機能します。ピボット教授がトップをもたらします市場が反応する可能性が最も高い場所であるディーラーへのレートティア。これは、ディーラーが市場に出入りし、大規模な最終損失やドローダウンを回避することを望んでいるまさにその要素です。 17の特定の時間枠全体から、シンボルごとに120度以上のデータを計算し、同時に表示する、他に類を見ないアルゴリズムを備えた豊富な機能。すべてがユニークで整頓された使いやすい形式で表示され、端末、電子メール、携帯電話のスマートフォンアラートが付属しています。さらに、全体がカスタマイズ可能です...数式、表示、信号など。 売買スタイルは数えられません。PivotProfを使用して、これらの重要
Simple Candlestick Timer – Free MT4 Indicator Simple Candlestick Timer is a lightweight and easy-to-use MT4 indicator that displays a precise countdown until the current candlestick closes. This tool helps traders improve timing, discipline, and decision-making by showing exactly how much time remains before the next candle begins. Key Features: Clean countdown display directly on your chart. Helps with entry and exit timing. Lightweight, simple, and beginner-friendly. Works on all symbols and t
FREE
Please contact me at telegram  https://t.me/smartforex7 After purchasing SmartForex Indicator then Use This Indicator...................... SMART EXIT PROFIT LINE Indicator is very Helpful with SmartForex Indicator ........................................ SMART EXIT PROFIT LINE Indicator Attach with SmartForex Indicator after then Red Line Show Exit buy Profit , Green Line show Exit Sell Profit................
FREE
The [GRAFF] III manual trading system is based on multiple MetaTrader (MT4) indicators. Together, the entire PACK of GRAFF III indicators makes an advanced trading tool. The system consists of over 20 different custom-built indicators which have been carefully selected and tested in the long term to produce strong and efficient trading signals. The particular indicators are based on different mathematical formulas, so the entire system is calibrated to remove false signals from its own indicator
My products: https: // www.mql5.com/ru/users/astra077/seller In the product line: Candlestick Pattern Detector   — a free basic version. Candlestick Patterns Standard   — a paid single-chart version with extended patterns and filters  https://www.mql5.com/ru/market/product/174659 Japanese Candlestick Patterns Pro MT4   — a professional single-chart version with a summary table  https://www.mql5.com/ru/market/product/174681 Multi-Currency Candlestick Pattern Scanner   — the ultimate version: a m
Introduction This indicator detects volume spread patterns for buy and sell opportunity. The patterns include demand and supply patterns. You might use each pattern for trading. However, these patterns are best used to detect the demand zone (=accumulation area) and supply zone (=distribution area). Demand pattern indicates generally potential buying opportunity. Supply pattern indicates generally potential selling opportunity. These are the underlying patterns rather than direct price action. T
Rectangle Trading Custom   is a powerful technical analysis tool designed for price action and range-based traders. It allows users to define consolidation zones and receive alerts when the price breaks out of these zones or approaches trendlines drawn on the chart. Rectangles and Trendlines will be extended into future with one click. Rectangle point size, name and prices will be displayed around rectangle. Key Features: Draw Trading Zones (Rectangle Zones) Users can manually draw rectangles t
PDP indicator is used for: defining price probability distributions. This allows for a detailed representation of the channel and its borders and forecast the probability of a price appearing at each segment of its fluctuations; defining the channel change moment. Operation principles and features PDP analyzes a quote history on lower timeframes and calculates a price probability distribution on higher ones. Forecast algorithms allow the indicator to calculate probability distributions and mov
Cancer indicator is great for trend trading! An intelligent indicator algorithm with high probability shows the points of potential market reversal. If you are trading in a trend, then a trading strategy built on the basis of this indicator is perfect for you. The indicator filters out market noise, almost everything and all the necessary functions for working with a thread are built into one tool. It works on all currency pairs and on all timeframes, indicator setting - according to your desire
This multi symbol indicator has been designed to automatically identify when price reaches major psychological levels. Also known as round numbers, whole numbers or key levels. As a bonus it can also scan for pivot point level on one selected time frame. Combined with your own rules and techniques, this indicator will allow you to create (or enhance) your own powerful system. Features Can write the signals to a file which can be used by an Expert Advisor for auto trading. Can monitor all symbols
Indicator RangeChannel (RC) or, band channel indicator. The use of the indicator allows the trader to react in time for the price to go beyond the limits of the channel established for it. This corridor is built on the basis of the analysis of several candles, starting from the last one, as a result of which the extremes of the investigated interval are determined. They create the lines of the channel. A sell signal occurs when the price touches the lower border and, conversely, the contact wit
The utility places stop loss and take profit for opened orders. It is necessary to allow automated trading in the terminal settings. Discuss the complexities of Forex trading here:  chat "Age of Expert Advisors" . Parameters magic - magic number. If less than 0, orders with any magic number are processed. Select_Symbol  - selection of symbols. Positions with selected symbols will be accompanied by. Take_Profit - take profit (TP). If the value is less than 0, then TP does not change. If the value
FREE
The 4 headed dragon is an indicator that has two functions. 1) Set the background trend. 2) Mark the predominant trend. By combining these two indicator signals, we will be able to trade for or against the trend, adapting the signals to your reading of the market. You can download the demo and test it yourself. 1) Set the background trend.   Define four possibilities of trend that are the four heads of the dragon, marked by colors on the indicator, marking a) Powerful buying trend. b) Weak
Mars 4 TREND COLORS: is a Tren indicator. I s a powerful indicator of  TREND  for any par and any timeframe. It doesn't requires any additional indicators for the trading setup.The indicator gives clear signals about opening and closing trades,  PAINTING THE CANDLES OF COLOR IN FUNCTION OF THE SENSE OF TREND  .This Indicator is a unique, high quality and affordable trading tool. Perfect For New Traders And Expert Traders Low risk entries. For MT4 Only Great For Scalping Great For Swing Trading
Psychology
Tais Miranda Hoffmann
5 (4)
The most different product of the site: This tool is an auxiliary tool aimed at managing your trades and psychological discussions. As you probably know, more than 70% of the reason for the success of big traders is psychological issues. Only 30% is related to your strategy. So it is better to strengthen this big part with a tool. With a free tool, I allow you to become a better trader   This tool consists of several rules. In version 1.0, we have 7 rules. In later versions, we will add more ru
FREE
XFlow shows an expanding price channel that helps determine the trend and the moments of its reversal. It is also used when accompanying transactions to set take profit/stop loss and averages. It has practically no parameters and is very easy to use - just specify an important moment in the history for you and the indicator will calculate the price channel. DISPLAYED LINES ROTATE - a thick solid line. The center of the general price rotation. The price makes wide cyclical movements around the
MT5 Version: https://www.mql5.com/en/market/product/124107 A Day in the Life of a Trader: Discovering the Forex Matrix Dashboard In the fast-paced world of forex trading, keeping track of multiple currency pairs can feel overwhelming. That’s where the   Forex Matrix Dashboard   comes in, making the life of a trader much easier. Imagine opening the dashboard and instantly seeing all your favorite currency pairs, like EUR/USD, GBP/USD, and USD/JPY, displayed clearly with their latest prices. No mo
Panther Trade Scenario — チャート上に明確なトレードシナリオを直接表示します。 このインジケーターは、トレードにおける最大の問題である「行動すべき瞬間の不確実性」を取り除きます。最適なタイミングを推測するのではなく、 どこでエントリーするか、どこでリスクを制限するか、どこで利益を確定するか を正確に把握できます。   なぜ多くのミスはエントリーで発生するのか 問題は市場を理解していないことではありません。多くの場合、状況はこうです:動きを見て方向を理解しているのに、エントリーの瞬間に迷いが生まれます。 今入るべきか、それとも待つべきか?早すぎないか?さらに下がったらどうする? 結果は同じです:早く入りすぎてストップにかかるか、待っているうちに市場が動いてしまうかのどちらかです。 そして最も悔しいのは——アイデア自体は正しく、間違いはエントリーだけだったという点です。 Panther Trade Scenarioでプロセスは明確になる チャートにシグナルが表示された時点で、推測の余地はなくなります。 このインジケーターは単に方向を示すだけではなく、   すでに
Утилита  TSim   позволяет симулировать ручную торговлю в Тестере Стратегий MetaTrader 4. В панеле можно устанавливать размеры лота, тейпрофита и стоплосса. Панель имеет кнопки Sell   и Buy для выставления рыночных ордеров, а также кнопки CloseSell, CloseBuy и CloseAll для быстрого закрытия ордеров. Под панелью отображается список открытых ордеров. Внимание. Панель работает только в Визуальном режиме Тестера Стратегий MetaTrader 4.
FREE
このプロダクトを購入した人は以下も購入しています
Neuro Poseidon is a new indicator by Daria Rezueva. It combines precise trading signals with adaptive TP/SL levels - creating best possible trades as a result! Message me and get  Neuro Poseidon Assistant  as a gift to automize your trading process! What makes it stand out? 1. Proven profitability on all assets and timeframes 2. Only confirmed BUY and SELL signals present on the chart 3. Adaptive TP & SL levels generated by the software for each trade 4. Easy to understand - suitable for all
Gann Made Easy は、ミスター・ギャンの理論を使用した取引の最良の原則に基づいた、プロフェッショナルで使いやすい外国為替取引システムです。 W・D・ガン。このインジケーターは、ストップロスとテイクプロフィットレベルを含む正確な買いと売りのシグナルを提供します。 PUSH通知を利用して外出先でも取引可能です。 ご購入後、取引方法の説明と優れた追加インジケーターを無料で入手するには、私にご連絡ください! おそらく、ギャンの取引手法についてはすでに何度も聞いたことがあるでしょう。通常、ギャンの理論は初心者のトレーダーだけでなく、すでにある程度の取引経験がある人にとっても非常に複雑なものです。なぜなら、ギャンの取引手法は理論的にはそれほど簡単に適用できるものではないからです。私はその知識を磨き、最良の原則を私の外国為替インジケーターに組み込むために数年を費やしました。 このインジケーターは非常に簡単に適用できます。必要なのは、それをチャートに添付し、簡単な取引推奨事項に従うだけです。このインジケーターは常に市場分析の仕事を行い、取引の機会を探します。適切なエントリーポイントを検出す
Trend Catcher ind
Ramil Minniakhmetov
5 (2)
トレンドキャッチャーインジケーター トレンドキャッチャーインジケーターは、開発者独自の適応型トレンド分析指標を組み合わせることで、市場価格の動きを分析します。短期的なノイズを除去し、根底にあるモメンタムの強さ、ボラティリティの拡大、価格構造の挙動に焦点を当てることで、真の市場方向性を特定します。また、移動平均線、RSI、ボラティリティフィルターなどの平滑化およびトレンドフィルタリング機能を備えたカスタマイズ指標も使用します。 実際の運用状況のモニタリングやその他の製品については、こちらをご覧ください: https://www.mql5.com/en/users/mechanic/seller ご注意ください。私はTelegramでEAや設定を販売していません。詐欺です。すべての設定はブログで無料で公開しています。 重要!ご購入後すぐにご連絡ください。手順とボーナスをお送りします!
M1 SNIPER は使いやすいトレーディングインジケーターシステムです。M1時間足向けに設計された矢印インジケーターです。M1時間足でのスキャルピングのためのスタンドアロンシステムとして、また既存のトレーディングシステムの一部としても使用できます。このトレーディングシステムはM1時間足での取引に特化して設計されていますが、他の時間足でも使用できます。元々、この手法はXAUUSDとBTCUSDの取引用に設計しましたが、他の市場においても役立つと考えています。 インジケーターのシグナルは、トレンドの方向と逆方向に取引できます。インジケーターのシグナルを利用して両方向に取引するのに役立つ特別な取引テクニックをご紹介します。この手法は、特別な動的なサポートとレジスタンスの価格帯を利用することに基づいています。 ご購入後、M1 SNIPER矢印インジケーターをすぐにダウンロードできます。さらに、M1 SNIPERツールのすべてのユーザーに、以下のスクリーンショットに表示されているApollo Dynamic SRインジケーターを無料で提供しています。この2つのインジケーターを組み合わせることで
Advanced Supply Demand
Bernhard Schweigert
4.91 (300)
現在30%オフ 初心者にもエキスパートトレーダーにも最適なソリューション このインジケーターは独自の機能と新しい公式を多数内蔵しており、ユニークで高品質かつ手頃な取引ツールです。このアップデートでは、2つの時間枠ゾーンを表示できるようになります。より長いTFだけでなく、チャートTFとより長いTF(ネストゾーンを表示)の両方を表示できます。すべてのSupply Demandトレーダーの皆さんのお気に召すはずです。:) 重要情報の公開 Advanced Supply Demandの可能性を最大化するには、 https://www.mql5.com/ja/blogs/post/720245 にアクセスしてください。   エントリーまたはターゲットの正確なトリガーポイントを正確に特定できれば取引がどのように改善されるか想像してみてください。新しい基盤となるアルゴリズムに基づいて構築されているため、買い手と売り手の間の潜在的な不均衡をさらに簡単に特定できます。これは、最も強い需要と供給のゾーンと、過去のパフォーマンス(古いゾーンを表示)がグラフィカルに表現されるためです。これらの機能は、最適な
このインジケーターは実践的なトレードに最適な自動波動分析のインジケーターです! 場合... 注:   Tang Lun (Tang Zhong Shuo Zen) の命名規則の影響で、私は波のグレーディングに西洋の名前を使用することに慣れていません。基本的な波を ペン 、二次波のバンドを セグメント と名付けました。同時に、 セグメント にはトレンドの方向が指定されます (この命名方法は将来のノートで使用されます。最初に言っておきます)。ただし、アルゴリズムは曲がりくねった理論とはほとんど関係がないため、付けるべきではありません。これは、私の市場分析 によって要約された、絶えず変化する複雑な運用ルール を反映しています。 バンドは標準化され、人によって異なることがないよう定義されており、市場参入を厳密に分析する上で重要な役割を果たす人為的な干渉の描画方法が排除されています。 このインジケーターを使用することは、取引インターフェイスの美しさを改善することと同等であり、元の K ライン取引を放棄し、取引の新しいレベルに連れて行きます。また、宣伝の観点から顧客の認識も向上します。 イ
Scalper Inside PRO Scalper Inside PRO は、MetaTrader 4 向けの短期トレンドおよびスキャルピング用インジケーターです。独自アルゴリズムを用いて、市場の方向性と主要なターゲットレベルを素早く検出します。エントリー、イグジット、複数の利確ターゲットを自動計算し、詳細なパフォーマンス統計を表示することで、さまざまな銘柄やストラテジーがどのように機能してきたかを確認できます。これにより、現在のマーケットコンディションに最も適した取引銘柄を選択するのに役立ちます。さらに、Scalper Inside PRO には、お使いの矢印インジケーターを簡単に接続でき、その統計と過去のパフォーマンスを素早く評価できます。 本インジケーターは、あらゆる銘柄と時間足で動作し(短期トレードには M5 を推奨)、複数の内蔵ストラテジーを備えています。そのため、単体のスキャルピングツールとしても、トレーディングシステム内の強力な分析コンポーネントとしても活用できます。 主な機能 独自アルゴリズム(Next‑Generation Trend Detection Algor
Trend Breakout Arrows Indicator The Trend Breakout Arrows Indicator is a momentum-based signal tool designed to identify potential bullish and bearish breakout opportunities. It displays clear arrow signals directly on the price chart, helping traders quickly recognize possible trend changes and continuation setups. Up Arrow (Buy Signal) A magenta up arrow appears below a candle when bullish momentum begins to strengthen. This signal indicates that buying pressure may be overtaking selling press
Current event:  https://c.mql5.com/1/326/A2SR2025_NoMusic.gif A. A2SR とは何ですか ?   * 先行テクニカル指標です (塗り直しなし、ラグなし)。 -- ガイダンス : -- https://www.mql5.com/en/blogs/post/734748/page4#comment_16532516 -- そして https://www.mql5.com/en/users/yohana/blog A2SR には、サポート (需要) とレジスタンス (供給) のレベルを決定する特別な手法があります。 ネットで見かける通常の方法とは異なり、A2SR は実際の SR レベルを決定する独自のコンセプトを持っています。 元の手法はインターネットから取得されたものではなく、インターネット上で公開されたこともありません。 A2SR は、取引スタイルに応じて SR レベルを自動選択します。 時間枠を変更しても、SR レベルはその位置にとどまります。 実際のSRは、使用する時間枠から取得されるわけではないため. A2SR
MetaBands M4
Vahidreza Heidar Gholami
3.5 (6)
MetaBandsは、強力でユニークなアルゴリズムを使用してチャンネルを描画し、トレンドを検出して、トレーダーに取引の入出ポイントを提供することができます。チャンネル指標に加えて、強力なトレンド指標でもあります。入力パラメータを使用して新しいチャンネルを作成するために、異なるタイプのチャンネルを統合することができます。MetaBandsは、市場のイベントについてユーザーに通知するために、すべてのタイプのアラートを使用します。 特徴 ほとんどのチャンネルアルゴリズムをサポート 強力なトレンド検出アルゴリズム 異なるタイプのチャンネルを統合する能力 マルチタイムフレームおよびマルチカレンシー(シグナルマトリックス) すべてのタイプのアラート機能(サウンド、画面フラッシャー、プッシュ通知、メール、ポップアップ、矢印) 再描画しない トレンド検出 MetaBandsは、チャネル内を振動する青いラインを使用してトレンドを検出します。ラインがチャネルの上部バンドに達すると、下降トレンドの開始を示し、下部バンドに達すると上昇トレンドの開始を示します。青いラインが中心ラインに近づくと、市場はコンソリ
Genesis Matrix Pro is a professional multi-timeframe trend detection indicator designed to help traders identify high-quality market alignment with clarity and structure. It combines 12 different technical indicators into one visual alignment matrix, allowing traders to quickly see when market conditions are bullish, bearish, or neutral. A signal is generated only when the selected strategies are aligned, helping reduce noise and improve decision-making. PLEASE CONTACT ME AFTER PURCHASE TO GET
この製品は 2026 年の市場向けに更新され、最新の MT5 ビルドに最適化されています。 価格更新のお知らせ: Smart Trend Trading System は現在 $99 で提供されています。 次の 30 件の購入 後、価格は $199 に上がります。 特別オファー: Smart Trend Trading System を購入後、私にプライベートメッセージを送ることで、 Smart Universal EA を無料 で受け取り、Smart Trend のシグナルを自動売買に変えることができます。 Smart Trend Trading System は、リペイントなし、再描画なし、遅延なしの完全なトレーディングシステムです。よりクリーンなシグナル、より明確なトレンド方向、そしてより整理された取引方法を求めるトレーダー向けに作られています。 Online course , manual and download presets . このシステムは、トレンド検出、反転ゾーン、Smart Cloud、トレーリングストップロジック、サポートとレジスタンス、ローソク足の色分け、ア
Dynamic Forex28 Navigator - 次世代の Forex 取引ツール。 現在 49% オフ。 Dynamic Forex28 Navigator は、長年人気のインジケーターを進化させたもので、3 つの機能を 1 つにまとめています。 Advanced Currency Strength28 インジケーター (レビュー 695 件)  + Advanced Currency IMPULSE with ALERT (レビュー 520 件) + CS28 コンボ シグナル (ボーナス)。 インジケーターの詳細 https://www.mql5.com/en/blogs/post/758844 次世代の Strength インジケーターが提供するもの  オリジナルで気に入っていたすべての機能が、新機能と精度の向上によって強化されました。 主な機能: 独自の通貨強度計算式。 すべての時間枠でスムーズかつ正確な強度ライン。 トレンドの特定と正確なエントリーに最適です。 ダイナミックマーケットフィボナッチレベル (マーケットフィボナッチ)。 このインジケーターに固有
BTMM State Engine Pro is a MetaTrader 4 indicator for traders who use the Beat The Market Maker approach: Asian session context, kill zone timing, level progression, peak formation detection, and a multi-pair scanner from a single chart. It combines cycle state logic with a built-in scanner dashboard so you do not need the same tool on many charts at once. What it does Draws the Asian session range; session times can follow broker server offset or be set in inputs. Tracks level progression (L
IQ FX Gann Levels a precision trading indicator based on W.D. Gann’s square root methods . It plots real-time, non-repainting support and resistance levels to help traders confidently spot intraday and scalping opportunities with high accuracy. William Delbert Gann (W.D. Gann) was an exceptional market analyst, whose trading technique was based on a complex blend of mathematics, geometry, astrology, and ancient mathematics which proved to be extremely accurate. Setup & Guide:  Download  MT5 Ver
PRO Renko Systemは、特別にRENKOチャートを取引するために設計された高精度の取引システムです。 これは、様々な取引商品に適用することができる普遍的なシステムです。 システムは効果的に正確な逆転信号へのアクセスを与えるいわゆる市場の騒音を中和する。 表示器は非常に使いやすく、信号の生成に責任がある1つの変数だけがあります。 あなたは簡単にお好みの任意の取引ツールとレンコバーのサイズにツールを適応させることができます。 私はいつもあなたが私のソフトウェアで収益性の高い取引を支援するために余分なサポートを提供する準備ができています! 私はあなたに幸せで収益性の高い取引をしたいです! ご購入後にご連絡ください! 私はあなたに私のレンコチャートジェネレータを送信します。 私はまた、私の個人的な推奨事項やシステムの他のモジュールを無料で共有します!
Price & Time Market Structure Indicator A professional market structure tool that analyzes waves through both price and time — not price alone. Main Description NeoWave PRO is a professional market structure indicator for MetaTrader 4 designed for traders who want to move beyond traditional one-dimensional wave tools such as ZigZag, swing indicators, and basic high/low systems. Most wave indicators analyze only one thing: Price. But a real market wave is not only a price movement. A true wave de
GOLD Impulse with Alert
Bernhard Schweigert
4.67 (12)
このインディケータは、当社の2つの製品 Advanced Currency IMPULSE with ALERT  +   Currency Strength Exotics . のスーパーコンビネーションです。 このインジケーターは全ての時間枠で作動し、8つの主要通貨と1つのシンボルの強弱のインパルスをグラフで表示します。 このインジケータは、金、エキゾチックペア、商品、インデックス、先物など、あらゆるシンボルの通貨強度の加速度を表示することに特化されています。金、銀、原油、DAX、US30、MXN、TRY、CNHなどの通貨強度の加速度(インパルスまたは速度)を表示するために、任意のシンボルを9行目に追加できる、この種の最初のものです。 新しいアルゴリズムに基づいて構築され、潜在的な取引の特定と確認がさらに容易になりました。これは、通貨の強さや弱さが加速しているかどうかをグラフィカルに表示し、その加速の速度を測定するためです。加速すると物事は明らかに速く進みますが、これはFX市場でも同じです。つまり、反対方向に加速している通貨をペアリングすれば、潜在的に利益を生む取引を特定
Market Structure Order Block Dashboard MT4 は、市場構造と価格の主要な反応ゾーンをチャート上で直接読み取りたいトレーダーのために設計された MetaTrader 4 用インジケーターです。BOS、ChoCH、Order Blocks、Fair Value Gaps (FVG)、流動性、Kill Zones、Volume Profile、そして素早い分析のためのコンパクトなダッシュボードを統合しています。 このインジケーターは、市場構造、ICT および Smart Money の概念を意思決定の枠組みとして使用するトレーダーを対象としています。トレンド継続、潜在的反転、価格不均衡、流動性ターゲット、関心ゾーンをより構造的に把握するのに役立ちます。 購入者向けリソース 購入後に MQL5 プライベートメッセージで簡単にリクエストするだけで、完全な PDF ユーザーガイドとパラメーター設定のヒントが入手可能です。MQL5 プライベートメッセージで直接技術サポートを提供します。 この MT4 バージョンは MT5 バージョン 1.20 のすべての機能を
MT5版もご用意しています https://www.mql5.com/ja/market/product/170916 M30/H1/H4スイング版もあります M5/M15では取りきれない大きな波を狙いたい方へ。 Gold Signal Swing Pro(M30/H1/H4対応)を販売中。 1トレードで$20〜$80+の値幅を狙う。 https://www.mql5.com/en/market/product/177643 KURAMA GOLD SIGNAL PRO(MT4版)— 7層フィルター・自動TP/SL・品質スコア搭載 XAUUSD完全トレードシステム リペイントなし。リドローなし。ラグなし。すべてのサインは確定後に変わりません。見たままが結果です。 特典:買い切りライセンスをご購入いただいた方に、AI Zone Radar($59相当)+PDFマニュアルを無料プレゼント。購入後にMQL5でメッセージをお送りください
123パターン は、最も人気のある強力で柔軟なチャートパターンの1つです。このパターンは、3つの価格ポイントで構成されています。ボトム、ピークまたはバレー、および38.2%〜71.8%のフィボナッチリトレースメントです。パターンは、価格が最後のピークまたは谷、インディケーターが矢印をプロットし、アラートを上昇させ、取引を行うことができる瞬間を超えたときに有効と見なされます。 [ インストールガイド | 更新ガイド | トラブルシューティング | よくある質問 | すべての製品 ] クリアな取引シグナル カスタマイズ可能な色とサイズ パフォーマンス統計を実装します カスタマイズ可能なフィボナッチリトレースメントレベル 適切なストップロスおよび利益レベルを表示します インジケーターを使用して、継続パターンまたは反転パターンを見つけることができます 再描画および非再描画ではありません 電子メール/音声/視覚アラートを実装します 123パターン は、継続パターンまたは反転パターンとして現れます。物事を簡単にするために、このインジケーターを使用して、検索するパターンのタイプを選択できるため
Enigmera
Ivan Stefanov
5 (8)
ENIGMERA: 市場の中心 重要:MQL5.comのデモはStrategy Testerで実行されており、Enigmeraの機能を完全には反映していない場合があります。詳細については、説明、スクリーンショット、ビデオをご確認ください。質問があれば、遠慮なくメッセージを送ってください! インジケーターのコードは完全に書き直されました。バージョン3.0は新機能を追加し、インジケーターの開始以来蓄積されたバグを修正しました。 紹介 このインジケーターとトレーディングシステムは、金融市場への注目すべきアプローチです。ENIGMERAはフラクタルサイクルを使用して、サポートとレジスタンスのレベルを正確に計算します。真の蓄積フェーズを示し、方向と目標を提供します。トレンドでも修正でも機能するシステムです。 動作方法 インジケーターのほとんどの機能は、チャートの左側にあるボタンで制御され、市場の状況に迅速に対応できるようになっています。 ボタン ON/OFF – インジケーター全体を表示または非表示にします。 Channel – サポートチャネルを有効にし、許容範囲の偏差を示します。 Dev
Introduction Harmonic Patterns are best used to predict potential turning point. Traditionally, Harmonic Pattern was identified manually connecting peaks and troughs points in the chart. Manual harmonic pattern detection is painfully tedious and not suitable for everyone. You are often exposed under subjective pattern identification with manual pattern detection. To avoid these limitations, Harmonic Pattern Plus was designed to automate your harmonic pattern detection process. The functionality
地震計マーケット クエイク検出器。 Description in English : https://www.mql5.com/en/market/product/113869?source=Site+Market+Product+Page#description How to use the Seismograph : https://www.mql5.com/en/market/product/113869#!tab=comments&page=2&comment=52806941 Create an EA : https://www.mql5.com/en/market/product/113869#!tab=comments&page=3&comment=52816509 どのような取引方法であれ、流動性の低い市場への参入は避けたいものです。 地震計は、市場が上昇する前に市場に参入する適切なタイミングに役立ちます。 しかし、忙しいはずの市場時間帯にエントリーするようにしたにもかかわらず、流動性の低い市場に閉じ込められてしまう人が多いのが実情です。 数時間待った後、
Scalper Vault は、スキャルピングを成功させるために必要なすべてを提供するプロフェッショナルなスキャルピング システムです。このインジケーターは、外国為替およびバイナリー オプションのトレーダーが使用できる完全な取引システムです。推奨される時間枠は M5 です。 システムは、トレンドの方向に正確な矢印シグナルを提供します。また、トップとボトムのシグナルとギャン マーケット レベルも提供します。 インジケーターは、プッシュ通知を含むすべてのタイプのアラートを提供します。 インジケータの購入後にご連絡ください。私の個人的な取引の推奨事項と素晴らしいボーナス指標を無料で共有します! 幸せで有益な取引をお祈りします!
Delta Fusion Pro – 日中取引のための高度なオーダーフロー分析 Delta Fusion Pro は MetaTrader 4 用のプロフェッショナル指標で、アグレッシブな注文フローを明らかにし、機関投資家の圧力の強度と方向をリアルタイムで表示します。従来のボリューム指標とは異なり、Ask と Bid のボリューム差(デルタ)を分析し、反転の予測、トレンドの確認、プロフェッショナルな関心ゾーンの特定を可能にします。 主な特徴 インテリジェント自動調整システム 以下に基づき、すべてのパラメータを自動調整: 銘柄タイプ(FX、暗号資産、指数、コモディティ、株式) 運用タイムフレーム 市場のボラティリティ(ATR) 最近の平均ボリューム 初心者トレーダー向けに手動設定不要 — インジケーターが自動でキャリブレーション! 機能概要 NetDelta と累積デルタ Ask/Bid のアグレッシブボリューム差を計算、カスタマイズ可能な EMA スムージング リアルタイムで方向性圧力を表示 ヒストグラムの色をカスタマイズ(買い/売り) 価格/ボリュームのダイバージェンス 通常お
トレンドラインプロ   市場の真の方向転換点を理解するのに役立ちます。この指標は、真のトレンド反転と主要プレーヤーが再び参入するポイントを示します。 分かりますか     BOSライン   複雑な設定や不要なノイズなしに、より長い時間足でのトレンドの変化と重要なレベルを把握できます。シグナルは再描画されず、バーが閉じた後もチャート上に残ります。 VERSION MT 5     -     RFI LEVELS PRO インジケーター と組み合わせることで、その潜在能力を最大限に発揮します。 インジケーターが示す内容: 本当の変化   トレンド(BOSライン) 一度シグナルが現れたら、それは有効です!これは、リペイント機能を持つインジケーターとの重要な違いです。リペイント機能を持つインジケーターは、シグナルを発した後、それを変更し、資金の損失につながる可能性があります。これにより、より高い確率と精度で市場に参入できます。また、矢印が現れた後、目標値(利益確定)に達するか、反転シグナルが現れるまで、ローソク足の色を変更する機能もあります。 繰り返しエントリ       主要プレーヤーの
The Propfolio Master Suite is the ultimate all-in-one analytical workstation for professional traders. Combining the power of the Beat The Market Maker (BTMM) methodology, Smart Money Concepts (SND/Liquidity), and Advanced Volume Profile, this suite replaces multiple different indicators with one optimized engine. Monitor up to 14 pairs simultaneously from a single chart, instantly identify market cycles, and seamlessly map institutional footprints with the click of a button. The Command Center
このインジケーターは、反転ポイントと価格戻りゾーンを正確に表示します。     主要プレーヤー 。新たなトレンドが形成される場所を把握し、最大限の精度で意思決定を行い、すべての取引をコントロールします。 TREND LINES PRO インジケーターと組み合わせることで、その潜在能力を最大限に発揮します。 VERSION MT5 インジケーターが示す内容: 新しいトレンドの始まりに活性化する反転構造と反転レベル。 リスクと報酬の比率を最小限に抑えた利益 確定 と 損失停止の レベルの表示     RR 1:2   。 インテリジェントな削減ロジックによるストップロス。 指定されたインジケーターから 2 つのトレンド タイプの反転パターンを表示します。 指標: トレンドを追う   TREND LINES PRO   (世界的なトレンドの変化) TREND PRO   (クイックトレンド変更) シンプルで効果的   スキャナー   リアルタイムトレンド(新機能)。 マルチタイムフレームのインストゥルメント フィルタリング。 画面   利益     LOGIC AI信号の後。 当日プラス方
現在40%オフ! 初心者やエキスパートトレーダーに最適なソリューション! このインジケータは、独自の機能と秘密の数式を組み込んだ、ユニークで高品質かつ手頃な価格のトレーディングツールです。たった1枚のチャートで28の通貨ペアのアラートを表示します。新しいトレンドやスキャルピングチャンスの引き金となるポイントを正確に把握することができるので、あなたのトレードがどのように改善されるか想像してみてください! 新しい基本的なアルゴリズムに基づいて構築されているため、潜在的な取引の特定と確認がより簡単になります。これは、通貨の強さや弱さが加速しているかどうかをグラフィカルに表示し、その加速のスピードを測定するためです。加速すると物事は明らかに速く進みますが、これはFX市場でも同じです。つまり、反対方向に加速している通貨をペアにすれば、利益を生む可能性のある取引を特定することができるのです。 通貨の勢いを示す縦の線と矢印は、あなたの取引の指針となるでしょう。 ダイナミックマーケットフィボナッチ23レベルはアラートトリガーとして使用され、市場の動きに適応します。もしインパルスが黄色のトリガ
フィルタ:
レビューなし
レビューに返信