Mirror Candles MT5
- インディケータ
- Kaijun Wang
- バージョン: 1.0
- アクティベーション: 5
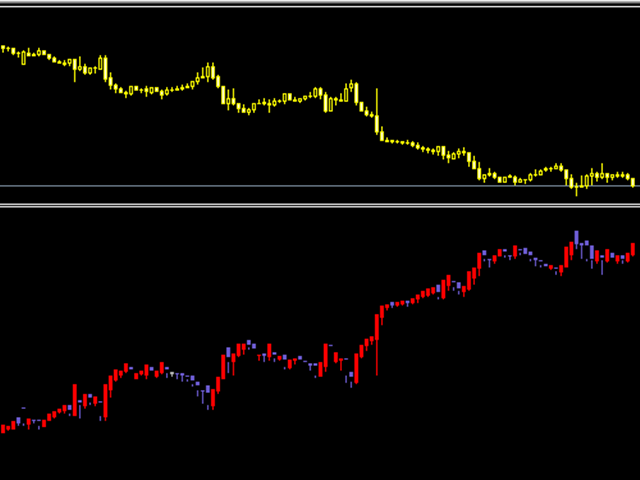
反转K线指标!
指标将主图的K线在副图中进行反转显示.
交易实用必备工具指标
| 波浪自动计算指标,通道趋势交易 | 完美的趋势-波浪自动计算通道计算 , MT4版本 | 完美的趋势-波浪自动计算通道计算 , MT5版本 |
| 本地跟单复制交易 | Easy And Fast Copy , MT4版本 | Easy And Fast Copy , MT5版本 |
| 本地跟单复制交易 模拟试用 | Easy And Fast Copy , MT4 模拟账号运行 | Easy And Fast Copy , MT5 模拟账号运行 |
The indicator of the attached figure shows that it is a mirror image of the candlestick chart of the main chart.
The ordinate of the figure indicator is mirrored with the main image, and the coordinate value is a negative number.
For graphic reference only.