RealCryptoLevels MT4
- インディケータ
- バージョン: 1.98
- アップデート済み: 1 6月 2021
- アクティベーション: 10

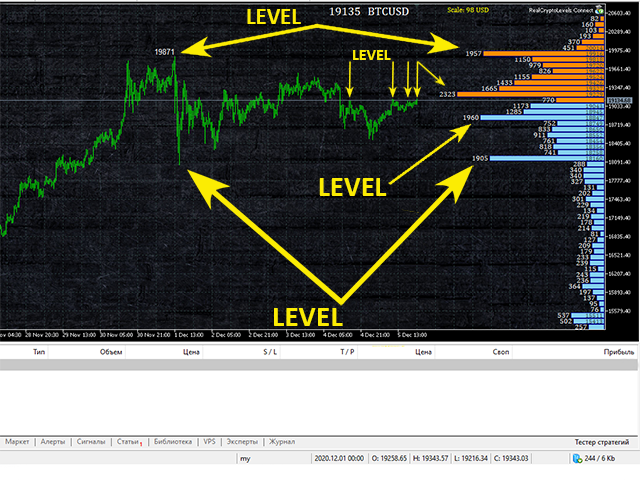
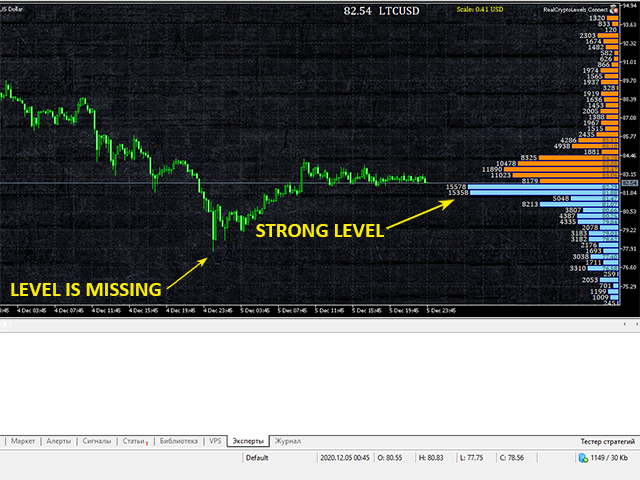
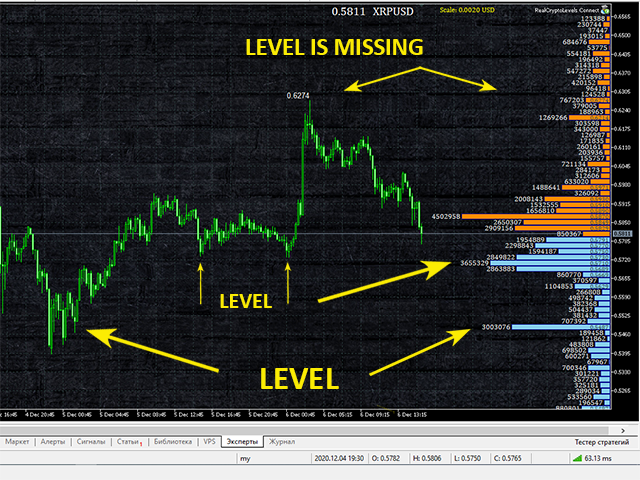
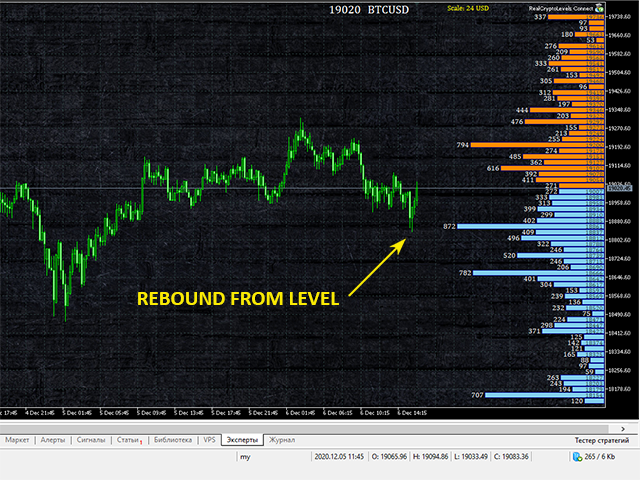
The RealCryptoLevels indicator by downloading the order book of crypt exchanges with maximum depth shows horizontal volumes of popular crypto currencies on the chart, so you can see not only the volumes, but also the levels and them strength (see screenshots), which is very important for successful trading in all strategies from scalping to medium-term trading, because you can see the preferences of buyers and sellers at the moment and their mood for the future. The indicator pulls volume data directly from the largest cryptographic exchanges with the maximum depth of the order book, so the levels are not fictional, as some indicators draw, but the real ones on which successful trading can be built.
The indicator is an analogue of the tradefuck.net service, only with a convenient display of volumes and levels directly on the chart.
MT5 version of indicator: https://www.mql5.com/ru/market/product/58822
Connected Exchanges: Bitstamp, Binance, Bitfinex, HitBTC, Bitmex, Kraken (several more exchanges will be connected in the near future).
Supported crypt currency pairs: BTCUSD, XRPUSD, ETHUSD, LTCUSD, EOSUSD, BHCUSD (soon to be more).
Since the indicators can not connect to the Internet to do this you need to install RealCryptoLevels Connector and add the listed addresses in the terminal settings to allow connection to the cryptocurrency exchanges:
Crypto exchanges limit the frequency of connections to them for information, so do not clamp this indicator on many charts or reduce the refresh rate of the indicator in the connector settings. If you exceed the number of requests for a short period of time, the exchange may use a temporary ban from five minutes to several hours or even a few days in special cases. You can download a free connector and check the connection to the exchanges before you buy the indicator. If you have problems connecting to exchanges, write to me to solve the problem. If a symbol is not recognized on the chart (different brokers may name symbols differently), then select a symbol in the connector settings.
If you have any questions, comments or suggestions, please write to me in a personal message on the site or in a group https://www.mql5.com/ru/messages/01003B472665D701