Pivot Trading pp trading for mt5
- インディケータ
- Kaijun Wang
- バージョン: 1.66
- アップデート済み: 10 7月 2023
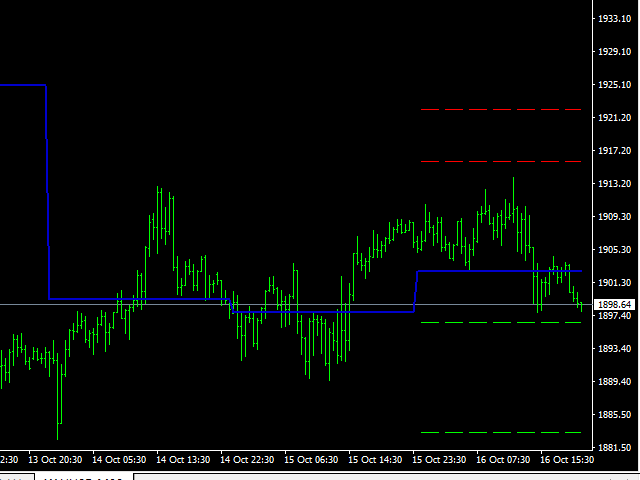
ピボット取引:
1.ppピボット
2. r1 r2 r3、s1 s2 s3
Necessary for traders: tools and indicators
| Waves automatically calculate indicators, channel trend trading | Perfect trend-wave automatic calculation channel calculation , MT4 | Perfect trend-wave automatic calculation channel calculation , MT5 |
| Local Trading copying | Easy And Fast Copy , MT4 | Easy And Fast Copy , MT5 |
| Local Trading copying For DEMO | Easy And Fast Copy , MT4 DEMO | Easy And Fast Copy , MT5 DEMO |
協力QQ:556024 "
協力wechat:556024 "
協力メール:556024@qq.com」
プロのEAインジケーターの書き込み。
ピボットポイントは長い間取引戦略であり、もともとはフロアトレーダーによって使用されていました。この方法を使用すると、いくつかの簡単な計算を通じて、市場が1日でどこに向かっているのかを理解できます。
ピボットポイント方式のピボットポイントは、日中の市場方向の転換点であり、前日の高値、安値、終値を計算するだけで一連のポイントが得られます。これらのポイントは、重要なサポートラインとレジスタンスラインを形成する場合があります。ピボットポイント、サポート、および抵抗レベルは、まとめてピボットレベルと呼ばれます。
表示される市場には、毎日、始値、高値、安値、終値があります(通常、開店時間と閉店時間として午後5時ESTを使用する外国為替市場など、24時間営業の市場もあります)。この情報には、ピボット方式を使用するすべてのデータが含まれています。
ピボットポイント方式は、遅延するのではなく予測できるため、非常に人気があります。前日のデータを使用して、取引日(現在の取引日)のターニングポイントを計算できます。
ピボット方式で取引するトレーダーが多いため、これらの重要なポジションで市場が反応していることがわかります。これはあなたに取引の機会を与えます。
ピボットポイントは日中の取引方法であり、非常にシンプルで実用的です。非常に「シンプルな」レジスタンスサポートシステムです。約10年前に先物の達人によって発明された方法です。株式、先物、国債、インデックスで広く使用されています。大量の商品について。従来のピボットポイントは7ポイントシステムで、7つの価格で構成されています。現在広く使用されている13ポイントシステムは実際には同じですが、大量の商品に使用される6つの価格が追加されています。


Great indicator! Works really well