バージョン 4.0
2024.08.22
Top-Rated Suppy and Demand Dashboard in the Market.
We've made significant improvements to enhance your trading experience.
Update now—it's free!
バージョン 3.9
2024.07.08
We are thrilled to announce the release of version 3.9 of our top-rated Supply and Demand Dashboard, packed with powerful new features to enhance your trading experience!
New Features and Enhancements:
Added a Quick Access Button: I've added a convenient button that allows you to quickly open a chart with the symbol and timeframe of the latest signal. This new button is prominently displayed at the top of the sub-window for easy access.
Improved Chart Integration: For seamless chart management, we recommend opening the signal in a target chart. Simply go to the "Other Settings 1" in the input list and set "Charts open in new window" to true. Once the target chart is open, re-add the dashboard with your customized settings, but setting the symbol list to 0 and "Popup Alerts" to false.
Happy trading and kill the market!
バージョン 3.8
2024.06.25
Best-Rated Supply and Demand Dashboard in the Market! Now Featuring Enhanced Detection for Gold and Indices!
**Update Now to the Latest Version!**
We are excited to introduce the latest update for our highly acclaimed Supply and Demand DASHBOARD PRO. This new version brings several significant enhancements designed to improve your trading experience:
**Compatibility Improvements:** Optimized for the latest Metatrader version, ensuring seamless functionality and better performance.
**Advanced Zone Detection:** Improved detection of nested supply and demand zones, providing more accurate and reliable data for better trading decisions.
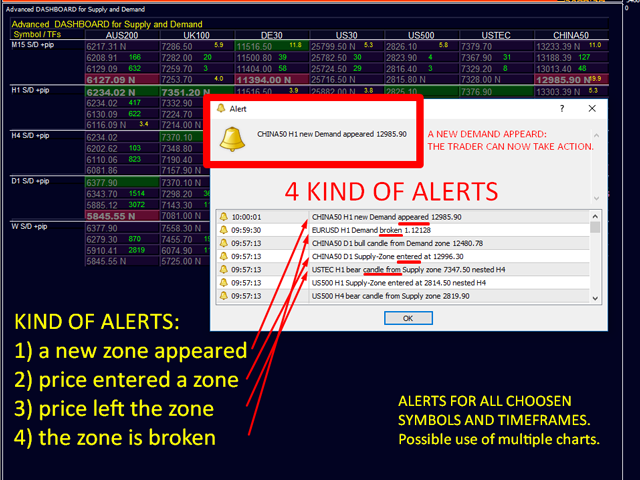
**Enhanced Alerts:** Four special alerts are now included:
- A new zone appeared.
- Price entered a zone.
- Price left the zone.
- The zone is broken.
**Graphic Dashboard:** Now includes an extra arrow to move the table if needed for better visualization and customization.
Don't miss out on these enhancements! Keeping your indicators up to date ensures you benefit from the latest features and improvements. Updating is free, simple, and guarantees you always have the best tools at your disposal.
Thank you for your continued support and trust in our products.
**Get the Latest Version Now!**
---
For more details and to download the update, visit:
https://www.CurrencyStrength28.com
バージョン 3.7
2024.04.25
Best rated Supply and Demand Dashboard in the Market.
Important improvements.
Please update.
バージョン 3.6
2024.02.21
Various improvements for new Metatrader version.
バージョン 3.5
2023.12.26
Unlock Your Trading Potential with the Latest Upgrade!
Seize the opportunity for a trading revolution! Elevate your strategies with the latest enhancements to the Supply and Demand DASHBOARD PRO. Upgrade now and trade with newfound confidence. Don't miss out on these essential improvements—your journey to successful trading begins here.
バージョン 3.4
2023.10.25
We've just released an exciting update for our indicator, packed with enhancements that take your trading to the next level.
Upgrading your indicator is a smart move. It ensures you're leveraging the latest features, giving you a competitive edge in the market. Don't miss out!
Should you have questions or need help with the update, our team is here for you. Reach out anytime; we're committed to your success.
www.CurrencyStrength28.com
バージョン 3.3
2023.08.24
Upgrade to Version 3.3 for Enhanced Trading Insights
+ We're thrilled to introduce Version 3.3, featuring the industry's highest-rated Supply and Demand DASHBOARD PRO. Elevate your trading strategy with this powerful tool, designed to help you identify critical price reversal areas.
+ What's New in Version 3.3:
- Seamlessly compatible with the latest Metatrader version.
- Empowered by advanced algorithmic enhancements, offering unparalleled accuracy in Supply and Demand multi-timeframe analysis.
+ Don't miss out on these exciting updates. Keep your indicators up to date effortlessly and at no cost. By staying current with our latest version, you're ensuring that your trading arsenal remains at the cutting edge of the market.
+ Upgrade to Version 3.3 now and access the best-rated Supply and Demand DASHBOARD PRO available. With the new Price Label feature, trading on higher timeframes becomes even more insightful. Join the community of savvy traders who are enhancing their strategies with our free, top-notch tools.
バージョン 3.2
2023.06.25
We are thrilled to announce the highly anticipated release of Version 3.2 of our Supply and Demand Dashboard PRO – the top-rated tool for traders like you. With its advanced capabilities, this powerful indicator will revolutionize your trading strategy by identifying critical price reversal areas, giving you a significant edge in the market.
Discover the latest enhancements we have made to ensure seamless compatibility with the newest Metatrader version. By upgrading to Version 3.2, not only do you gain access to cutting-edge features, but you also stay ahead of the competition. And the best part? These updates are completely free, so you can maximize your trading potential without any additional cost.
Upgrade now to Version 3.2 and experience firsthand the unparalleled benefits of our top-rated Supply and Demand Dashboard PRO. Take control of your trading journey, make informed decisions, and elevate your profitability. Don't miss out on this opportunity to improve your trading strategy – all for free.
バージョン 3.1
2023.04.23
We're excited to announce the release of Version 3.1, featuring the best-rated Supply and Demand Zone Dashboard on the market. This powerful tool helps you spot key areas of price reversal, giving you an edge in your trading strategy.
Our team has made various improvements to ensure compatibility with the latest Metatrader version, so you can take advantage of new features and stay ahead of the competition. Plus, keeping your indicators up to date is completely free and ensures that you're always using the most advanced tools available.
Upgrade now to Version 3.1 and experience the benefits of our best-rated Supply and Demand Zone Dashboard. Stay ahead of the competition and improve your trading strategy with the latest updates, all for free.
バージョン 3.0
2023.02.20
Please update to Version 3.0 of the Supply and Demand Zone Dashboard Indicator, the best rated indicator of its kind in the market, with various improvements.
Some traders have reported that the zones in smaller time frames can be overlapped by the full rectangle of the current time frame. We have found a solution to this issue.
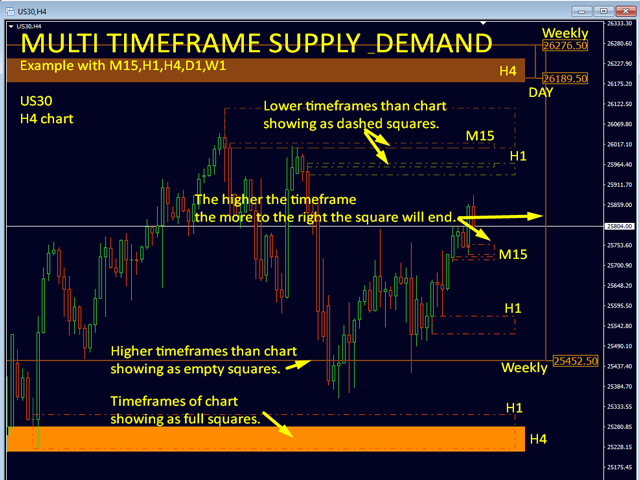
Now, you can choose to display the current time frame zone as an empty rectangle with a thicker border, so that the zones in smaller time frames are still visible.
There are two new input parameters available:
Full Rectangles Current Chart TF (default = true)
Rectangle Width Current TF (if not full 1-5) (default = 5)
We have not changed the previous display, so if you want to use the new function, you need to set the "Full Rectangles Current Chart TF" parameter to "false".
バージョン 2.9
2022.12.31
This is a small adjustment to yesterday's version with the new buttons.
This allows a practical navigation through the dashboard.
バージョン 2.8
2022.12.30
Added more improvements.
Updating is recommended.
2 buttons have been added to move the dashboard right/left or up/down. There may be symbols outside the visible chart if there are many symbols used. A click on the button will move the diagram by a number of rows or columns.
New input added:
+ Scroll number of rows list (1-10)
バージョン 2.7
2022.12.19
Various improvements.
Please update.
バージョン 2.6
2022.10.23
Various improvements.
Please update.
バージョン 2.5
2022.08.20
A useful feature has been added at the request of a trader.
It is possible for a trader to only have preferences for only buying or selling an instrument. Choose the alarms you want to set. The graph and alert for "entering a zone" and "new zone appearing" remain unaffected.
==== General Alert Settings ====
New input:
+ Traders preference alerts buy-sell-both
There was an issue with M1-alerts that has been fixed.
Please update.
バージョン 2.4
2022.07.02
Various improvements for new Metatrader version.
バージョン 2.3
2021.09.19
IMPORTANT UPDATE !!!
Due to new Metatrader versions, we need a corrective input to draw objects in a subwindow. If you use MT4 build 1341+, add the subwindow number (1 for the first subwindow, 2 for the second...). 0 means automatic.
New input at the end of the list:
+ Force objects to subwindow number (0=auto)
バージョン 2.2
2021.06.02
Various improvements.
バージョン 2.1
2021.04.25
Various improvements.
バージョン 2.0
2020.10.22
MAJOR UPDATE 2020
==================
Added optional: Supply and Demand zones with ENGULFING BARS pattern at the beginning of the zone.
Use reversal candle color for bar 1 or bar 2 (the one before). Use either one or both.
Use a true engulfing pattern for the above-mentioned bars. (Must choose above.)
By default the use is false. To use the function you must set the new inputs = true (The selection is copied to all timeframes).
New inputs:
==== Candle pattern
+ use reversal candle color bar 1
+ use reversal candle color bar 2 (both or either)
+ use true engulfing pattern (choose above)
MODIFICATION FOR ZONE SIZE
It was added optionally: Including a wick for the width of the supply and demand zones.
New input:
+ Include wick 1 for the zone size
By default, the function is not used. To use the function, you must set the new input = true (The selection is copied to all timeframes).
Since the zones will be wider, some zones could be filtered. You may want to use lower XY factors.
バージョン 1.9
2020.10.16
Various improvements.
バージョン 1.8
2020.06.23
Various improvements.
Optimized signal export to EAs.
バージョン 1.7
2020.05.21
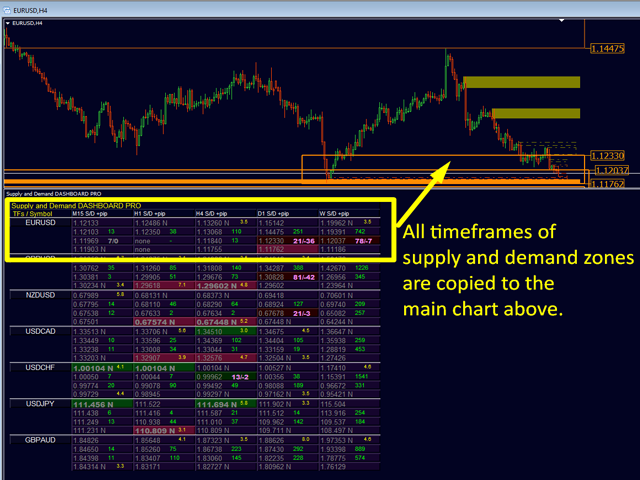
New graphical feature added. We organize different time frames. Now you can display all time frame names on the right side of each square.
New input:
+ display all TF names right
バージョン 1.6
2020.01.16
Various improvements.
バージョン 1.5
2019.05.30
A new filter for alerts has been added to do alerts only if the zone is new or untouched. (Excluding break alert.)
New input:
+ alert only new zones (excluding breaks) (default = false)
To activate the filter set above input to true.
If false, the info will anyway be included into the alerts.
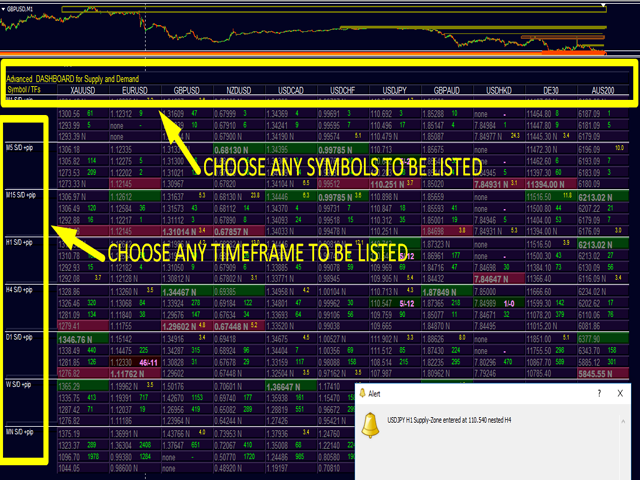
Example Alert: EURUSD H4 Demand-Zone (untested) entered at 1.11333 nested D1
バージョン 1.4
2019.04.23
Added a description on chart for higher S/D zones to know better the timeframe.
And diverse other improvements.
バージョン 1.3
2019.04.08
Made some changes to minimum Zone Drop to be align with Advanced Supply Demand indicator.
バージョン 1.2
2019.04.07
Re-activated the function for pivot and yesterdays high-low-open lines.
バージョン 1.1
2019.04.06
Added a message print on screen for last alert with time of alert.
You can choose if the time shows broker time or your PC time.
New input
+ Last Signal time is Local or broker time
Added an option to show less digital points.
New input
+ show prices with less digits (0-2) (0=all digits)








I really like the indicators! Actually i use 4 of them and they work really well together! I had a lot of questions as i use a bit different strategy.but i got all the help! Thank you!