Advanced Currency Impulse with Alert MT5
- インディケータ
- Bernhard Schweigert
- バージョン: 7.0
- アップデート済み: 30 3月 2024
- アクティベーション: 5
初心者やエキスパートトレーダーに最適なソリューション!
このインジケータは、独自の機能と秘密の数式を組み込んだ、ユニークで高品質かつ手頃な価格のトレーディングツールです。たった1枚のチャートで28の通貨ペアのアラートを表示します。新しいトレンドやスキャルピングチャンスの引き金となるポイントを正確に把握することができるので、あなたのトレードがどのように改善されるか想像してみてください!
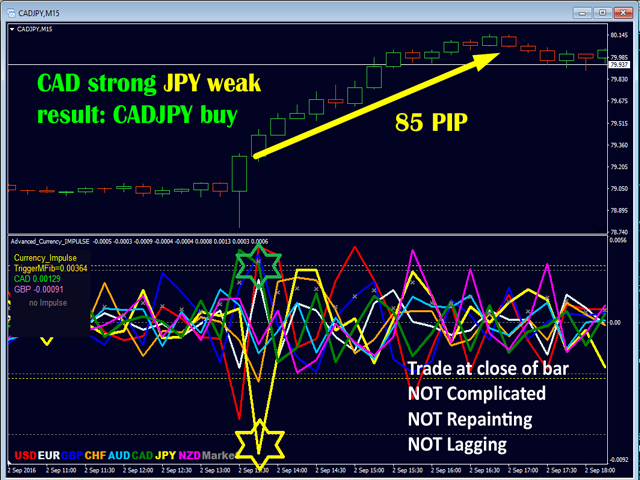
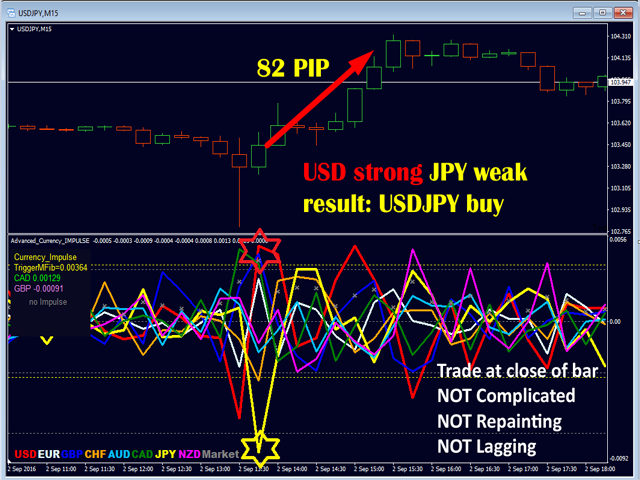
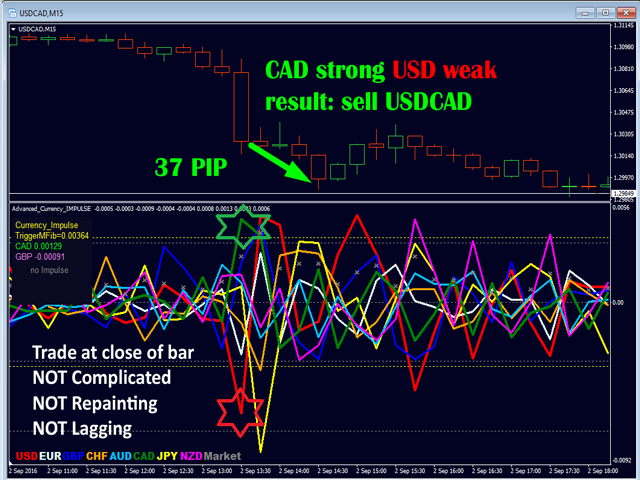
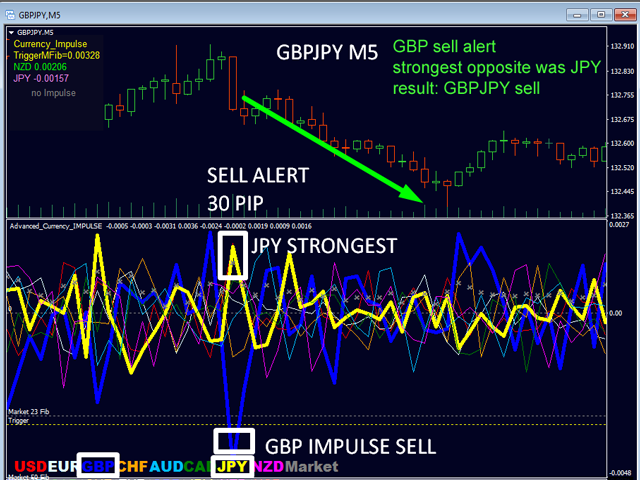
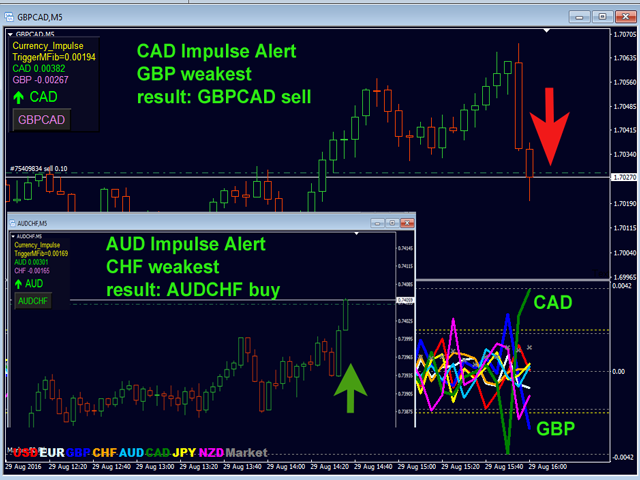
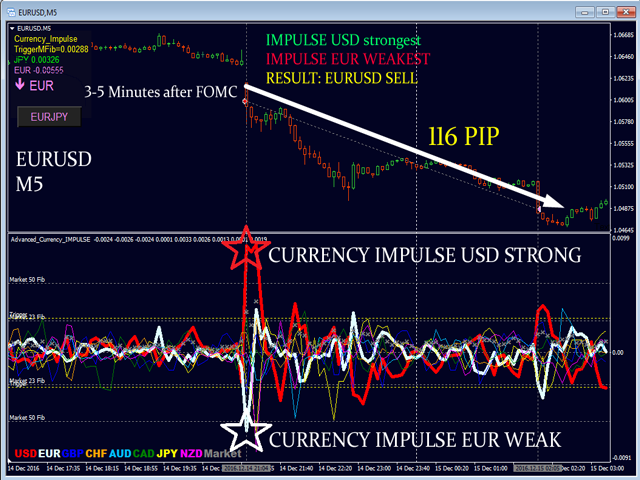
新しい基本的なアルゴリズムに基づいて構築されているため、潜在的な取引の特定と確認がより簡単になります。これは、通貨の強さや弱さが加速しているかどうかをグラフィカルに表示し、その加速のスピードを測定するためです。加速すると物事は明らかに速く進みますが、これはFX市場でも同じです。つまり、反対方向に加速している通貨をペアにすれば、利益を生む可能性のある取引を特定することができるのです。
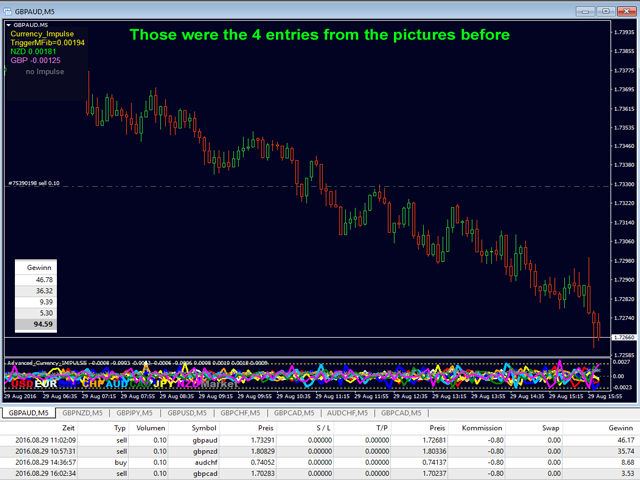
通貨の勢いを示す縦の線と矢印は、あなたの取引の指針となるでしょう。
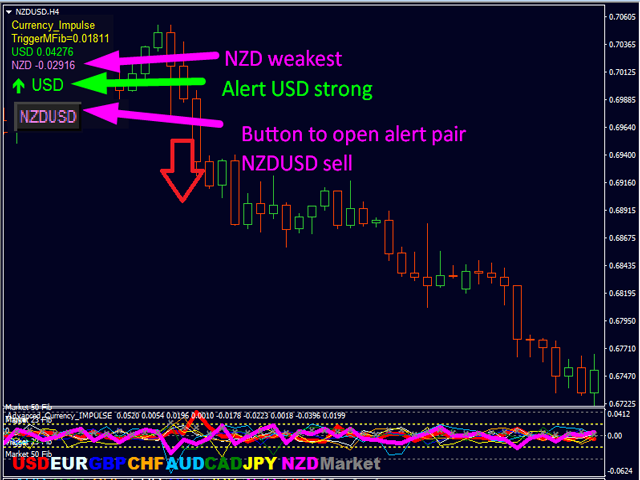
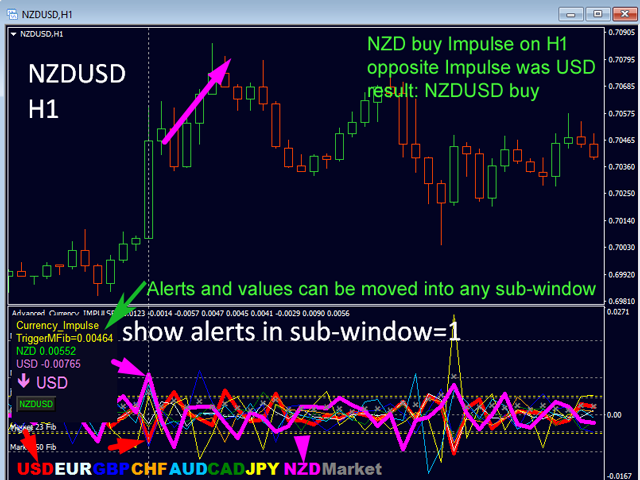
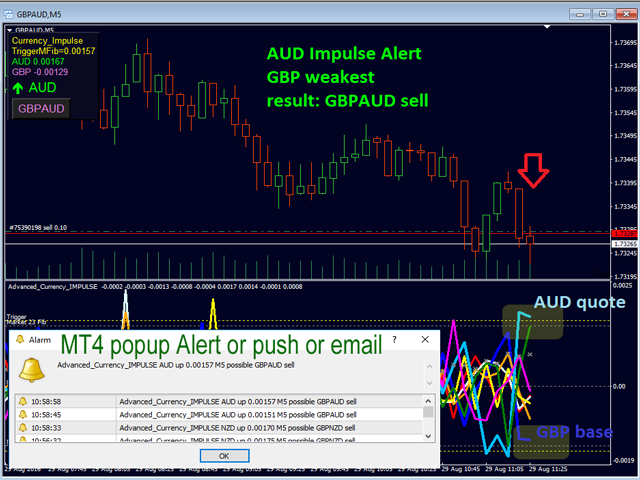
ダイナミックマーケットフィボナッチ23レベルはアラートトリガーとして使用され、市場の動きに適応します。もしインパルスが黄色のトリガーラインに当たった場合、MetaTrader上でアラートを受信するか、Eメールまたはプッシュアラートを受信します。そして、トレーダーは何をすべきかを知ることができます。ペアと方向はすでに与えられています。アラートボタンをクリックすると、そのペアに切り替わるか、さらなる分析のために新しいチャートが開かれます。アラートレベルはユーザー入力により変更可能で、3つの感度レベルを選択することができます。
新しいトレンドの初期化トリガーをいち早くキャッチ! この加速と減速はスイングトレーダーとスキャルパーの両方が使用することができます。スイングトレーダーには新しいトレンドがいつ発生したかを示し、スキャルパーにはどのペアが動き出すかを示します。私たちの顧客と私たち自身の経験から、この2つの指標はとてもうまく機能するので、まさに1+1=3のケースであることを知っています!
インジケーターパラメーター ユーザーマニュアルにある完全なリストを参照してください! https://www.mql5.com/en/blogs/post/697135
- インパルス感度 - Slow/Medium/Fast.
- ライン幅ベースとクォートCS - チャートの通貨を太くする。
- ...
アラート設定
- CS-Impulse Trigger at market Fib (higher=stronger).
- V-LineのGAP値(高ければ高いほど強い)。
- インパルスアラートの矢印を描く。
- ... その他
ヒント
- 私のテンプレートを使ってください。
- Alertトリガー値は、SettingsのMarket Fibonacci Levelで編集可能です。任意の数値を設定できます。デフォルトは25です。黄色の線はチャート上のレベルを示しています。
- そして、インパルス値の最高値と最安値の数字が表示されます。
- 続いて、トリガー値に到達した通貨が表示されます(ある場合)。
- そして、提案されたペアを示すボタンがポップアップします。それをクリックすると、チャート上のペアが変更されます。条件を満たさなくなった場合、ボタンが変わったり消えたりすることがあります。それでも、チャートを見ることはできます。
- インジケーターを中断したくない場合は、「新しいウィンドウでチャートを開く」を使用してください。
- 取引システムと取引例については、プロフィールの私のニュースやブログをチェックしてください。
- 完全なトレーディングシステムを勉強する。
- プライベートメッセージを送る。より多くの情報、リンク、テンプレートのためのスターターパックメールをリクエストしてください。私はあなたに成功して欲しいのです。
質問があれば、いつでもお手伝いします。
将来、多くのグリーンピップが得られるように祈っています。
自動的に翻訳されます! 英語のオリジナルはここをクリック https://www.mql5.com/en/market/product/22899


very good thank you bernhard