Advanced Currency Impulse with Alert MT5
- 指标
- Bernhard Schweigert
- 版本: 7.0
- 更新: 30 三月 2024
- 激活: 5
对任何新手或专家交易者来说都是最好的解决方案!
这个指标是一个独特的、高质量的、负担得起的交易工具,因为我们已经纳入了一些专有的功能和一个秘密的公式。只需一张图表,它就能给出所有28种货币对的警报。想象一下,你的交易将如何改善,因为你能够准确地确定新趋势或剥头皮机会的触发点
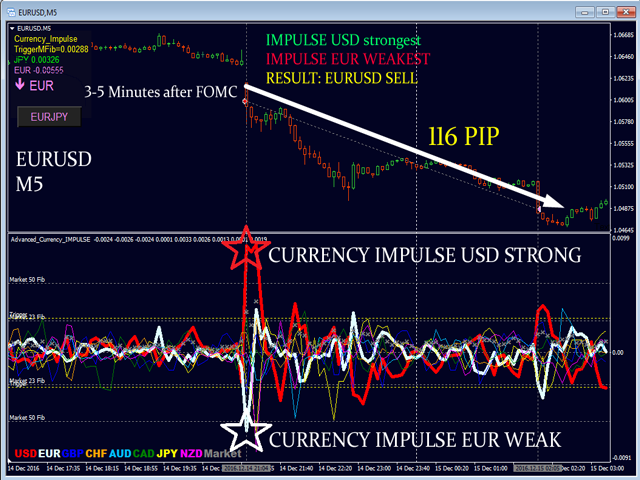
建立在新的基础算法上,它使识别和确认潜在交易变得更加容易。这是因为它以图形方式显示了一种货币的强势或弱势是否正在加速,并测量了这种加速的速度--把它想象成你汽车中的速度表。当你加速时,事情显然会发生得更快,这在外汇市场上也是一样的,即如果你配对的货币正在向相反的方向加速,你就会发现一个潜在的有利可图的交易。
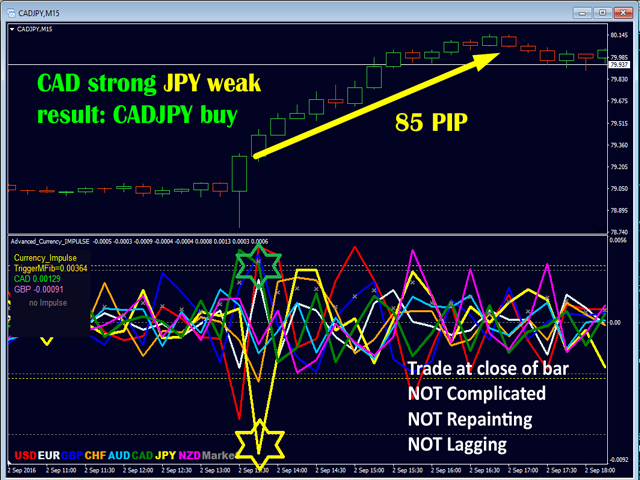
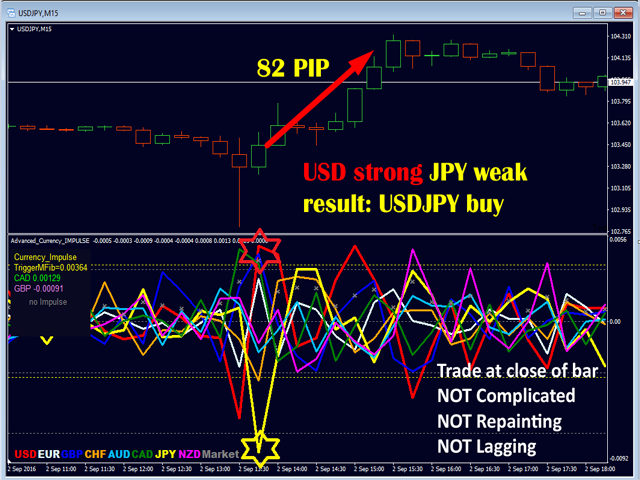
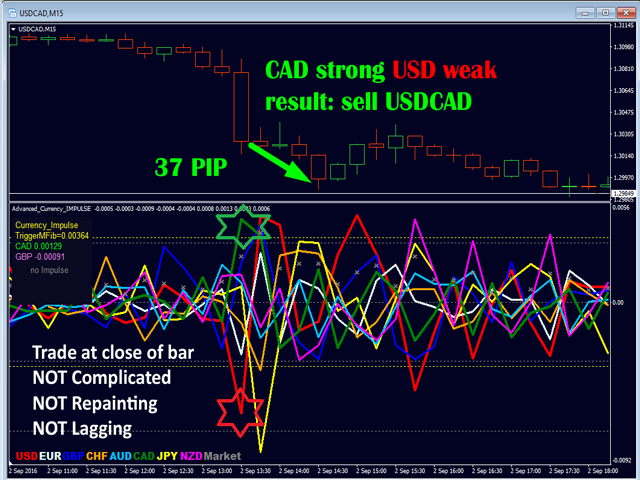
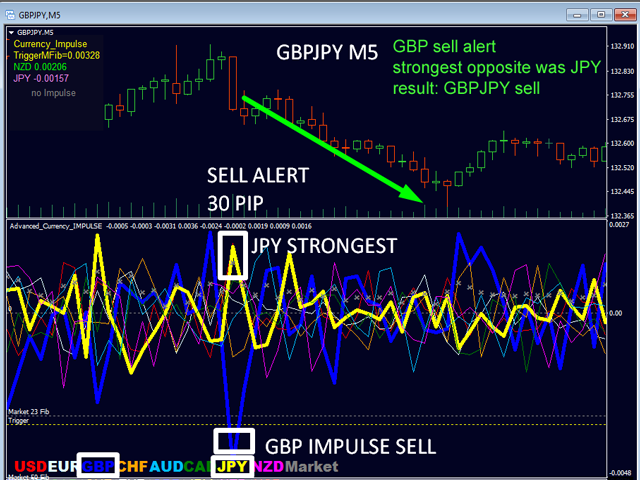
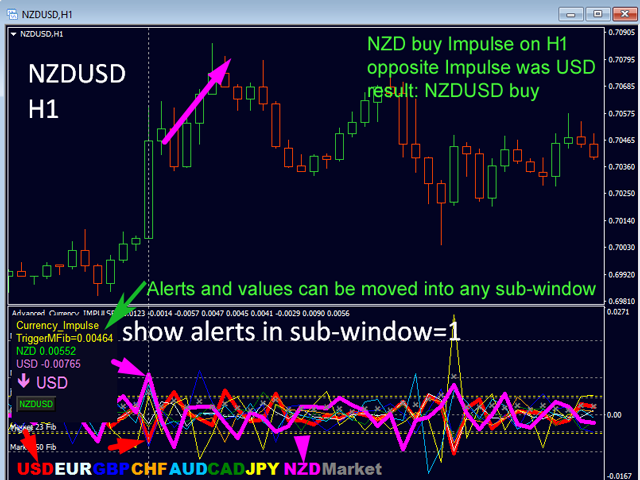
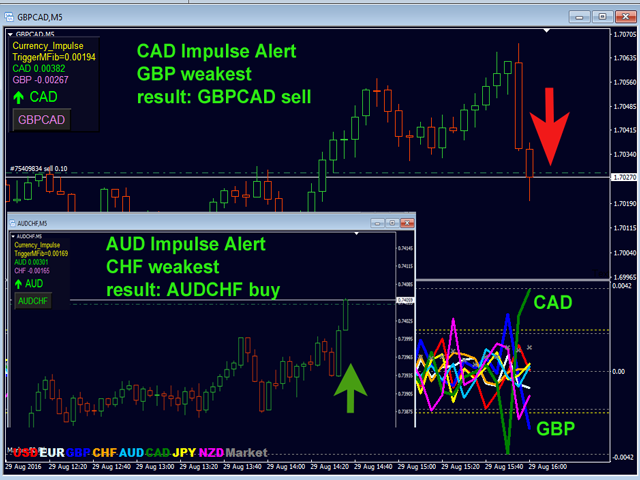
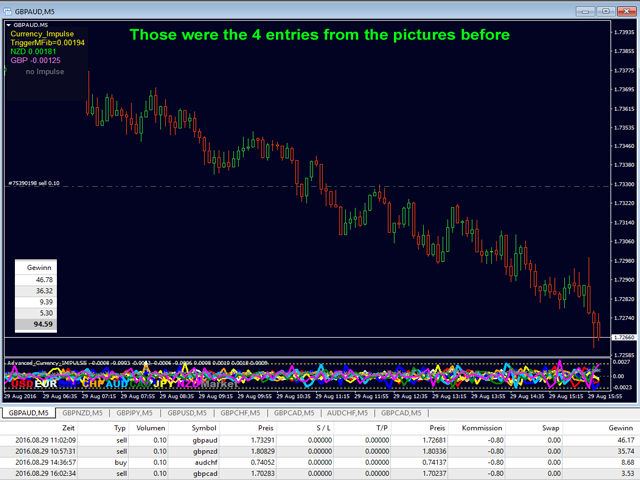
货币动量的垂直线和箭头将指导你的交易!
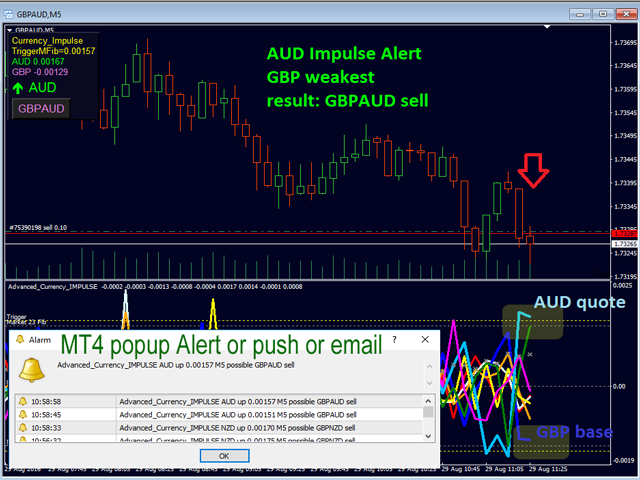
动态的市场斐波那契23水平被用作警报触发器,将适应市场活动。如果冲动触及黄色触发线,您将在MetaTrader或您的电子邮件或推送警报中收到警报。然后你就知道作为一个交易员应该做什么。货币对和方向已经给出。只要点击警报按钮,就可以切换到该货币对或打开一个新的图表,以便进一步分析。警报级别可以通过用户输入来改变,可以选择3个敏感度级别。
尽早获得新趋势的初始化触发! 这种加速和减速可以被波段交易者和剥头皮者使用。对波段交易者来说,它显示了新趋势何时被触发,对剥头皮者来说,它显示了哪些货币对将会有运动。从我们的客户和我们自己的经验来看,我们知道这两个指标配合得非常好,这确实是一个1+1=3的案例!
指标参数 参见用户手册中的完整列表! https://www.mql5.com/en/blogs/post/697135
- 脉冲敏感度 - 慢/中/快。
- 线宽基数和报价CS--使图表中的货币更厚。
- ...
警报设置
- CS-脉冲触发器在市场的Fib(越高=越强)。
- V型线的GAP值(越高=越强)。
- 脉冲警报的箭头。
- ...以及其他 https://www.mql5.com/en/blogs/post/697135
提示
- 使用我的模板。
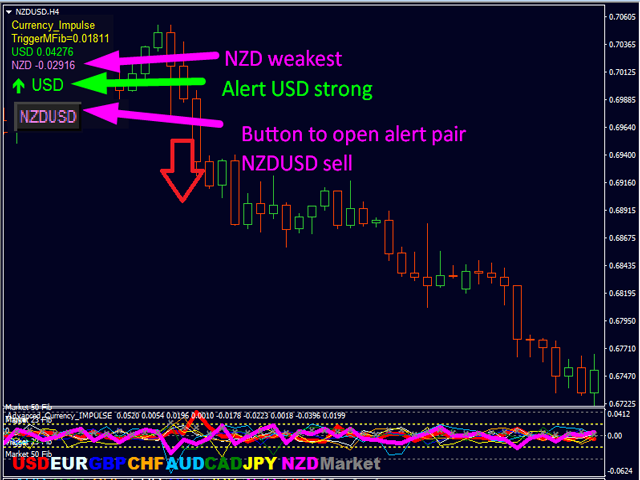
- 警报触发值可以在设置中的任何市场斐波那契水平进行编辑。它可以是任何数字。默认是25。黄线显示了图表上的水平。
- 然后我们看到最高和最低的脉冲值的数字。
- 紧接着是达到触发值的货币(如果有的话)。
- 然后会弹出一个按钮,上面有一个建议的货币对。通过点击它,它将改变图表上的货币对。如果不再满足条件,该按钮可能会改变或消失。不过,你还是可以看一下图表。
- 如果你不想中断指标,请使用 "在新窗口中打开图表"。
- 查看我的新闻和博客,了解交易系统和交易实例。
- 研究完整的交易系统。
- 给我发一条私人信息。要求获得更多信息、链接和模板的入门包邮件。我希望你能成功!
如果你有任何问题,我将随时帮助你。
我祝愿你在未来有很多绿色的点。
自动翻译! 英文原文请点击这里 https://www.mql5.com/en/market/product/22899


very good thank you bernhard