Obaforex Three Phase Map MT5
- インディケータ
- バージョン: 1.0
- アクティベーション: 5

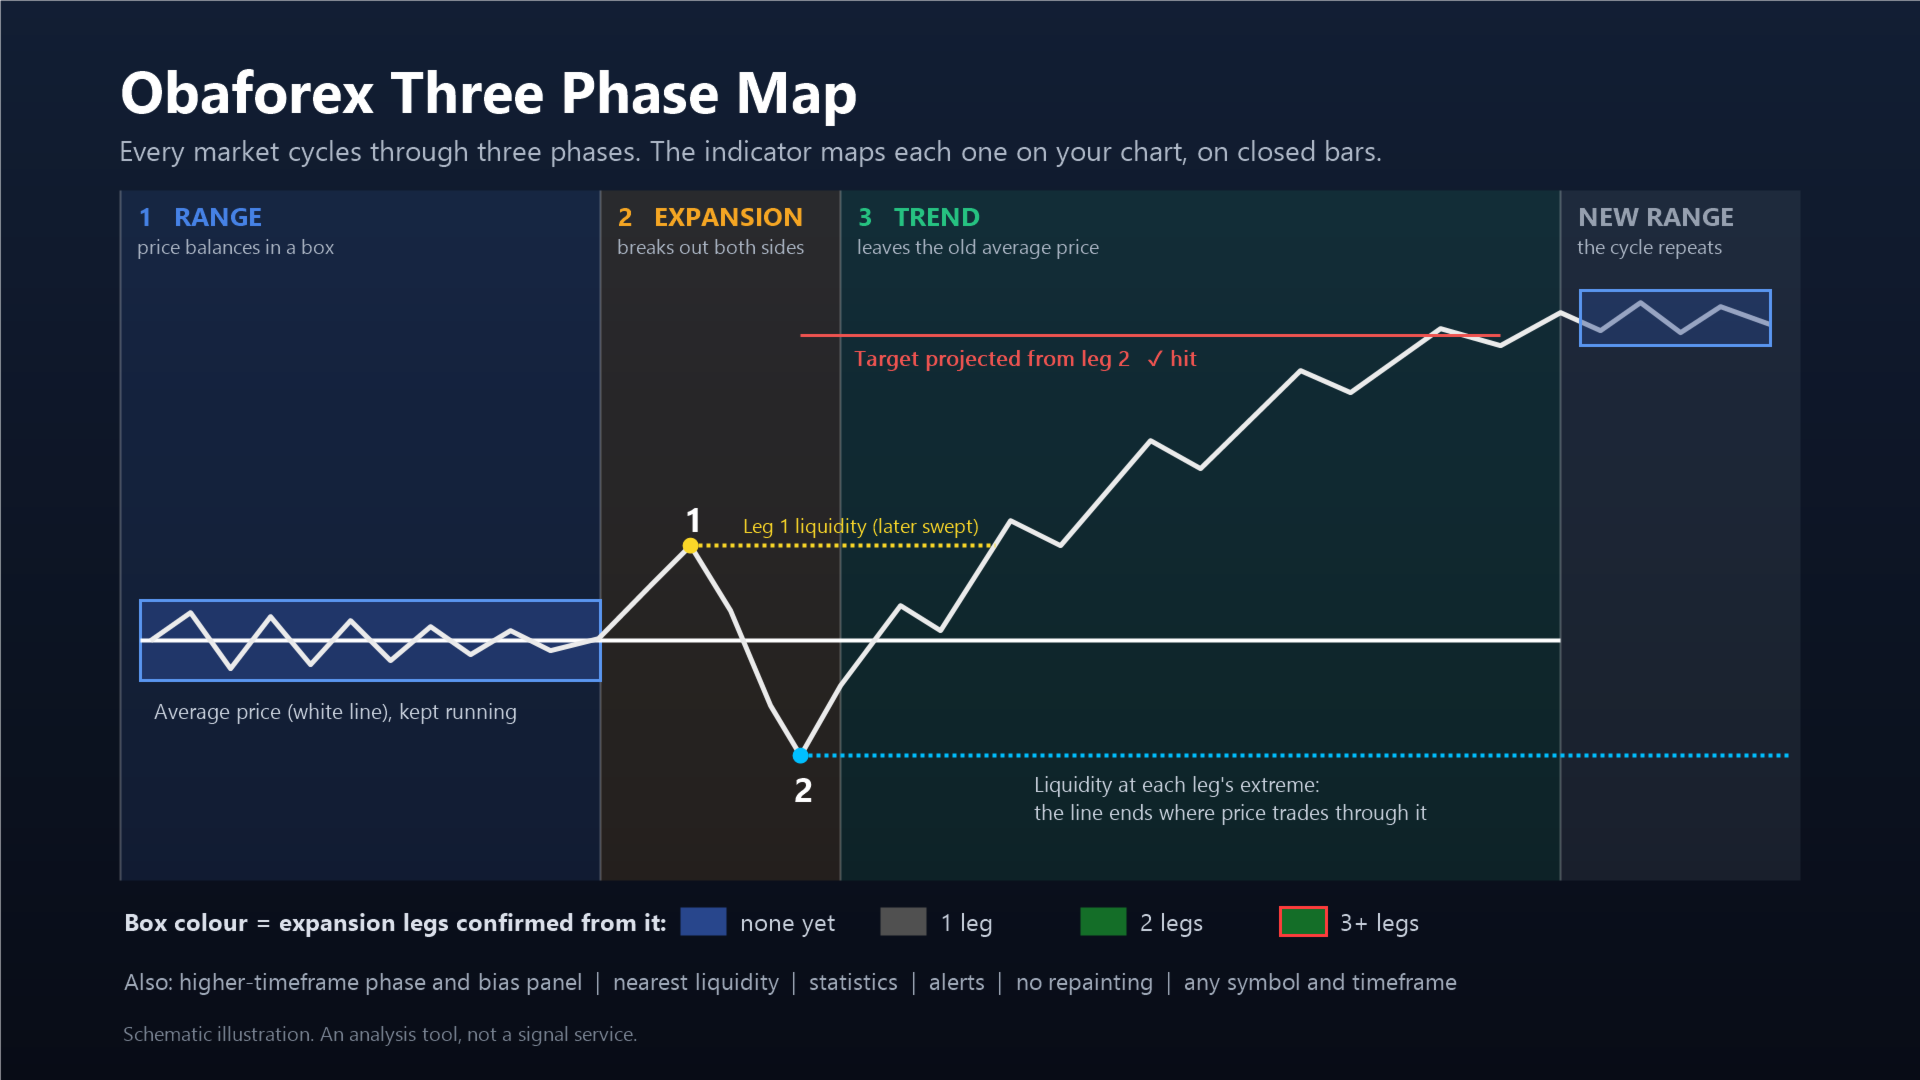
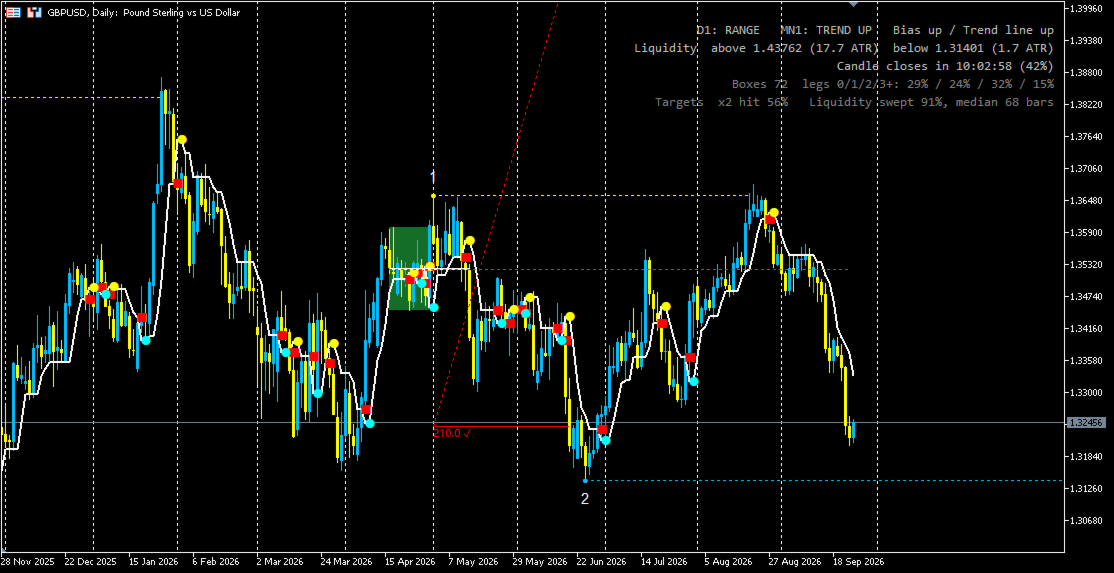
Obaforex Three Phase Map maps the master pattern (forex master pattern) market cycle on any chart similar to the Action Threshold Software (ATS): contraction (range), expansion and trend, the three phases every market repeats. It draws the contraction boxes, the average price (value) line, numbered expansion legs, liquidity lines and projected targets, with a higher-timeframe panel. It works on forex, gold, indices and crypto, on any timeframe, and does not repaint.
It shows you which of the three market phases price is in, on any symbol and timeframe:
- Range (contraction). Price tightens and balances. The indicator draws the range as a box.
- Expansion. Price leaves the box and explores both sides. Traders get whipsawed here.
- Trend. Price moves away from its old average and settles at a new level. The cycle then starts again.
Every bar belongs to one of these phases. The indicator maps them for you on closed bars, so what you see in history is exactly what you would have seen live.
What it draws
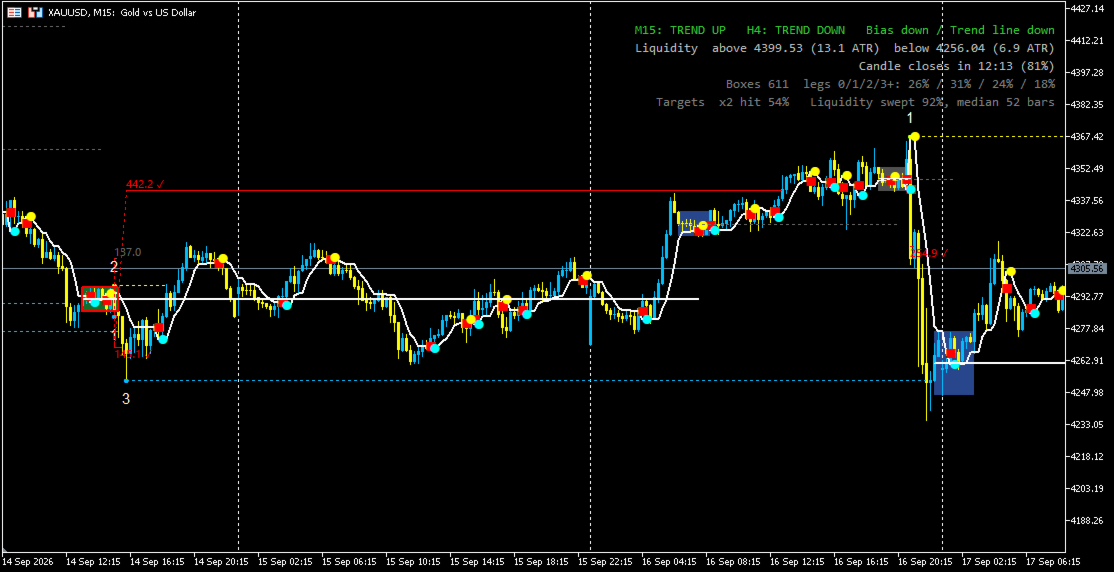
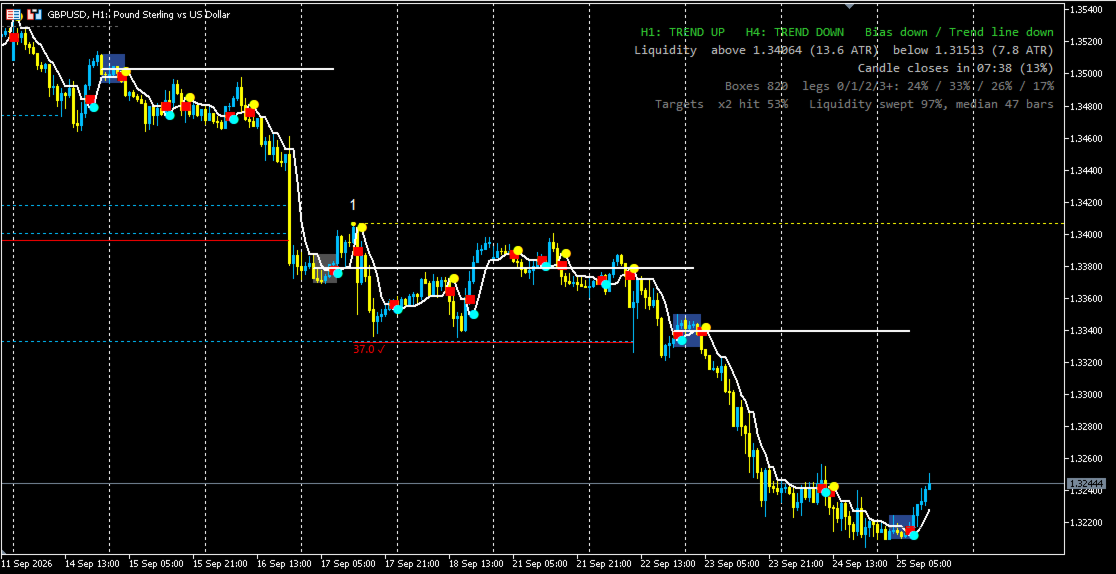
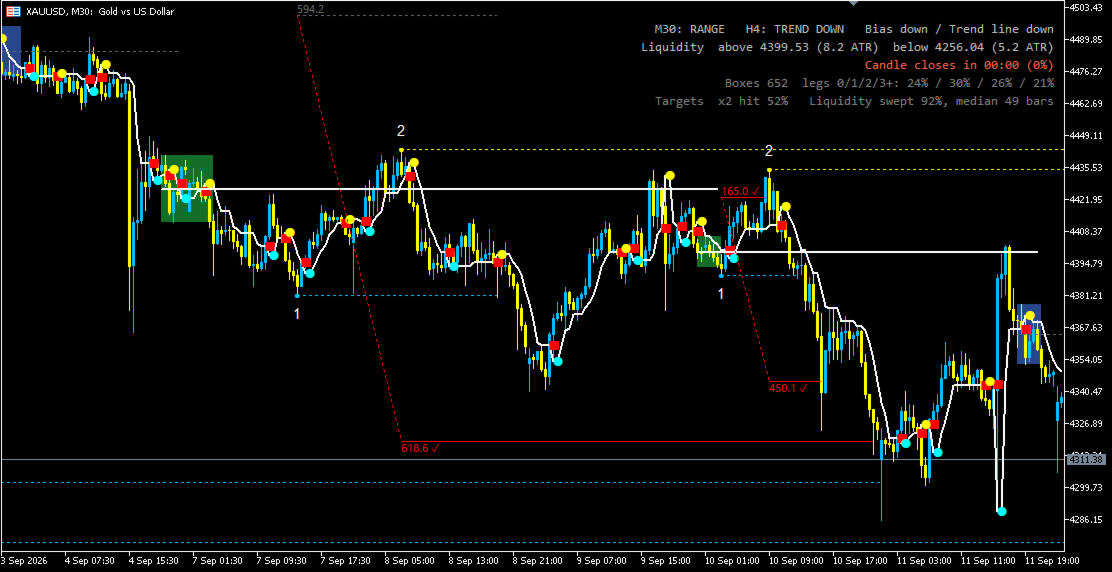
- Range boxes. Each box is drawn only over the bars that were actually inside the range. Its colour tells you how the range resolved: blue while it is waiting, grey after one expansion leg, green after two, and green with a red outline after three or more.
- Average price line. This is the white line through the middle of the range, the market's fair value from that contraction. It keeps running until a new range forms, so you always have a reference level. It is bright when the breakout agrees with the higher timeframe and dim when it does not.
- Numbered expansion legs (1, 2, 3…). The swings that come out of each range. A leg is only numbered once price confirms it by moving out the other side.
- Liquidity lines. Every confirmed leg leaves a dotted line at its extreme. That is where traders who entered on the move are forced to act. The line runs until price trades through it.
- Projected targets. Every leg projects its swing (×2 by default, or several multiples such as 2, 3 and 4). Each target is marked hit (✓) or missed, so you can see how the projections played out on your market.
- Trend line and bias line. A fast trend line with start dots and end markers. An optional, steadier bias line can also be shown on the chart.
The panel
- The phase on this timeframe, plus the phase and bias of a higher timeframe of your choice (H4 by default).
- The nearest liquidity above and below price, with its distance in ATR.
- A candle countdown.
- Statistics measured on your chart: how many legs ranges produce, how often targets are hit, and how often liquidity lines get swept and how quickly.
Alerts
You can be alerted on phase changes, confirmed legs, swept liquidity and targets hit. Alerts go out as a popup and/or a push notification. All alerts are off by default, so you choose exactly what you hear about.
Built to be practical
- No repainting. All phase decisions are made on closed bars.
- A light load on the terminal, even on M1 with years of history.
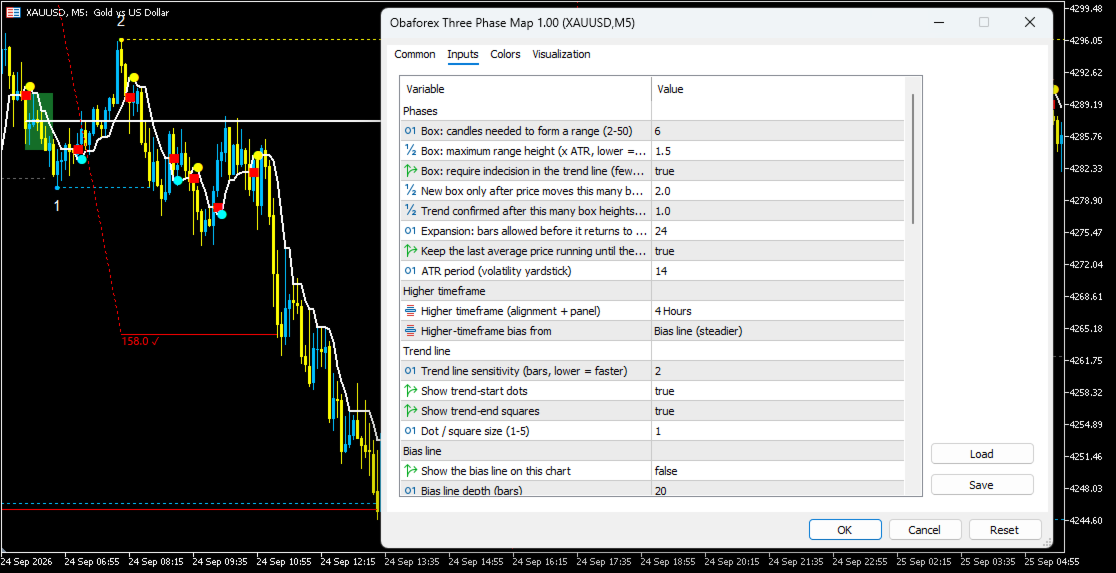
- Every setting can be adjusted: range sensitivity, how far price must move before a new range, the higher timeframe, targets, colours, how much history to draw, and more.
- Values outside a safe range are corrected automatically, so no setting can break the indicator.
- For EA developers: the phase, direction, box top and bottom, average price, latest liquidity level, higher-timeframe bias and the bias line are all readable through iCustom (buffers 9–18).
Where it works best
The indicator works on any symbol and timeframe. It gives the cleanest maps on markets that trade most of the day, such as forex pairs, gold and silver, index CFDs and crypto. On session-only instruments with overnight gaps (for example single stocks on intraday charts), ranges are less reliable.
Please note
This is an analysis tool. It is not a signal service and not a trading system. It shows the structure of the market (where price is balancing, expanding or trending, and where liquidity sits) so you can build and test your own approach. No indicator can guarantee results. Use the free demo in the Strategy Tester to see it on your own markets first.