Candle Timer is a candle countdown indicator for MetaTrader 5. It shows how much time is left on up to three timeframes, together with your broker's trading hours, the Asia, London and New York sessions and today's high-impact news — in one compact panel.
You open a trade, and ten seconds later the H1 candle closes with a long wick through your stop. Candle Timer keeps that moment in sight: the countdown sits in the panel and on the price line, so you always know when the candle rolls over.
TIMERS
- Up to 3 timeframes at once (chart timeframe, M5 and M15 by default; any from M1 to MN).
- Progress bar and colour: green, amber, red as the candle runs out. Thresholds are adjustable.
- Mini candle of each timeframe and its range in ATR(14): see at a glance whether the current candle is small or large.
- Click a timeframe in the panel to switch the chart to it.
- Bell button: sound N seconds before the chart candle closes, optional push notification to your phone.
COUNTDOWN ON THE PRICE LINE
A small pill follows the Bid price at the right edge of the chart: timeframe, time left and a bell when the alert is on. It blinks for two minutes around a high-impact release. When the panel is hidden, the pill keeps a button that brings the panel back.
MARKET HOURS
The open or closed state is taken from the symbol's trading sessions set by your broker, so daily breaks, weekends and index hours are respected. The panel shows spread, server time, "opens in" or "closes in", and a feed line with the age of the last tick and the ping. 24/7 instruments such as crypto are detected automatically. A "no quotes" warning appears when the market should be open but ticks have stopped.
SESSIONS
Asia, London and New York with UK and US daylight saving time. Hours are shown in local, broker or UTC time, with the time left in active sessions and ICT killzone and Silver Bullet tags. One switch draws session boxes on the chart (timeframes up to H1) with today's Asia High and Low extended to the right.
ECONOMIC CALENDAR
Today's events for the symbol's currencies (for gold: USD), High and optionally Medium impact, from the built-in MT5 calendar. Before a high-impact release a banner lists all events of that minute with a countdown.
- Full, compact (timers only) or hidden (price pill only). The state is remembered for each chart; drag the panel to move it.
- English, Polish, German and Spanish.
FOR EXPERT ADVISORS
Three buffers can be read with iCustom: 0 = seconds to the close of the chart candle, 1 = market state (0 closed, 1 open, 2 no quotes), 2 = minutes to the next high-impact event (-1 = none today).
NOTES
- Any symbol and timeframe: forex, metals, indices, crypto, stocks.
- No DLL and no WebRequest. The work runs on a timer, nothing is recalculated on every tick.
- In the Strategy Tester the MT5 economic calendar is not available, so the calendar card is hidden; timers, sessions and the price pill work.
Questions or ideas: send me a private message on MQL5.com.

The Previous High Low Levels indicator displays the high and low of the previous candle from a selected higher timeframe. This helps traders identify key support and resistance zones while trading on lower timeframes. Features:
Plots the previous high and low from a higher timeframe
Works on all timeframes and instruments
Helps identify strong support and resistance levels
Lightweight and does not repaint How to Use: Select a higher timeframe (e.g., H1, H4, D1) in the settings. T
Limited introductory offering
Virgil SMC is listed at $49 . After 30 further purchases , the price advances to $150 . Early access will not remain at this level.
VIRGIL SMART MONEY CONCEPT Institutional Structure. Clear Confluence. High-Impact News Protection. Decisions You Can Trust. Most traders are not losing because they lack effort. They lose because the chart is noisy, the rules are unclear, the signal arrives without context — and because a high-impact news candle can wipe a clean
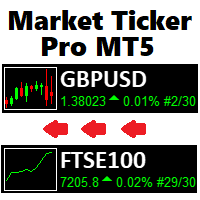
The only Market Ticker on the market! Add a professional novelty to your workspace, with built in mini-charts
A scrolling Market Ticker that displays price changes from all symbols in the Market Watch list. Provides an easy snapshot of symbol prices, and keeps scrolling automatically while you trade and analyse the chart. The ticker color (+/- price changes) are based on either the current or completed candle, and the previous candle.
Options include: - MTF, eg choose to show price changes of t
Overview:
"TrendLine Alerts" is a dynamic, multi-functional trading tool designed to monitor and alert traders in real-time when price action touches or breaks critical technical levels. Built for precision, it seamlessly tracks trendlines, horizontal support/resistance, vertical time-based lines, and equidistant channels , ensuring you never miss a key market movement. Whether you’re scalping, swing trading, or managing long-term positions, this indicator acts as your 24/7 market sentinel. K
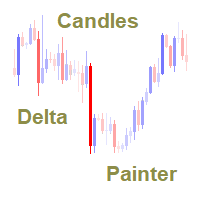
The indicator colors the candles relative to their volume delta. The calculation of the candles delta is based on the tick history or on the deals tape history (see below for a description of the input variable "Volumes").
Coloring is performed by two parameters : by delta sign, as candle color, by delta value, as candle color contrast against chart window background color.
In addition to coloring the candles, the indicator also displays the delta profile on the interval specified by the user
ADX Wilder (Average Directional Movement Index by Welles Wilder) enhanced with fully customizable pop-up and push notifications. Get instant alerts directly on your platform and mobile device when: +DI crosses above –DI → Potential bullish trend start –DI crosses above +DI → Potential bearish trend start ADX crosses above your chosen strong-trend level (default 25) → Confirmation of strong trending market Features: 100% identical to the original MetaQuotes ADX Wilder calculation Clean, visible
Session Highlighter and Killzones draws clean colored boxes for the Asia, London and New York trading sessions, plus optional London and New York killzone windows. Time of day is a large part of context in forex, and seeing each session range on the chart explains a lot of what price is doing. Each session box marks the high and the low of that session for the last several days, and the boxes sit behind the candles so the chart stays readable. The session hours are set in server time and are ful
Take your Boom trading to the next level with the DC Dynamic Scalping Indicator for Boom , engineered specifically for precision scalping and small account growth. This powerful, non-repainting indicator is designed to catch short-term selling opportunities on Boom indices, backed by our proprietary Dynamic Trend Filter that ensures you always trade in the direction of the prevailing trend. With a built-in blue background template , your charts are clean, focused, and ready for action. Key Fe
The Supply and Demand Zone Indicator is a powerful and easy-to-use tool designed to help traders identify critical supply and demand zones on the chart. These zones can provide valuable insight into potential market reversals, breakouts, and important price levels where buyers or sellers are likely to take control. The best FREE Trade Manager . If you want to create your own Hedging or Grid strategies without any coding make sure to check out the ManHedger Key Features: Automatic Zone Detect
This indicator, titled "Fixed Volume Profile.mq5", is a custom tool for MetaTrader 5 (MQL5) designed to calculate and display a Volume Profile over a user-defined fixed time range. The Volume Profile shows the distribution of trading volume at different price levels during a specific period, helping to identify areas of high activity (such as Points of Control or POCs) and volume-based support/resistance areas.
Main Functionality: Interactive Range: The indicator creates two vertical lines on
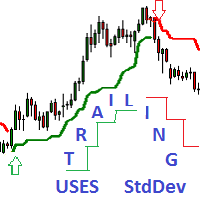
Trailing Uses Standard Deviation.
A daptive_Trailing_uses_StdDev_Indicator is an indicator of directional movement that allows you to identify a trend at the time of its inception and set the levels of a protective stop.
Unlike trailing with a constant distance, the indicator uses the distance to the price proportional to the current standard deviation of StdDev. The distance is equal to the product of the standard deviation and the constant coefficient set by the user.
Thus, the trailing
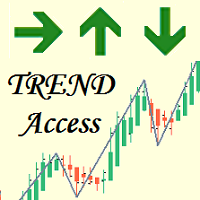
Description: TrendAccess can optimize your trading time by showing you the trend via two different calculation modes quick and easy.
No more searching for Trends. Just open the chart and look at the trend display.
Features: Shows Uptrend, Downtrend and "No Trend" indicator
Shows the calculated ZigZag Profile
Works on all timeframes Two different calculation Modes (MACD and Candle-based calculation)
Settings: Variable
Standard Value Description
Calculation Mode
Candle based
Choose betwe
This indicator is an advanced visual tool designed for traders who rely on Multiple Timeframe (MTF) Analysis . It allows you to visualize High Timeframe (HTF) candles directly on your current chart, making it easy to identify supply and demand zones and macro trend direction without switching tabs. The standout feature of this indicator is its ability to generate Synthetic Timeframes , providing an institutional perspective that MetaTrader 5 does not offer natively. Main Features 1. Exclusive Sy
This simple, yet powerful indicator is very good way to determine actual S/R levels. It's main purpose is making your overview on markets much better.It has built-in arrow signal system, which should be used along with MT indicators for best results.Just try it.
Recommended MT indicators to use along:
Bollinger Bands (default) RSI (period 3, levels 10/90)
Selected Range Volume — Buyers and Sellers Balance + Volume Levels Selected Range Volume is an advanced indicator for analyzing volumes and the imbalance between buyers and sellers. It doesn't just show where the volume was—it highlights who exactly dominated: buyers or sellers, and where the market might stop in the future. You select any section of the chart, and the indicator instantly calculates the volume activity within the range, builds a volume profile by prices, and displays the balance
The Trend Line PRO indicator is an independent trading strategy. It shows the trend change, the entry point to the transaction, as well as automatically calculates three levels of Take Profit and Stop Loss protection.
Trend Line PRO is perfect for all Meta Trader symbols: currencies, metals, cryptocurrencies, stocks and indices. The indicator is used in trading on real accounts, which confirms the reliability of the strategy. Robots using Trend Line PRO and real Signals can be found here:
Pattern Recognition EA - From Learn to Earn.
The market repeats itself. This EA finds every past repeat of the current candle sequence - and lets history vote the direction.
ONE SHAPE. EVERY REPEAT IN HISTORY VOTES.
The last N candles on your signal timeframe form a shape. The EA scans the history you choose - a fixed number of bars or everything your broker provides - for the SAME shape, and checks what happened next, every single time. Only when enough repeats exist AND a clear majority of t
If you like this product, please give it a 5 star rating as a token of appreciation.
This indicator draws vertical lines marking key Forex trading sessions (Asian, London, New York) for a configurable number of past days. These “Silver Bullet” lines help traders quickly visualize session start and end times on the chart.
DaysToDisplay: How many previous days’ session lines to show. Session colors: Customizable line colors for each session. Session start hours: Local server hours for each sessi
Awesome Oscillator by Bill Williams with the ability to fine-tune and replace the averaging algorithms of the indicator, which significantly expands the possibilities of using this oscillator in algorithmic trading and brings it closer in its properties to such an indicator as the MACD. To reduce price noise, the final indicator is processed with an additional Smooth averaging. The indicator has the ability to give alerts, send mail messages and push signals when the direction of movement of th
The Order Block Indicator for MT5 is a powerful tool designed for traders who use smart money concepts and institutional trading strategies. It automatically detects key order blocks on the chart, helping traders identify high-probability reversal and continuation zones.
Key Features: • Automatic Order Block Detection – Highlights strong buying and selling zones based on price action and volume. • Multi-Timeframe Support – Analyze order blocks across different timeframes for better market in
BinaWin NoTouch is an indicator that sends an alert signal when the trade is in the right position to wait for the breakdown of a side market.
It is specially designed to trade under the “No Touch” strategy of the Binary.Com platform with synthetic indexes N.10, N.25, N.50, N.75 and N.100
Similarly, trading can be done with the conventional CALL and PUT strategy of any Binary Options platform.
Requirements to use the indicator:
1. Have an account at Binary.Com
2. Configure the Binary.Com d
VolumeTracker 4X – High-Volume Candle & VWAP Main Description: VolumeTracker 4X automatically identifies the highest-volume candle of the day in the Forex market and calculates the volume-weighted average price (VWAP) from that candle. It draws dynamic channels based on the high and low prices from the highest-volume candle to the current candle , helping you visualize key support and resistance areas . Created for traders who want more precise decisions using real trading volume as a reference.
# Premium Signal Toolkit — All-in-One Trend, Signal and Reversal System
**Ten proven analysis engines on one chart, condensed into one arrow and one line you can actually trade.**
Most "all-in-one" indicators fail for the same reason: they draw everything at once and leave you staring at a wall of colour. Premium Signal Toolkit runs ten independent engines in the background, but shows you only what you asked for — and reports the state of everything else in a compact panel in the corner of yo
Caicai L&S Yield Histogram Important Notice: This indicator is an integral tool of the automated EA Caicai Long and Short Pair Trading . This indicator visually displays the percentage deviation (Yield %) of a pair's current spread relative to its own historical mean. It is an excellent tool for quickly visualizing the gross financial potential of a market distortion in Long & Short operations. Main Features: Percentage Visualization: Understand the size of the distortion in palpable percentage
Murrey (AMI) Plus KAMA Pro Next-Generation Market Analysis Tool Adaptive Market Intelligence Pro is a sophisticated trading indicator that seamlessly integrates three powerful analytical frameworks into one unified platform. Core Capabilities: Adaptive KAMA Technology - Self-adjusting trend detection that filters market noise while preserving signal integrity across all market conditions. Murrey Math Integration - Professional-grade institutional level mapping with dynamic range age tracki
Neuro Poseidon is a new indicator by Daria Rezueva. It combines precise trading signals with adaptive TP/SL levels - creating best possible trades as a result!
Message me and get Neuro Poseidon Assistant as a gift to automize your trading process!
What makes it stand out?
1. Proven profitability on all assets and timeframes
2. Only confirmed BUY and SELL signals present on the chart
3. Adaptive TP & SL levels generated by the software for each trade
4. Easy to understand - suitable for al
ARIPoint is a powerful trading companion designed to generate high-probability entry signals with dynamic TP/SL/DP levels based on volatility. Built-in performance tracking shows win/loss stats, PP1/PP2 hits, and success rates all updated live. Key Features: Buy/Sell signals with adaptive volatility bands Real-time TP/SL/DP levels based on ATR Built-in MA Filter with optional ATR/StdDev volatility Performance stats panel (Success, Profit/Loss, PP1/PP2) Alerts via popup, sound, push, or email Cu
Break and Retest Hunter is a powerful MetaTrader 5 indicator designed to automatically identify support and resistance levels, breakout structures, and potential retest opportunities in real time. Bonus Indicator: After purchasing Break and Retest Hunter , contact me to receive Trade Indicator Assistant EA completely free as a bonus utility.
$65 for the next 10 copies . Next price is $120.
Combining adaptive market analysis, clear BUY/SELL signals, Fibonacci-based profit targets, and a premiu
FiboSniper Pro – Multi-Filter Fibonacci System with Auto SL/TP and Control Panel FiboSniper Proは、動的なFibonacci Envelopesと複数の確認フィルターを組み合わせ、選別されたBuyおよびSellシグナルを生成するテクニカルインジケーターです。FibonacciレベルはMoving AverageとATRを基に計算され、その後ADX、EMA、RSI、ATR、Volume、Time、Candle構造によってフィルタリングされます。インジケーターは、ATRに基づく自動Stop LossおよびTake Profitレベルをチャート上に直接表示し、さらに迅速な調整が可能なインタラクティブControl Panelを提供します。 購入後、推奨設定ファイルと詳細な使用方法については、私にご連絡ください。 Auto Trader Xを使用してFiboSniper Proのシグナルを自動化できます: [Auto Trader X] User GuideとSet Files: [Click her
Entry In The Zone and SMC Multi Timeframe is a real-time market analysis tool based on Smart Money Concepts (SMC), designed to analyze market structure, price direction, and key trading zones. It supports both Single-Timeframe and Multi-Timeframe Analysis, providing a clearer view of overall market structure across multiple timeframes, with real-time BUY / SELL signals designed with a strict focus on No-Repaint principles. The signals are designed to help filter unclear setups and evaluate tradi
Trend Follower — a trend map for MetaTrader 5 Trend Follower does not tell you where to buy or sell. It shows where the market is: uptrend, downtrend or consolidation, and whether the current trend is gaining or losing strength. You read the map and make the decision. HOW TO READ IT Green — uptrend. Red — downtrend. Shade — a full, strong color means the trend is in force. When momentum fades, the color fades step by step; in a consolidation it is at its palest. When the trend accelerates a
Apex Terminal is a trade panel for MetaTrader 5 that sizes every position from your risk and manages it from entry to exit.
Set how much you accept to lose and where the stop-loss goes. Before you click, the panel shows the lot, the loss at the stop and the profit at the full target. One click opens the trade with the stop-loss and the whole take-profit ladder already in place.
TRADE - Position size from % of balance or equity, a fixed amount of money or a fixed lot. The lot is rounded down t
Account Center — Trading Journal and Account Dashboard for MetaTrader 5 Your platform shows how much you made or lost. It does not show why. Account Center turns one chart into a full-screen account center and trading journal: the chart hides, a clean panel takes its place, and every closed trade gets the human side next to the numbers — your emotion, your plan, your mistakes and your lesson. WHAT YOU GET Dashboard Equity, balance, floating P/L and today's result with your mood before the sessio