
Smc Pro Chart
- インディケータ
-
Talal N Z Aljarusha
 Building innovative trading technologies that empower traders to better understand financial markets, improve decision-making, and optimize their trading workflows.
Every solution is designed with a strong focus on reliability, performance, usability, and continuous innovation. - バージョン: 1.3
- アップデート済み: 23 10月 2026
SMC Pro Chart
Clear Structure. Key Zones. Your Chart, Your Way.
Smart Money Concepts analysis for MetaTrader 5.
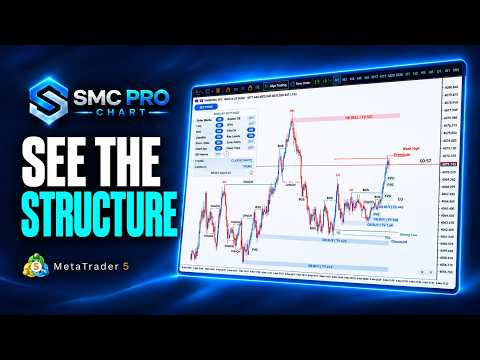
Bring market structure and key price areas together in one organized workspace. SMC Pro Chart combines automated analytical drawings with flexible visual controls, helping you examine price action through a clear, personalized chart layout.
Market Structure at a Glance
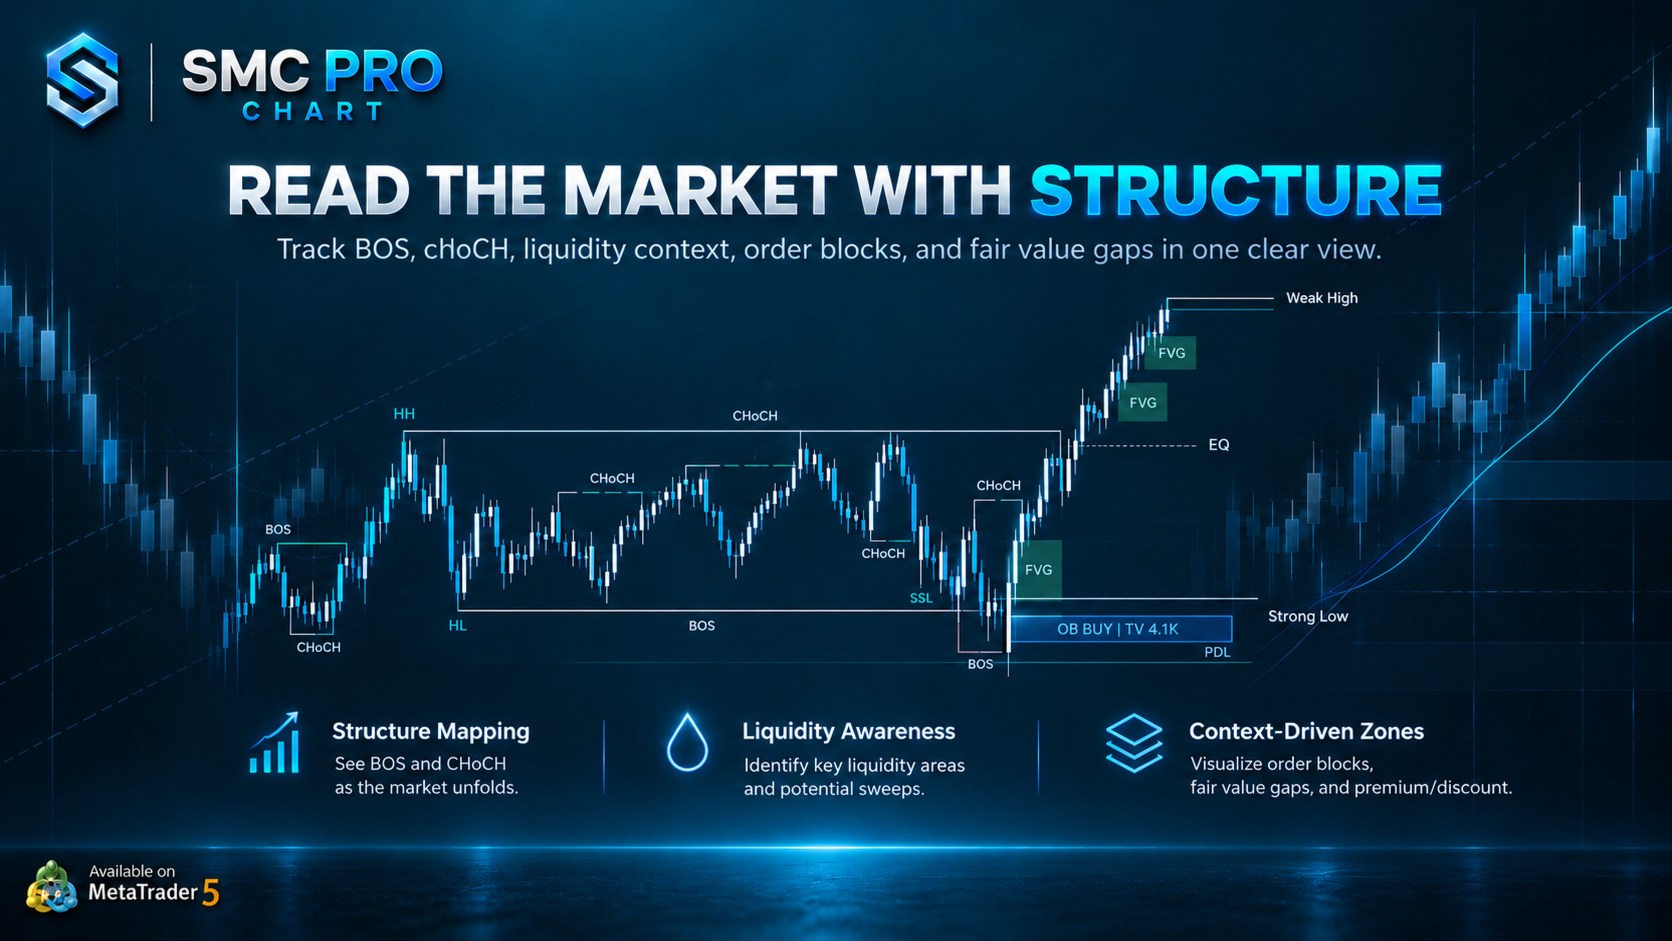
Follow Break of Structure (BOS) and Change of Character (CHoCH) directly on the chart. Distinguish bullish and bearish structure with customizable colors and labels that adapt to the available drawing space.
Key Zones in Context
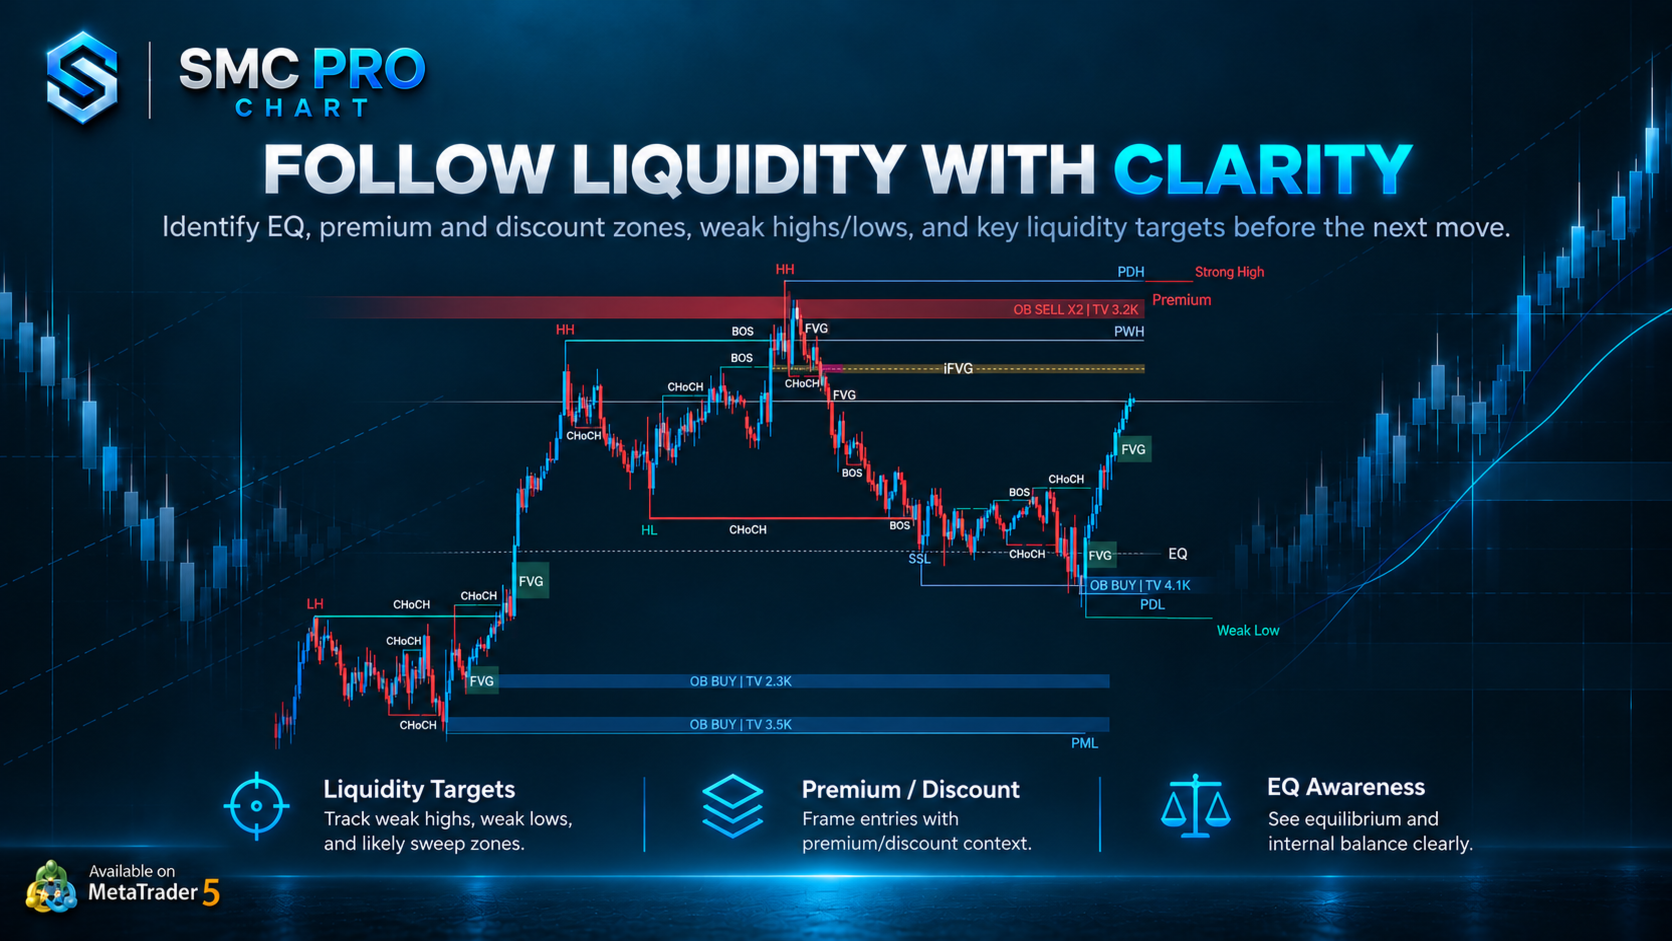
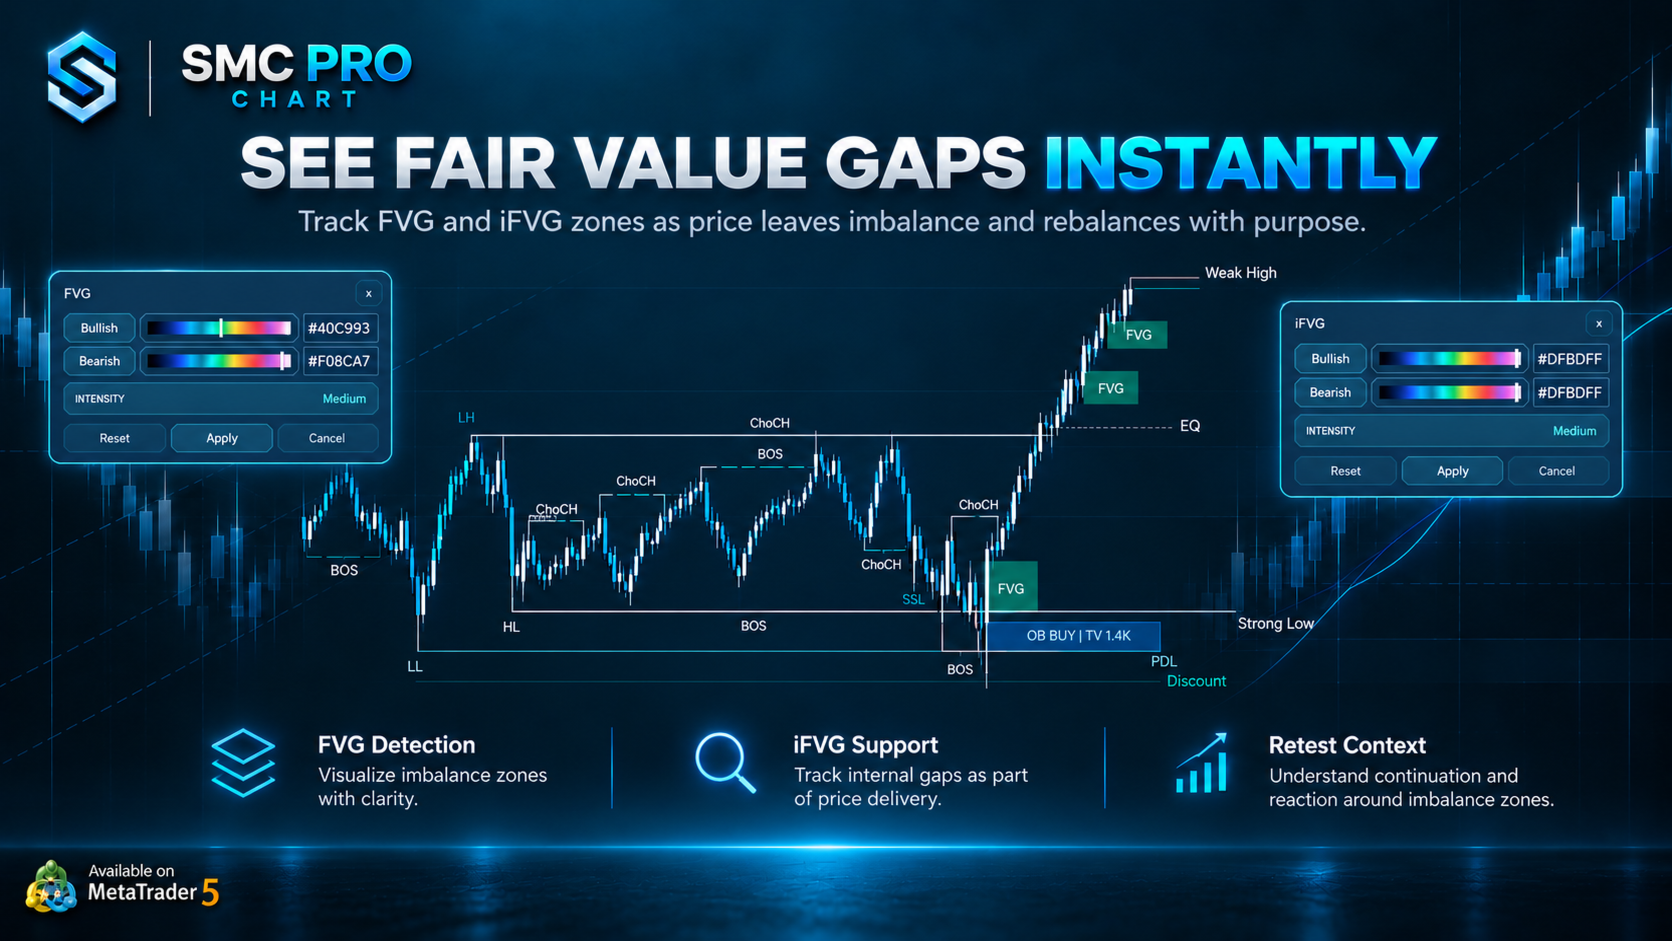
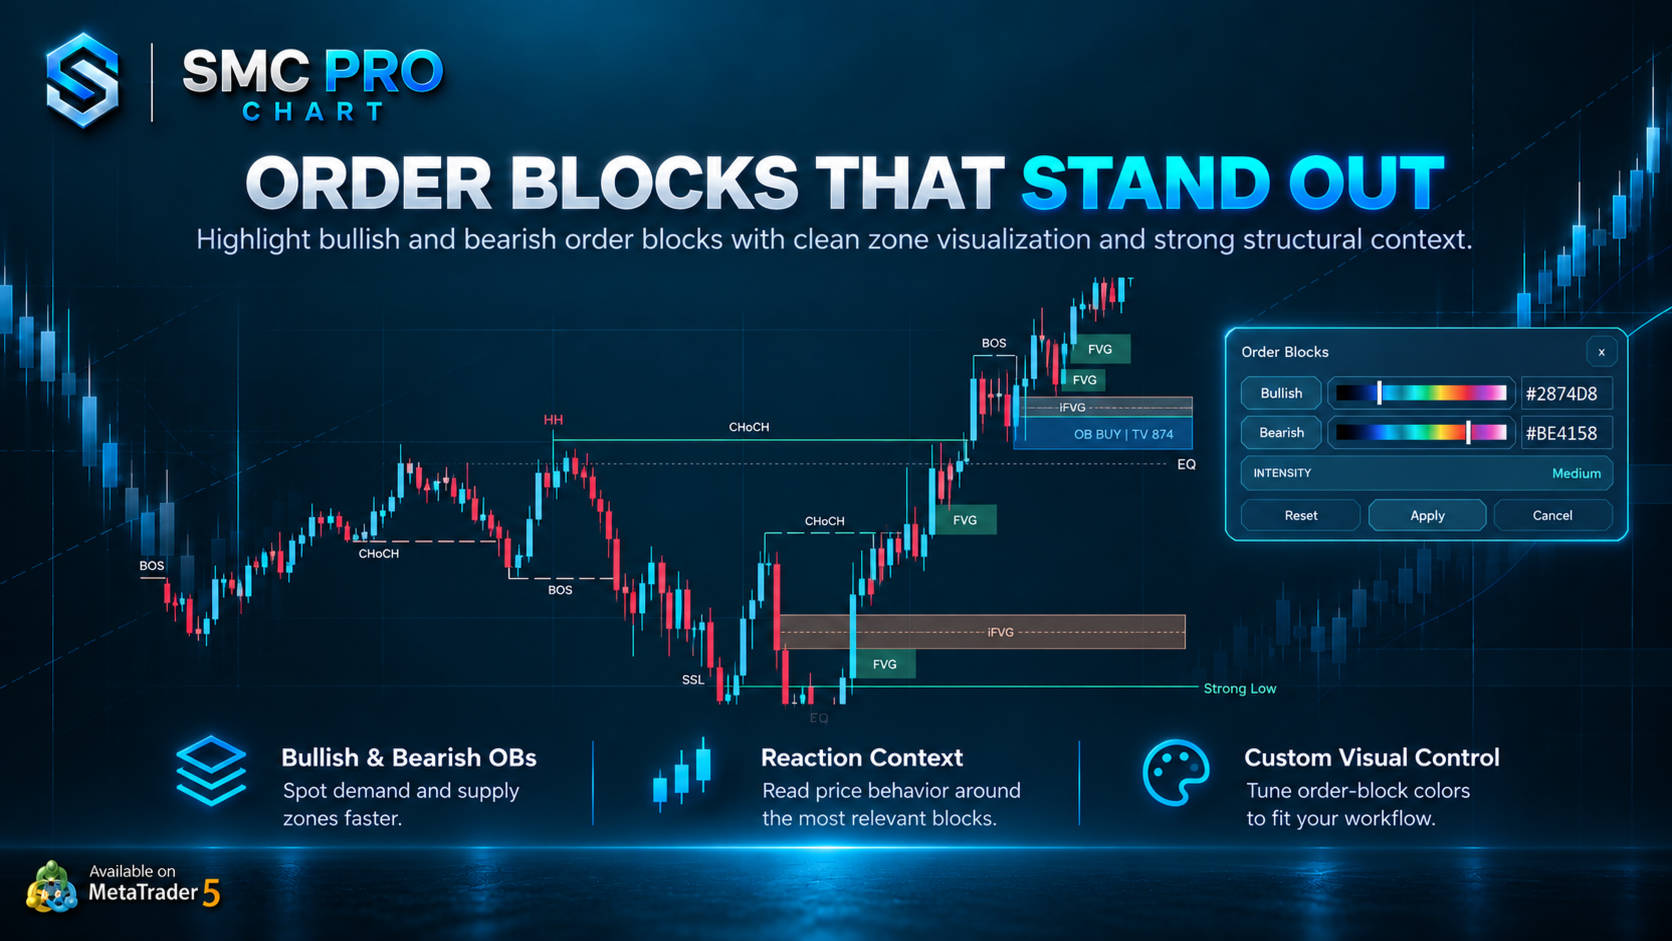
View Order Blocks, Fair Value Gaps, Inverse Fair Value Gaps, liquidity areas, and Premium / Discount zones alongside price movement. Choose which analytical elements to display and focus on the areas relevant to your own approach.
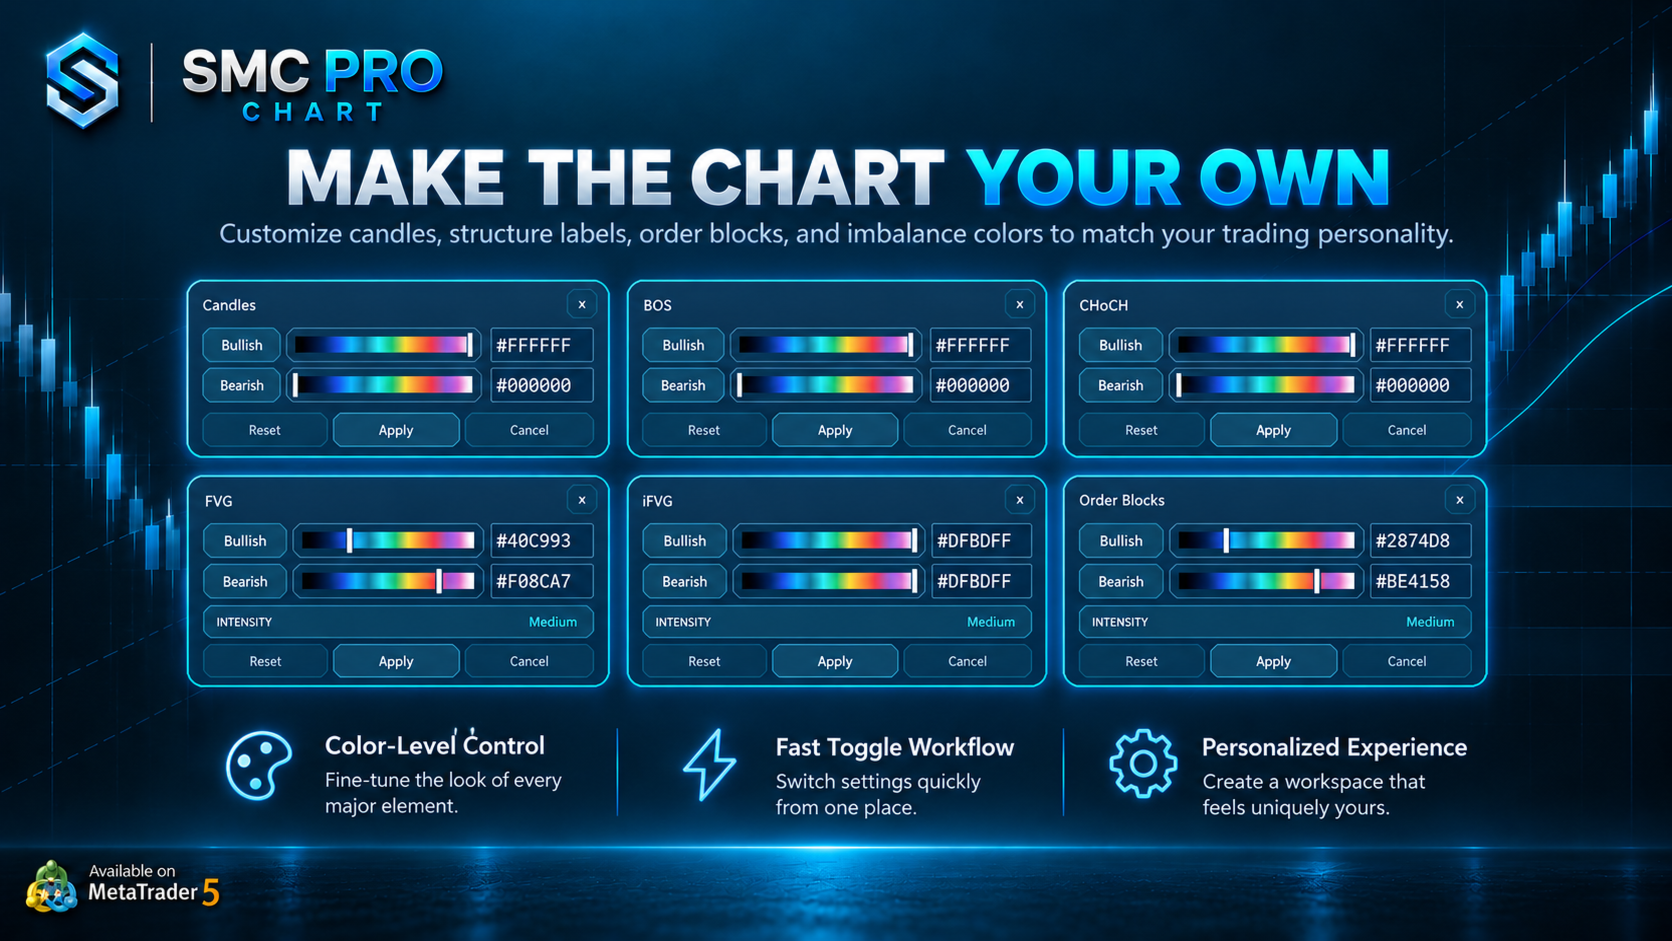
Your Chart Your Colors
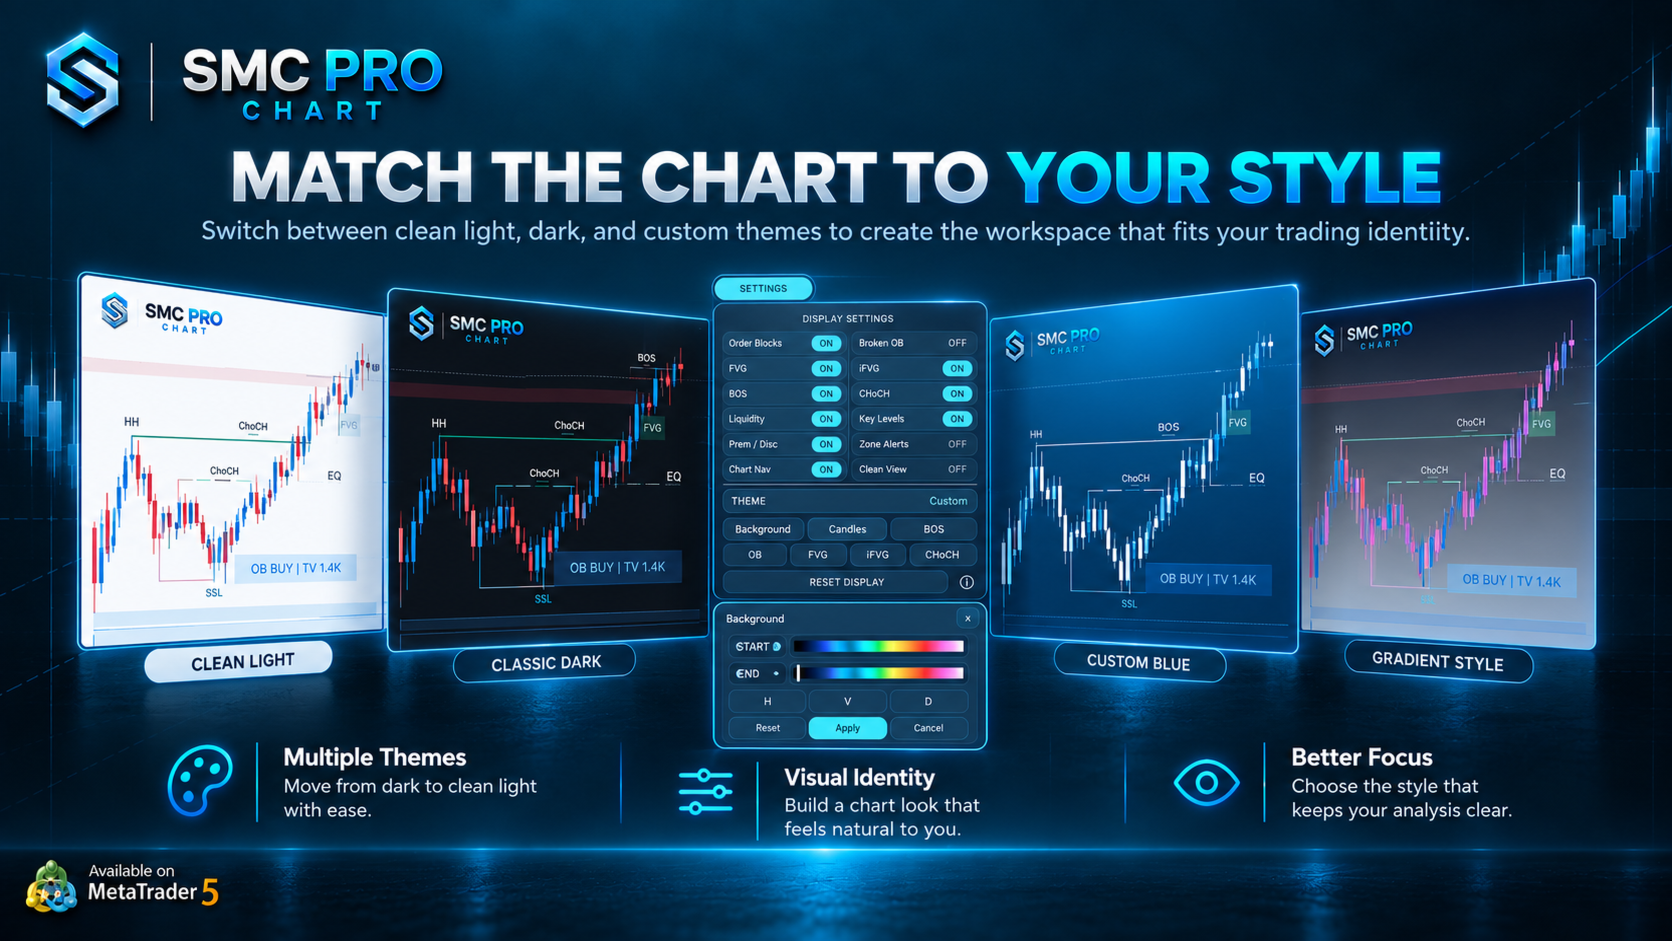
Start with the Classic White theme or explore the available alternatives. Select Custom to personalize the background, bullish and bearish candles, zones, and market-structure drawings.
Preview color changes live on the chart, then confirm your selection with Apply. Independent color controls let you build a consistent visual style while keeping buying and selling areas easy to distinguish.
Focus with Clean View
Temporarily hide the indicator’s analysis with Clean View while keeping the chart and selected theme visible. Restore your selected analytical elements when you are ready to continue your review.
Compact panel controls keep essential display and appearance settings within reach, so you can adjust your workspace without crowding the chart.
Important Information
SMC Pro Chart is a visual analysis indicator. It does not execute trades. Displayed structures and zones are analytical references and do not guarantee future price behavior. Trading decisions and risk management remain the user’s responsibility.

































Very clean design and excellent indicator! It marks the Premium and Discount zones based on Swing Highs and Lows perfectly. As a Gold trader, I frequently use HTF internal swing zones to make decisions on lower timeframes. If possible, adding an option for internal swing Premium/Discount zones would make this more essential tool. Thanks for the great work!