Qdotraxy

Discover the Power of the QDOTRAXY Indicator: Your Key to Precise Trading Decisions!
Have you ever imagined having a powerful ally that combines advanced technical analysis with real-time alerts to maximize your market operations? We introduce ULTRA ADVANCED, the indicator that revolutionizes how you make buy and sell decisions.
Why Choose QDOTRAXY?
Unmatched Accuracy:
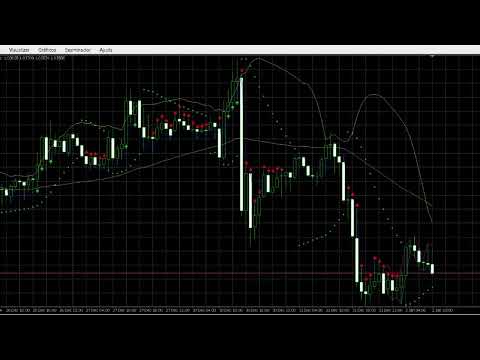
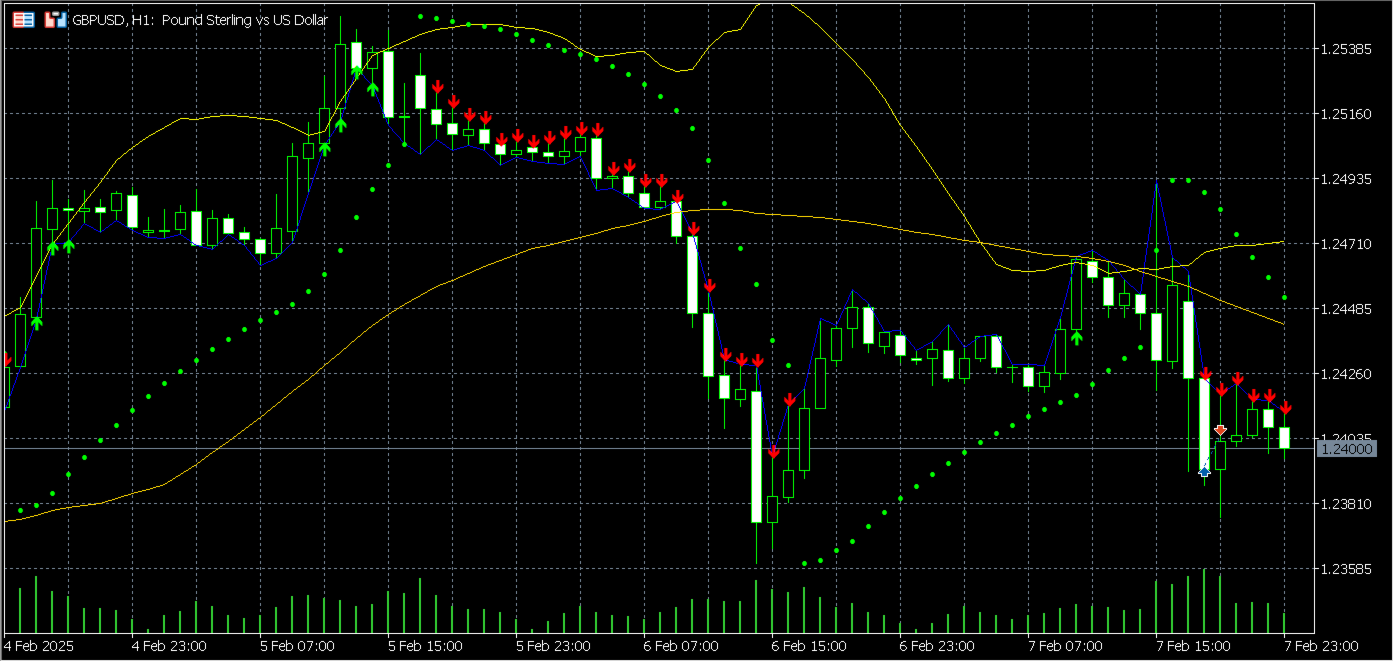
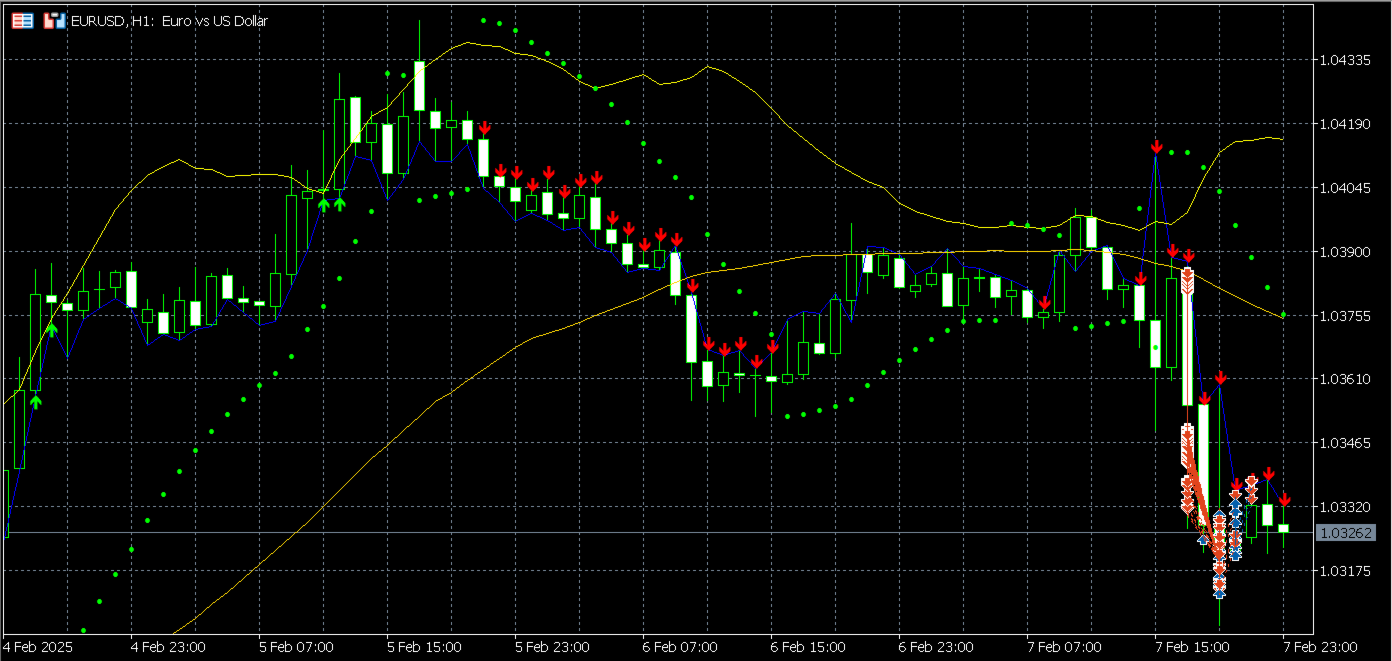
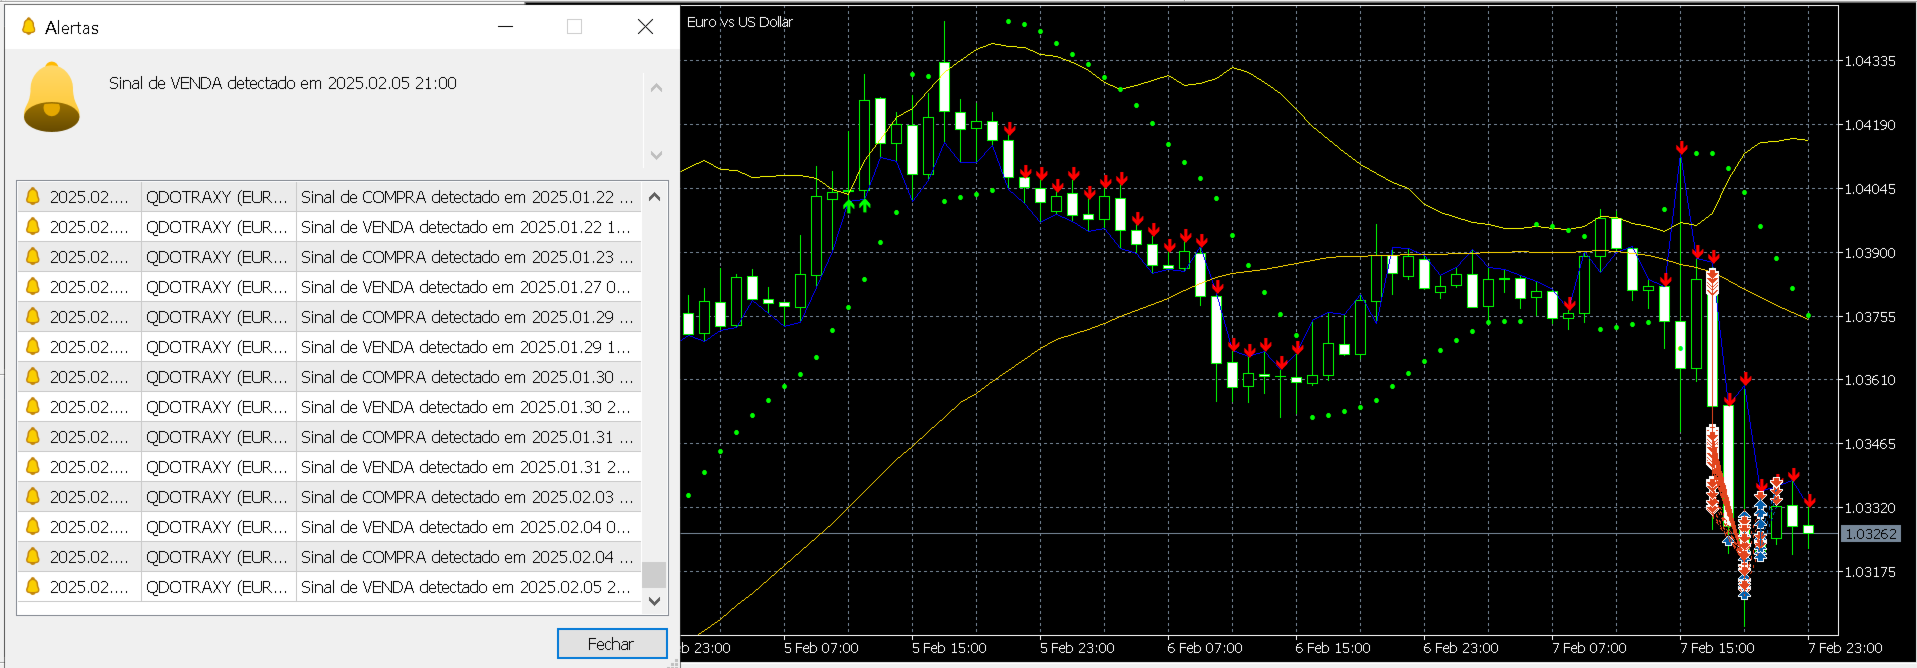
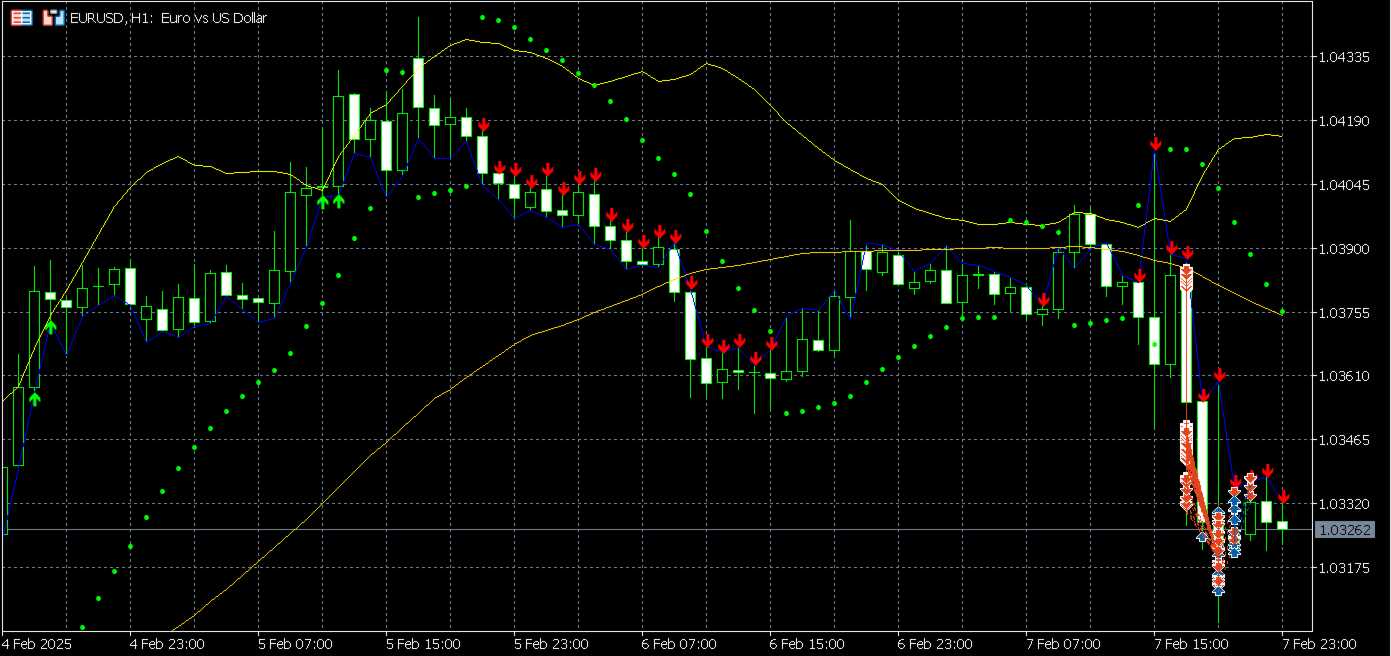
QDOTRAXY combines multiple technical indicators (MACD, Bollinger Bands, SAR, and Moving Average) to generate highly reliable signals.
Buy and sell arrows are plotted directly on the chart, indicating the exact moments to enter or exit the market.
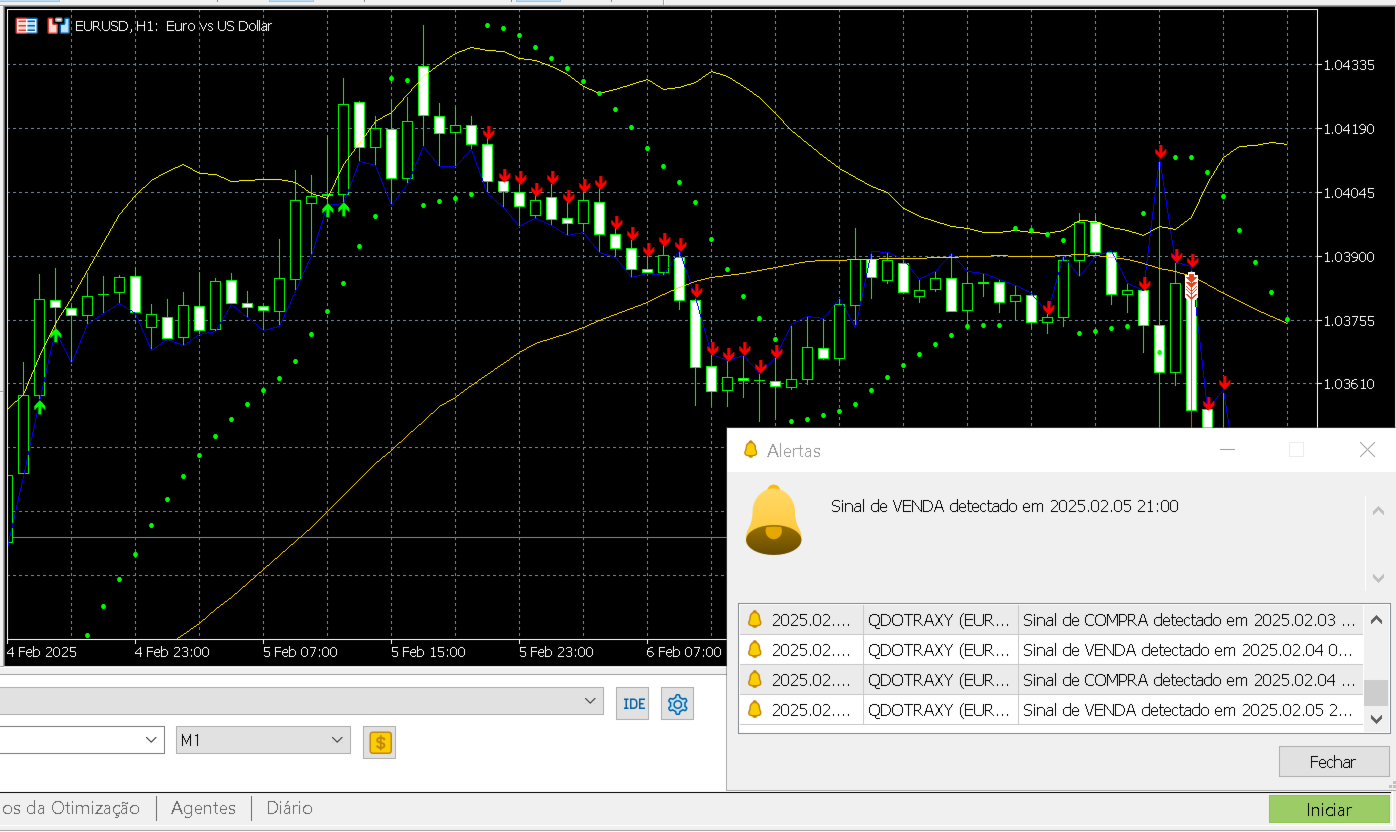
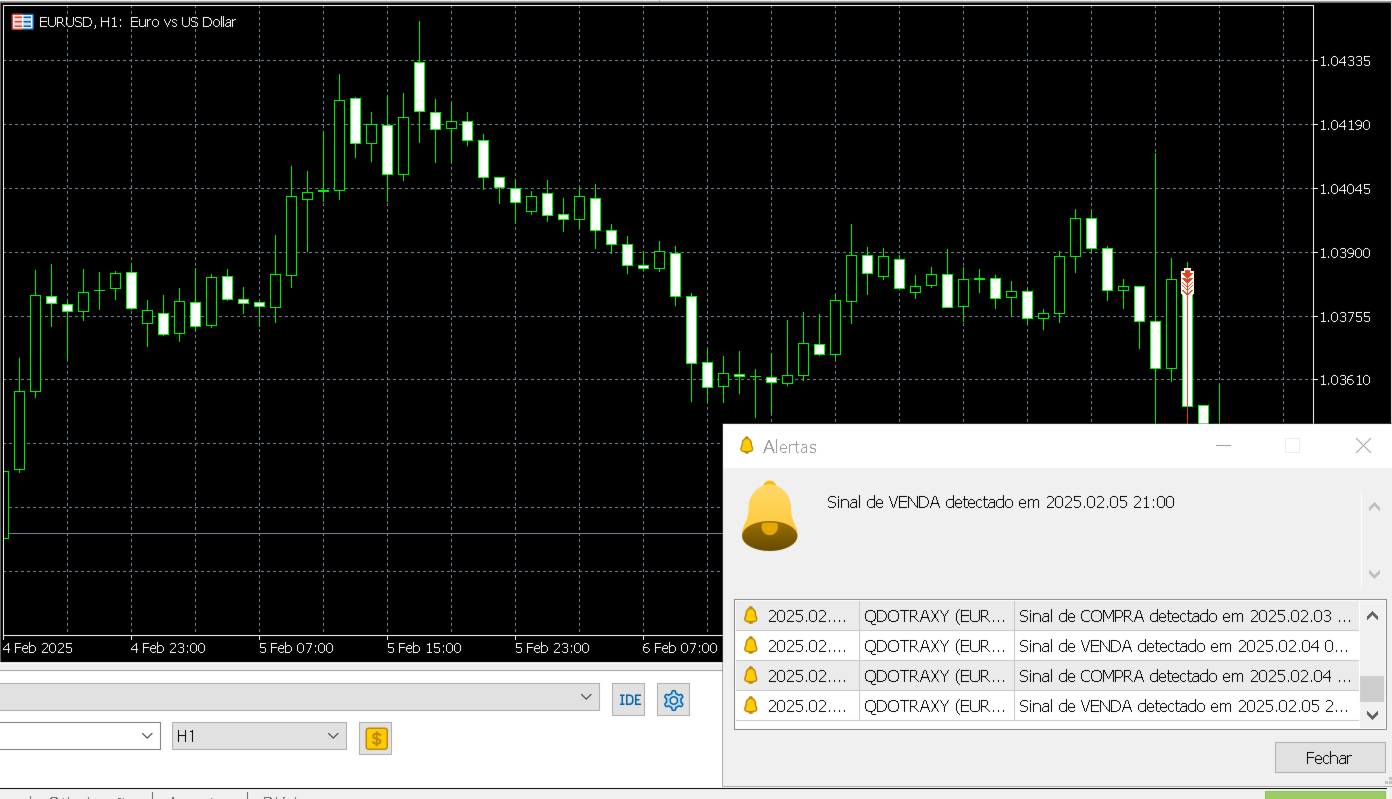
Auditory and Visual Alerts:
Never miss a signal! The indicator emits sound alerts and displays messages on-screen whenever a buy or sell signal is detected.
Perfect for traders needing quick and accurate responses.
Easy to Use:
Simple and intuitive setup. Just add the indicator to your chart and start trading with confidence.
Compatible with all currency pairs and timeframes.
Candle-by-Candle Analysis:
QDOTRAXY analyzes each candle individually, ensuring you are always one step ahead of the market.
Save Time:
Eliminate the need to manually monitor multiple indicators. QDOTRAXY does all the heavy lifting for you.
Exclusive Benefits:
Maximize Your Profits: Identify buy and sell opportunities with surgical precision.
Minimize Losses: Exit the market at the right time, avoiding sudden drops.
Transform Your Trading Today!
Don't miss this unique opportunity to elevate your trading strategy to a new level. With QDOTRAXY, you'll have all the tools needed to make smart, profitable decisions.
QDOTRAXY— The precision you need, the results you deserve.

おすすめのプロダクト
Overview Harmonic Patterns MT5 is a technical analysis indicator designed for the MetaTrader 5 platform. It identifies and displays harmonic price patterns, such as Butterfly, Cypher, Crab, Bat, Shark, and Gartley, in both bullish and bearish directions. The indicator calculates key price levels, including entry, stop loss, and three take-profit levels, to assist traders in analyzing market movements. Visual elements and customizable alerts enhance usability on the chart. Features Detects six ha
Harmonic Pattern Hunter Harmonic Pattern Hunter is a technical indicator for MetaTrader 5 that automatically identifies and draws high-probability harmonic patterns directly on the chart. It is designed to assist traders who use harmonic analysis as part of their trading methodology. How It Works The indicator scans historical and live price data for completed XABCD harmonic structures using Fibonacci ratio validation. When a valid pattern is detected, it draws the full pattern geometry, marks t
これはほぼ間違いなく、MetaTraderプラットフォームで見つけることができる最も完全な調和価格形成自動認識インジケーターです。 19種類のパターンを検出し、フィボナッチプロジェクションをあなたと同じように真剣に受け止め、潜在的逆転ゾーン(PRZ)を表示し、適切なストップロスとテイクプロフィットレベルを見つけます。 [ インストールガイド | 更新ガイド | トラブルシューティング | よくある質問 | すべての製品 ] 19の異なる調和価格形成を検出します プライマリ、派生および補完フィボナッチ投影(PRZ)をプロットします 過去の価格行動を評価し、過去のすべてのパターンを表示します この指標は、独自の品質とパフォーマンスを分析します 適切なストップロスとテイクプロフィットのレベルを表示します ブレイクアウトを使用して適切な取引を通知します すべてのパターン比をグラフにプロットします 電子メール/音声/視覚アラートを実装します スコット・M・カーニーの本に着想を得て、この指標は最も純粋で急を要するトレーダーのニーズを満たすように設計されています。ただし、トレードを容易にする
Monster Harmonics Indicator is a harmonic pattern indicator. It recognizes Gartley, Bat, Crab, Butterfly, Cypher, White Swan, Black Swan, Shark and AB=CD patterns. Projected patterns that are not yet completed are recognized, too. Monster even shows the PRZ (Potential Reversal Zone). Users can add their own user defined patterns to Monster. Besides the current pattern, Monster also shows all patterns in the symbols history. Monster will provide alerts for developing patterns. Introduced by H.M.
This LEGIT Indicator Can Accurately Predict the Outcome of One Bar. Imagine adding more filters to further increase your probability! Unlike other products, Binary Options PRO can analyze past signals giving you the statistical edge. How Increase Your Probability Information revealed here www.mql5.com/en/blogs/post/727038 NOTE: The selection of a Good Broker is important for the overall success in trading Binary Options. Benefits You Get Unique algorithm that anticipates price weakness. Gene
Go Binary
Fabio Oliveira Magalhaes
The main idea of this product is to generate statistics based on signals from 5 different strategies for the Binary Options traders, showing how the results would be and the final balance based on broker's payout. Strategy 1: The calculation is secret. Strategy 2: The signal is based on a sequence of same side candles (same color). Strategy 3: The signal is based on a sequence of interspersed candles (opposite colors). Strategy 4: The signal consists of the indicators bollinger (we have 3 type
Usdjpy Trend Follower
Marcos Ramon Aparicio Pelaez
バックテストされた堅牢な MetaTrader 5 ロボットを使用して、USDJPY を自動的に取引します。Momentum Master H1 は、動的な Bulls Power と ATR ベースのエントリに基づいた高確率のロングオンリー戦略を使用します。主な機能は次のとおりです: タイムテスト済み: H1 チャートで 2019–2025 年からバックテスト済み。 精密エントリー: 短期的なプルバックと確認されたトレンドシグナルに基づいてトリガーされるロングトレード。 スマートなリスク管理: 適応サイジングのための ATR ベースのストップロスおよび利益目標。 柔軟な取引時間: 週を通して動作し、セッション制限を設定できます。 簡単な統合: ブローカー制限がなく、MT4 用に最適化されています。 自動化された規律でトレンドの捕捉を最大化します – USDJPY で長期のみのモメンタム戦略を求めるトレーダーに最適です。
Equinox Gold
Dmitriq Evgenoeviz Ko
Equinox Gold is a high-tech trading expert advisor (EA) specifically designed for the gold market ( XAUUSD ). The system is based on a unique Market Equilibrium algorithm that identifies areas of imbalance between supply and demand during extreme volatility. Unlike most robots that use dangerous sit-and-wait methods, Equinox Gold relies on mathematical momentum confirmation and strict risk control for every trade. MAIN ADVANTAGES VRP Filter (Volatility Range Filter): The robot automatically ada
##   ONLY GOLD ##   Тiльки Золото ## **Mercaria Professional Trading Zones - Complete Guide** ## **Mercaria Professional Trading Zones - Повний посібник** ### **How Mercaria Zones Work / Як працюють зони Mercaria** **English:** Mercaria Zones is an advanced trading indicator that identifies high-probability support and resistance areas using ZigZag extremes combined with mathematical zone calculations. The indicator works on multiple timeframes simultaneously, providing a comprehensive view
Unlock the power of Smart Money Concepts (SMC) with precision and financial clarity. OTRX SMC is not just a technical indicator; it is a complete professional trading system designed for traders who follow institutional footprints. Unlike standard indicators that clutter your chart with noise, OTRX SMC focuses on the three pillars of Price Action: Structure (BOS) , Flow (FVG) , and Origin (OB) . The unique advantage of OTRX SMC is its Real-Time Risk Calculator . For every mapped structure or zon
MT5  Crypto_Forex インジケーター「プライス アクション フィルター ヒストグラム」は、プライス アクション トレーディングのための効率的な補助トレーディング ツールです。再描画はありません。 - このインジケーターは、トレーダーにエントリーの方向を示します。トレーダーは、その方向のプライス アクション シグナルを検索するだけです。 - プライス アクション フィルター ヒストグラムは、プライス アクション パターンおよびサポート/レジスタンス レベルと組み合わせる必要があります。 - 緑色のヒストグラム - 買いエントリーを探します。 - 赤色のヒストグラム - 売りエントリーを探します。 - このインジケーターを使用すると、標準戦略をアップグレードする機会が数多くあります。 - インジケーターには、モバイルおよび PC アラートが組み込まれています。 高品質のトレーディングロボットとインジケーターをご覧になるにはここをクリックしてください! これは、この MQL5 Web サイトでのみ提供されるオリジナル製品です。
Advanced MT5 Indicator: Precision-Powered with Pivot Points, MAs & Multi-Timeframe Logic Unlock the full potential of your trading strategy with this precision-engineered MetaTrader 5 indicator —an advanced tool that intelligently blends Pivot Points , Adaptive Moving Averages , and Multi-Timeframe Analysis to generate real-time Buy and Sell signals with high accuracy.    If you want to test on Real Market, Let me know. I will give the Demo file to run on Real Account.    Whether you're a scal
このインジケーターは、H.M.Gartley (「株式市場の利益」、1935 年) の開発に従って調和パターン (XABCD) を識別します。 D 点を透視投影の点として投影します (設定で ProjectionD_Mode = true を指定します)。 再描画はしません。 作業時間枠のバーが閉じるとき、特定されたパターン ポイントが Patterns_Fractal_Bars バーの間に移動していない場合、チャート上に (予想される価格変動の方向に) 矢印が表示されます。 この瞬間から、矢印はチャート上に永久に残ります。 連続した 2 ~ 3 つ以上の矢印 - これは市場状況の変化であり、再描画/再描画ではありません (時間枠を前後に切り替えてはなりません)。 注: 2 ~ 3 つ以上の矢印が連続している場合 - これは市況の変化であり、再描画ではありません。 パターンの総数は 85 です (Gartley-222 と Gartley-222WS を含む。完全なリストはコメント セクションにあります)。 識別されたすべてのパターンのうち、最後に識別されたパターンのみがベ
Visual Range Indicator MT5
AL MOOSAWI ABDULLAH JAFFER BAQER
Explore the Power of Precision with the Range Indicator! This cutting-edge indicator is designed to provide traders with a detailed analysis of market range movements. However, it is essential to note that the Visual Range Indicator is not optimized—it has been crafted for you to tailor it to your trading needs and optimize it for your unique strategy. Your mastery and customization will unlock its true potential! The Strategy Behind the Range Indicator The Visual Range Indicator focuses on ide
SMC Buy Sell Indicator SMC Buy Sell Indicator is a price action-based trading tool designed to identify market structure using Smart Money Concepts. It focuses on detecting meaningful swing points, structural breaks, and confirmation signals directly from chart data. The indicator operates using closed candle data and does not rely on future bars. All calculations are performed on confirmed price action, which helps maintain consistent and stable signals. Key Features Market Structure Detection
A powerful oscillator that provide Buy and Sell signals by calculating the investor liquidity. The more liquidity the more buy possibilities. The less liquidity the more sell possibilities. Please download the demo and run a backtest! HOW IT WORKS: The oscillator will put buy and sell arrow on the chart in runtime only . Top value is 95 to 100 -> Investors are ready to buy and you should follow. Bottom value is 5 to 0 -> Investors are ready to sell and you should follow. Alert + sound will appe
Introducing the Power Trade Plus indicator designed by a small group of traders with a few years of experience trading the market profitably.  The Power Trade Plus is derived from the Power Trade indicator,  the indicator strive in powerful sniper entries and take profit levels,  with an algorithm that's can determine the markets volatility and Provides entries based on the current market volatility. This indicator is much more effective in stock ,currencies and indices.
Stratos Pali Indicator is a revolutionary tool designed to enhance your trading strategy by accurately identifying market trends. This sophisticated indicator uses a unique algorithm to generate a complete histogram, which records when the trend is Long or Short. When a trend reversal occurs, an arrow appears, indicating the new direction of the trend. Important Information Revealed Leave a review and contact me via mql5 message to receive My Top 5 set files for Stratos Pali at no cost ! Down
Pip Blaze Signal Pip Blaze Signalは、リペイントやバックペイントなしに明確な買い・売りシグナルを提供するプライスアクションベースのインジケーターです。確定したバーを継続的にスキャンし、最新の高値と安値を事前設定された閾値と比較します。価格が計算されたレベルをローソク足のクローズ時に突破すると、チャート上にドットをプロットし、バーが確定した後は過去のシグナルが固定されます。ライブ取引やバックテスト中でも、トレーダーは明確なエントリシグナルを受け取りながら、チャートの整合性を維持できます。 ロジック コアロジックは、設定可能なルックバック期間内の最高値と最安値を使用して動的なレンジを計算します。リスクパラメータがこのレンジの極値を調整し、上限および下限の閾値を生成します。前のバーの終値が上限閾値の下にあり、現在のバーの終値がそれを上回った場合、青いドットが表示されます。逆に、前のバーの終値が下限閾値の上にあり、現在のバーの終値がそれを下回った場合、マゼンタ色のドットが表示されます。確定したバーのデータのみを使用するため、バー内の価格変動がシグナルに影響
UR フロントエンドバックエンド   UR FrontEndBackEnd は、サポートとレジスタンスの最も正確なレベルを見つけるための私のお気に入りの公式です。 また、それらをさまざまなカテゴリ (破線、実線、および領域) に分割して、その強度を示しています。 すべてがバッファに格納されるため、簡単にアクセスして他のツール内で実装できます。 追加: ツールは、適用される資産に合わせて調整する必要がある場合があります。資産は、ツールに影響する価格の桁数に関して異なります。 そのために必要なパラメーターは、設定で提供されます。 UR FrontEndBackEnd を使用する利点: 計算の密度と距離を設定するための 2 つのパラメーターのみ サポートとレジスタンスはバッファ内に保存され、指定された資産の価格から上昇/下降します サポート/レジスタンスラインの強さをすばやく視覚的にフィードバックするための 3 種類のライン -> DASHED、SOLID、AREA ツールの最新情報を入手できる特別な電報チャットがあり、何か不足していると感じた場合はリクエストを送信することもで
The Market Matrix indicator is an effective tool for identifying trends in the Forex market. It serves as a reliable assistant for traders, helping to identify trend and flat zones. Below are the main characteristics and advantages of this indicator: Features of the Market Matrix indicator: Reliability and stability: The indicator does not redraw previous values, which ensures the stability of signals. Quick reaction to trend changes: The indicator algorithm allows you to quickly respond to tr
The   Fibonacci Confluence Toolkit   is a technical analysis tool designed to help traders identify potential price reversal zones by combining key market signals and patterns. It highlights areas of interest where significant price action or reactions are anticipated, automatically applies Fibonacci retracement levels to outline potential pullback zones, and detects engulfing candle patterns. Its unique strength lies in its reliance solely on price patterns, eliminating the need for user-define
まず第一に、この取引ツールはノンリペイント、ノンリドロー、ノンラグの指標であり、プロの取引に理想的ですことを強調する価値があります。 オンラインコース、ユーザーマニュアル、デモ。 スマートプライスアクションコンセプトインジケーターは、新米から経験豊富なトレーダーまで、非常 に強力なツールです。Inner Circle Trader AnalysisやSmart Money Concepts Trading Strategiesなど、20以上の有用な指標を1つに組み合わせています。このインジケーターはスマートマネーコンセプトに焦点を当て、大手機関の取引方法を提供し、彼らの動きを予測するのに役立ちます。 特に、流動性分析に優れており、機関がどのように取引しているかを理解しやすくしています。市場のトレンドを予測し、価格の動きを慎重に分析するのに優れています。機関の戦略とトレードを合わせることで、市場の動向についてより正確な予測ができます。このインジケーターは多目的であり、市場構造を分析し、重要な注文ブロックを特定し、さまざまなパターンを認識するのに優れています。 このインジケーター
Professional Opening Range Breakout (ORB) indicator designed for precision session trading with automatic time handling, breakout alerts, and advanced target levels. This indicator automatically identifies the Opening Range for any configurable session, plots the High, Low, and Midpoint levels, and extends them across the trading day. Built-in breakout detection and alerts, range measurements, and extension targets provide traders with clear structure and actionable levels. Ideal for traders usi
Mtf Candle – An Advanced Tool for Your Trading Strategy Analyze the market, identify trends, and enhance your strategy! Mtf Candle is an innovative indicator designed for professional traders, offering a clear and structured way to visualize market dynamics. With this tool, technical analysis becomes structured and easily accessible. What Does Mtf Candle Offer? In-depth Bar Analysis – Monitor bars across multiple timeframes and determine whether they indicate an uptrend or downtrend. Precise St
A scalping indicator based on mathematical patterns, which on average gives signals with relatively small SL, and also occasionally helps to catch big moves in the markets (more information in the video) This indicator has three main types of notifications: The first type warns of a possible/upcoming signal on the next bar The second type indicates the presence of a ready signal to enter the market/open a position The third type is for SL and TP levels - you will be notified every time price re
CurvedSmoothChannel_Enhanced - 強化された価格チャネルインジケーター **CurvedSmoothChannel_Enhanced** は、MetaTrader 5 向けに設計された、強力で視覚的に魅力的な価格チャネルインジケーターです。トレンド、潜在的な反転、主要な価格レベルを正確に特定するのに役立ちます。この強化版は、ハル移動平均(HMA)とジョン・エーラーズ氏のスーパースムーズフィルターの機能を組み合わせ、複数の時間枠にわたる市場状況に合わせて調整する、動的で適応性の高いチャネルを構築します。 #### 主な機能: - **スムーズで適応性の高いミドルライン:** このインジケーターの中核となるのは、HMA に基づくスーパースムーズラインです。歪みを最小限に抑え、価格トレンドに忠実に追従します。 - **多層チャネル構造:** 3種類のチャネルラインを表示します。 - **外側のライン(タイト、黄色):** メインチ​​ャネルの境界を表し、トレンドの方向とブレイクアウトの可能性を判断するのに役立ちます。 - **内側の線(ややタイト、赤と緑):*
DhanrangSMC
Dharagauri Niteshkumar Rangani
SMC Indicator for MT5 – Trade Like Institutions Unlock the power of institutional trading with the Smart Money Concepts (SMC) Indicator for MetaTrader 5 . Designed for traders who want to go beyond retail strategies, this advanced tool helps you identify market structure shifts, order blocks, liquidity zones, and fair value gaps with precision and clarity. Key Features: Automatic Market Structure Detection : Instantly spot Breaks of Structure (BOS), CHoCH, and trend shifts. Multi-Timeframe
DYJスーパートレンド波は高度に正確なピークと谷取引システムである。 この指標は市場に進出する時にろうそくの糸の最高点と最低点を探す。 シグナルの通知タイプがdyj supertrendに追加されました。 多空間信号が発生すると、 Alert mailSend、MobilePushという種類の通知信号を使用できます。 Input InpSignalPeriod = 10 BarDistance = 24 InpIsAlert = true ===================== DYJ SuperTrendWave is a highly accurate trading system. This indicator looks for the highest and lowest points of candles as entering and leaving the market. The notification type of signal has been added to the dyj supertrend. When a multi-space signa
The  SuperTrend Advance Trading  is a widely-used technical indicator based on  SuperTrend Strategy + Price Action + EMA . How it works: -  Buy/Sell Signals  can be generated when the trend reverses, the conditions of Price action, TrendLine and EMA are met. - After the  Signal  appears, be patient and wait until the candle closes, at that time place the order as soon as possible. You may have time to review your entry, consider whether it is a good entry or not. - Carefully review the entry, up
このプロダクトを購入した人は以下も購入しています
ARIPoint is a powerful trading companion designed to generate high-probability entry signals with dynamic TP/SL/DP levels based on volatility. Built-in performance tracking shows win/loss stats, PP1/PP2 hits, and success rates all updated live. Key Features: Buy/Sell signals with adaptive volatility bands Real-time TP/SL/DP levels based on ATR Built-in MA Filter with optional ATR/StdDev volatility Performance stats panel (Success, Profit/Loss, PP1/PP2) Alerts via popup, sound, push, or email Cu
CGE Trading Suite
Carl Gustav Johan Ekstrom
5 (2)
Institutional-Grade Analytics for MT5 C GE Trading Suite delivers the analytical edge typically reserved for professional trading desks. The platform integrates a full suite of analytical tools into one seamless workflow: dynamic grid mapping, liquidity behavior analysis, ECM, trend lines, MIDAS, trade cycles, and directional channel projections. Together, these provide a unified view of market structure and momentum. Directional clarity is further enhanced by the capital flow index, which meas
ARICoin is a powerful trading companion designed to generate high-probability entry signals with dynamic TP/SL/DP levels based on volatility. Built-in performance tracking shows win/loss stats, PP1/PP2 hits, and success rates all updated live. Key Features: Buy/Sell signals with adaptive volatility bands Real-time TP/SL/DP levels based on ATR Built-in MA Filter with optional ATR/StdDev volatility Performance stats panel (Success, Profit/Loss, PP1/PP2) Alerts via popup, sound, push, or email Cust
AriX
Temirlan Kdyrkhan
1 (4)
AriX Indicator for MT5 A powerful trend-following and signal-evaluation tool AriX is a custom MT5 indicator that combines Moving Averages and ATR-based risk/reward logic to generate clear buy/sell signals. It visualizes dynamic SL/TP levels, evaluates past trade outcomes, and displays win/loss statistics in a clean on-chart panel. Key features include: Buy/Sell signals based on MA crossovers ATR-based SL/TP1/TP2/TP3 levels with visual lines and labels Signal outcome tracking with real-time stat
ZIVA Signal Intelligence
Hassan Abdullah Hassan Al Balushi
ZIVA Signal Intelligence An Adaptive, Modular Market Intelligence System ZIVA Signal Intelligence is not positioned as a conventional trading indicator. It is a fully integrated, proprietary market intelligence system engineered to deliver structured, high-precision interpretation of price behavior within a controlled analytical environment. Developed through an independent architectural approach, ZIVA does not rely on, derive from, or replicate existing indicators. It represents a standalone
IVISTscalp5
Vadym Zhukovskyi
5 (6)
iVISTscalp5 — 時間ベースの市場予測システム iVISTscalp5は一般的なインジケーターではありません。 MetaTrader 5向けの時間ベースの予測システムであり、 市場がいつ動く可能性が高いかを特定します。 ⸻ 特徴  • 正確なタイミング  • BUY / SELL予測  • 平均利益の可能性  • 週間予測  • 120以上の金融商品 ⸻ コンセプト 市場は価格だけでなく時間によっても動く ⸻ iVISTscalp5 — 時間による優位性 iVISTscalp5インジケーターをご紹介します。このインジケーターは、トレーディングにおいて独自でありながら効果的です。時間データに基づくこのインジケーターは、多年にわたる経験と金融市場の深い分析の結果です。iVISTscalp5インジケーターは、手動トレーディングにとって優れたツールです。便利さ、簡単さ、可視化 - すべての複雑さが内部に隠されています。私たちは、iVISTscalp5インジケーターの設定と使用を最大限に簡素化しました。このインジケーターは、MT5ターミナルにあるすべての金融商品
ARIScalp is a powerful trading companion designed to generate high-probability entry signals with dynamic TP/SL/DP levels based on volatility. Built-in performance tracking shows win/loss stats, PP1/PP2 hits, and success rates all updated live. Key Features: Buy/Sell signals with adaptive volatility bands Real-time TP/SL/DP levels based on ATR Built-in MA Filter with optional ATR/StdDev volatility Performance stats panel (Success, Profit/Loss, PP1/PP2) Alerts via popup, sound, push, or email Cus
note: this indicator is for METATRADER4, if you want the version for METATRADER5 this is the link:  https://www.mql5.com/it/market/product/108106 TRENDMAESTRO ver 2.5 TRENDMAESTRO recognizes a new TREND from the start, he never makes mistakes. The certainty of identifying a new TREND is priceless. DESCRIPTION TRENDMAESTRO identifies a new TREND in the bud, this indicator examines the volatility, volumes and momentum to identify the moment in which there is an explosion of one or more of these da
Rtc ML Ai | Predictor CORE MACHINE LEARNING ENGINE Adaptive ML Market Predictor – Multi-Bar Trend & Candle Forecast What This Indicator Does This indicator is a  real-time market prediction engine  designed to analyze price behavior and estimate  future market tendencies . Unlike conventional indicators, this system  does not rely on static parameters or historical curve-fitting , but adapts its internal state dynamically during live market operation. Instead of using static rules, the indic
VTrende Pro
Andrii Diachenko
5 (1)
VTrende Pro - MTF indicator for trend trading with a display panel for MT5 *** Videos can be translated into any language using subtitles (video language - Russian) Although the signals of the VTrende Pro indicator can be used as signals of a full-fledged trading system, it is recommended to use them in conjunction with the Bill Williams TS. VTrende Pro is an extended version of the VTrende indicator. Difference between Pro version and VTrende: - Time zones - Signal V - signal 1-2 waves -    S
WARNING: This indicator is distributed EXCLUSIVELY on MQL5.com MT4 version:   https://www.mql5.com/it/market/product/160363 MT5 version:   https://www.mql5.com/it/market/product/160410 MAX RIBBON ver 1.00 The indicator that shows you the TREND clearly and unambiguously! DESCRIPTION MAX RIBBON is an advanced trend indicator that combines two ribbon systems to accurately identify market direction: • MaxRib2 (Fast Ribbon): Responsive to short-term movements, ideal for capturing rapid reversals and
*** ### **Triple Crox Strategy - Professional Trading System** **Overview** The Triple Crox Strategy is an advanced technical indicator for MetaTrader 5, designed for serious traders. It synthesizes multiple analysis methodologies—including moving averages, Average True Range (ATR), Relative Strength Index (RSI), and cloud configurations—to generate highly reliable and precise trading signals. **Core Configuration** **Setup Types** *   **Setup Open/Close:** Utilizes Heikin Ashi can
Red and Green Light – Intelligent Trading Signal Indicator Product Overview Red and Green Light is a professional trading signal indicator based on the multi-stage T3 smoothing algorithm. It integrates a visual traffic light system, intelligent signal recognition, risk alerts, and multiple notification features. Whether you're a manual trader or an Expert Advisor (EA) developer, this indicator helps you capture market opportunities with greater precision and effectively avoid the risks of
Recommended TimeFrame >= H1. 100% Non Repainted at any moment.  Use it carefully, only with Trend Direction. Trading Usage: 2 Variants: as Range System or as BreakOut System (Both Only With Trend Direction)::: (Always use StopLoss for minimise Risk); [1] as Range System: (Recommended) in UP TREND:  - BUY in Blue Line , then if price goes down by 50 points (on H1) open Second BUY.   Close in any Profit you wish: TrailingStop(45 points) or Close when Price touches upper Gold Line. in DOWN TREND
FXLAND Smart Reversal Indicator (MT5) FXLAND Smart Reversal Indicator is a professional technical analysis tool designed to help traders identify potential price reversal zones and key market turning points with clarity and precision. The best reversal indicator and price return by choosing only one ceiling or floor in each time frame A masterpiece of combining mathematics and Gann, fractal matrix, Fibonacci, movement angle and time. Completely intelligent Key Features Detects potenti
"Piranha" - an autonomous trading system that determines overbought and oversold levels on the chart. Red and blue zones represent overbought and oversold levels respectively. Entry points are marked with arrows: a downward arrow in the red zone for "sell" and an upward arrow in the blue zone for "buy". The Take profit level is indicated by the green moving average. Key features: Adjusting the Take profit level as the green moving average changes position. Averaging ability when a new market e
A tool for on-chart strategy backtesting and performance analysis. A utility for developing, debugging, and testing custom trading ideas and indicator functions. An indicator designed to quickly test trading concepts and visualize the effectiveness of different input parameters. An all-in-one sandbox for testing everything from simple crossovers to complex, multi-condition trading systems.
The Expert Advisor and the video are attached in the Discussion tab . The robot applies only one order and strictly follows the signals to evaluate the indicator efficiency. Pan PrizMA CD Phase is an option based on the Pan PrizMA indicator. Details (in Russian). Averaging by a quadric-quartic polynomial increases the smoothness of lines, adds momentum and rhythm. Extrapolation by the sinusoid function near a constant allows adjusting the delay or lead of signals. The value of the phase - wave s
Классификатор силы тренда. Показания на истории не меняет. Изменяется классификация только незакрытого бара. По идее подобен полной системе ASCTrend, сигнальный модуль которой, точнее его аппроксимация в несколько "урезанном" виде, есть в свободном доступе, а также в терминале как сигнальный индикатор SilverTrend . Точной копией системы ASCTrend не является. Работает на всех инструментах и всех временных диапазонах. Индикатор использует несколько некоррелируемых между собой алгоритмов для класси
FFx Universal Strength Meter PRO is more than a basic strength meter. Instead of limiting the calculation to price, it can be based on any of the 19 integrated strength modes + 9 timeframes. With the FFx USM, you are able to define any period for any combination of timeframes. For example, you can set the dashboard for the last 10 candles for M15-H1-H4… Full flexibility! Very easy to interpret... It gives a great idea about which currency is weak and which is strong, so you can find the best pai
The FFx Universal MTF alerter shows on a single chart all the timeframes (M1 to Monthly) with their own status for the chosen indicator. 9 indicators mode (MACD-RSI-Stochastic-MA-ADX-Ichimoku-Candles-CCI-PSAR). Each can be applied multiple times on the same chart with different settings. Very easy to interpret. Confirm your BUY entries when most of the timeframes are showing green color. And confirm your SELL entries when most of the timeframes are showing red color. 2 Alert Options : input to s
The FFx Watcher PRO is a dashboard displaying on a single chart the current direction of up to 15 standard indicators and up to 21 timeframes. It has 2 different modes: Watcher mode: Multi Indicators User is able to select up to 15 indicators to be displayed User is able to select up to 21 timeframes to be displayed Watcher mode: Multi Pairs User is able to select any number of pairs/symbols User is able to select up to 21 timeframes to be displayed This mode uses one of the standard indicators
FFx Patterns Alerter gives trade suggestions with Entry, Target 1, Target 2 and StopLoss .... for any of the selected patterns (PinBar, Engulfing, InsideBar, OutsideBar) Below are the different options available: Multiple instances can be applied on the same chart to monitor different patterns Entry suggestion - pips to be added over the break for the entry 3 different options to calculate the SL - by pips, by ATR multiplier or at the pattern High/Low 3 different options to calculate the 2 TPs -
MetaTrader 4 version available here : https://www.mql5.com/en/market/product/24881 FFx Basket Scanner is a global tool scanning all pairs and all timeframes over up to five indicators among the 16 available. You will clearly see which currencies to avoid trading and which ones to focus on. Once a currency goes into an extreme zone (e.g. 20/80%), you can trade the whole basket with great confidence. Another way to use it is to look at two currencies (weak vs strong) to find the best single pairs
MetaTrader 4 version available here: https://www.mql5.com/en/market/product/25793 FFx Pivot SR Suite PRO is a complete suite for support and resistance levels. Support and Resistance are the most used levels in all kinds of trading. Can be used to find reversal trend, to set targets and stop, etc. The indicator is fully flexible directly from the chart 4 periods to choose for the calculation: 4Hours, Daily, Weekly and Monthly 4 formulas to choose for the calculation: Classic, Camarilla, Fibonac
ClassicSBA
Umri Azkia Zulkarnaen
this indicator very simple and easy if you understand and agree with setup and rule basic teknical sba you can cek in link : please cek my youtube channel for detail chanel : an for detail info  contact me  basicly setup buy (long) for this indicator is Magenta- blue and green candle or magenta - green  and green candlestik and for setup sell (short) is Black - yellow - and red candle or black - red  and red candlestik
Indicador en base a la pendiente de la linea de precio, dibuja una línea de color cuando sube a base de los precios que previamente has sido procesados o linealizados, y cuando baja la pendiente la linea linealizada toma otro color. En este caso se a considerado 6 lineas de diferentes procesos desde pendientes largas hacia las cortas, observándose que cuando coincidan las pendientes se produce un máximo o mínimo, lo que a simple vista nos permitirá hacer una COMPRA O VENTA.
Индикатор Coefficient Of Determination (COD) представляет собой значение коэффициента детерминации или квадрат коэффициента корреляции между зависимой переменной — ценой и объясняющей переменной — тиковым объемом. Что это дает нам на практике? COD отлично распознает кульминацию трендовых движений, что позволяет подбирать оптимальные точки и ловить развороты рынка. Как использовать индикатор: Наиболее популярная торговая стратегия строится совместно с трендовым индикатором Moving Average (MA), пе
Fibonacci Múltiple 12, utiliza la serie fibonacci plasmado en el indicador fibonacci, aumentadolo 12 veces según su secuencia. El indicador fibonacci normalmente muestra una vez, el presente indicador se mostrara 12 veces empezando el numero que le indique siguiendo la secuencia. Se puede utilizar para ver la tendencia en periodos cortos y largos, de minutos a meses, solo aumentado el numero MULTIPLICA.
En base a cálculos matemáticos de determino una linea Horizontal que cruza a todas las señales de trading, mostrando los máximos y mínimos. La linea horizontal parte en dos las subidas y bajadas de las señales de trading, de tan manera que es fácil identificar los máximos y mínimos, y es inteligente por que es sensible a las subidas y bajadas, afín de no quedarse en un solo lado por siempre, trabaja excelentemente con otros indicadores suavizadores ya que les garantiza que en un intervalo de tie
作者のその他のプロダクト
Skix0ne
Fernando Souza Mendes
Utility of the Indicator Multifaceted Analysis : Allows for a comprehensive view of the market through different metrics (trend, volatility, momentum, risk, support/resistance). Trading Signals : Offers clear buy and sell signals, aiding traders in making entry and exit decisions. Risk Management : The risk buffer helps to assess when it is safe or risky to execute trading operations. Customizable Visualization : With multiple colors and chart styles, it becomes easy for the trader to interpre
Eastwist
Fernando Souza Mendes
EASTWIST.mq5 works well in short-term operations. The sensitivity to short-term market signals, provided by the RSI and MACD indicators, along with the simulated Machine Learning decision logic, really seems to be an effective combination for capturing rapid price movements. The ability to respond quickly to market conditions is a valuable feature in scalping or day trading strategies, where precision and speed in order execution are crucial. Indication of Use: For Traders with Technical Knowle
Dyne
Fernando Souza Mendes
This isn't just an indicator; it's a top-tier market analysis tool that combines the power of various technical analysis techniques into one package. Perfect for traders seeking precision and clarity in their trading decisions. Key Features: HiLo Activator: Easily capture the essence of market trends. This component differentiates between bullish or bearish markets, helping you to be on the right side of the move. MACD (Moving Average Convergence Divergence): Quickly identify changes in market
Stceffe
Fernando Souza Mendes
メタトレーダー5 の未来の自動取引をSTCEFFEで発見 - あなたの エリートエキスパートアドバイザー ! 精度と信頼性:STCEFFEは、自動取引の卓越性を求めるトレーダーのための最新のエキスパートアドバイザーです。このEAは、 移動平均線 、RSI、 ボリンジャーバンド 、ADX、 ストキャスティクス などの技術指標の高度な組み合わせを利用して、非常に正確な買いと売りのシグナルを提供します。 複合シグナルシステム :従来のEAとは異なり、STCEFFEは一つの指標に依存しません。複数のソースから複合シグナルを生成し、精度を大幅に向上させ、誤検出を減少させます。BUY(買い)かSELL(売り)かに関わらず、意思決定が多面的な分析によって裏付けられている自信があります。 高度な リスク管理 :自己資本のパーセンテージに基づくリスク管理オプションと動的なロットサイズ計算により、STCEFFEは他のEA以上に資本を保護します。 ストップロス とテイクプロフィットを自動的に調整し、日次および週次の ドローダウン制限 を尊重することで、許容される損失を超えないようにします。 堅牢性とセキュ
Wolken
Fernando Souza Mendes
WOLKEN 主な機能: マルチインジケーター戦略と高度なフィルター: 使用インジケーター: 移動平均線(MA)、RSI、ボリンジャーバンド、ADX、ストキャスティクス、ATR、OBV(On-Balance Volume)。 複合シグナル: 3つ以上のインジケーター の確認が必要で、誤ったシグナルの発生を減少。 トレンドフィルター(OBV): 出来高の方向を確認し、シグナルを検証。 ダイナミックSL/TP: ATR(Average True Range) を基に、 市場のボラティリティ に適応。 プロフェッショナルなリスク管理: ATRのフォールバック: 現在のATR値が無効な場合、ATRの移動平均を使用。 損失制限: 事前に設定された 1日または1週間の損失制限 に達すると取引を停止。 証拠金/スプレッドの確認: リアルタイムで取引条件をチェック。 革新的な技術機能: 自動最適化: ATRMultiplier と TPRatio を 直近のパフォーマンスに基づいて自動調整 。 トレーニングモード: バックテスト完了後に 詳細なパフォーマンスレポートを生成。 ニュースフィルター: N
フィルタ:
レビューなし
レビューに返信