Balanced Work

Balanced Work Indicator: Your Gateway to Trend Trading

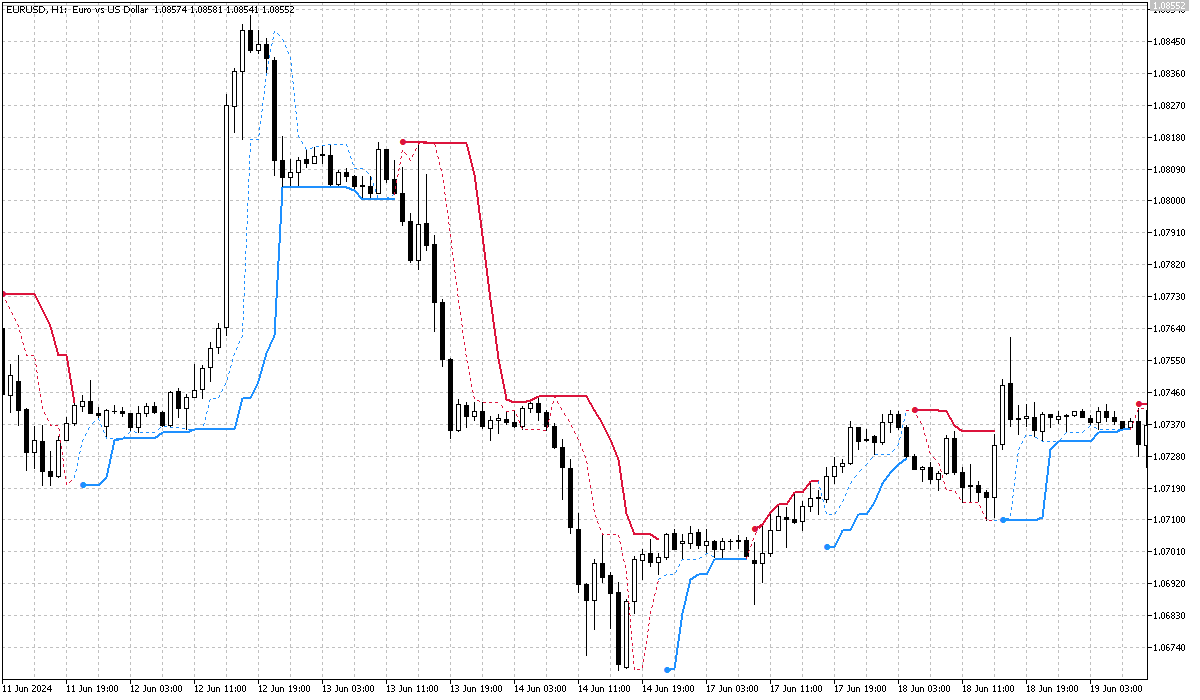
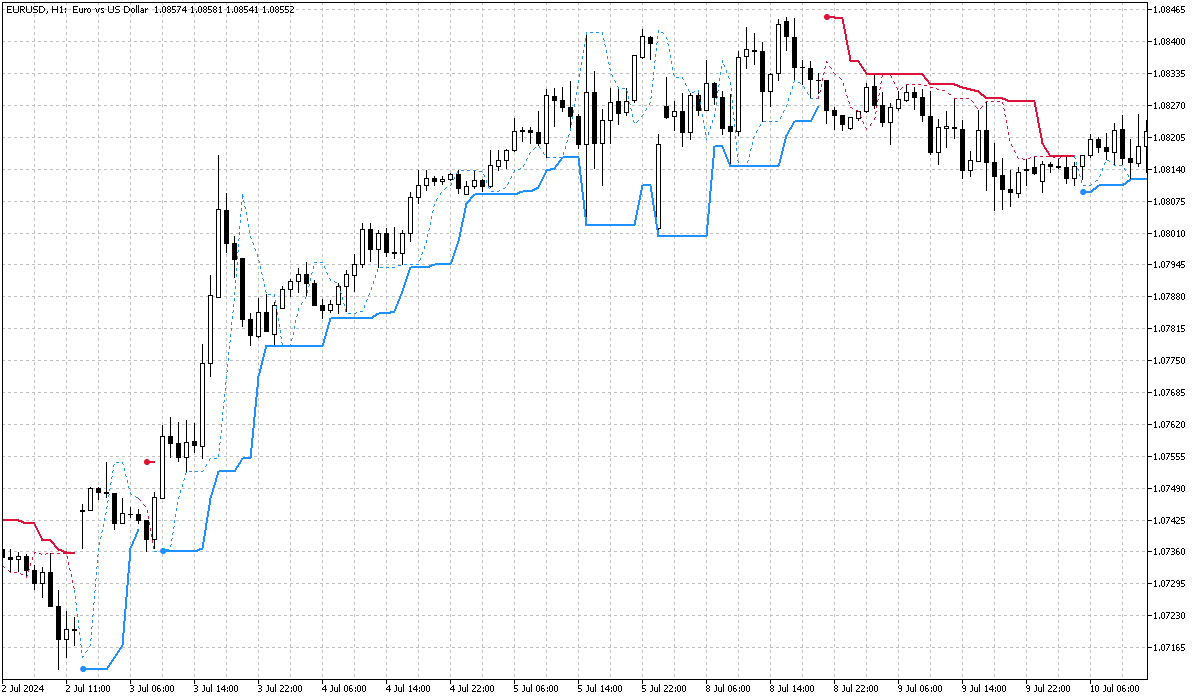
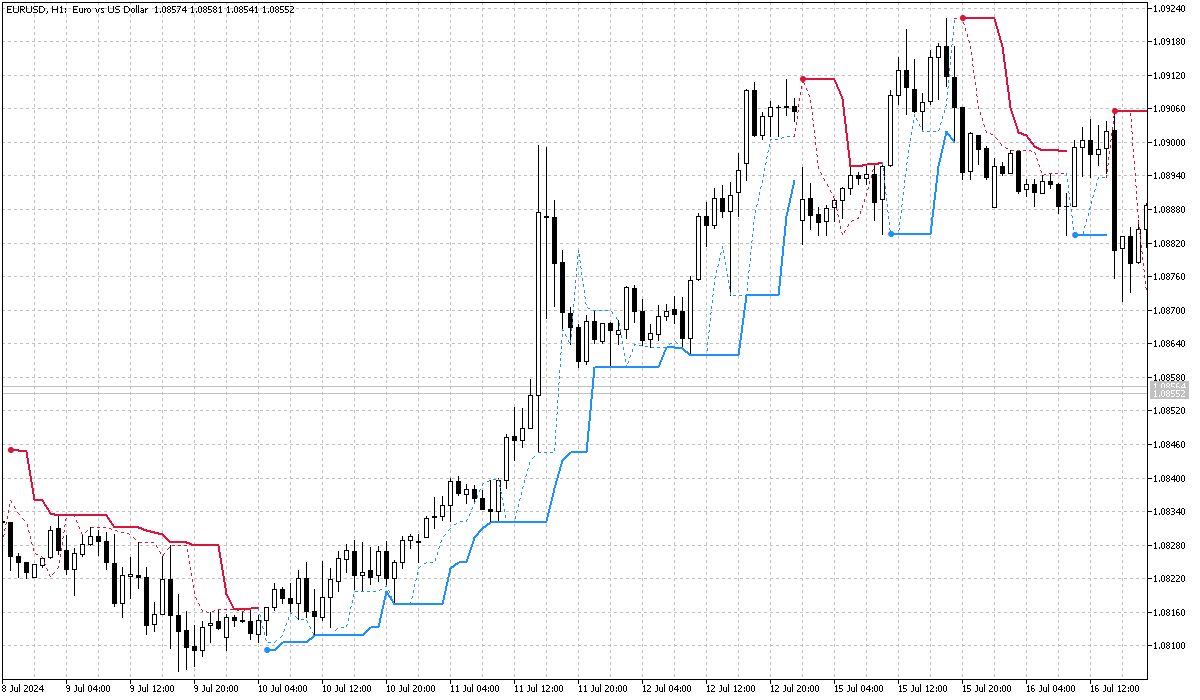
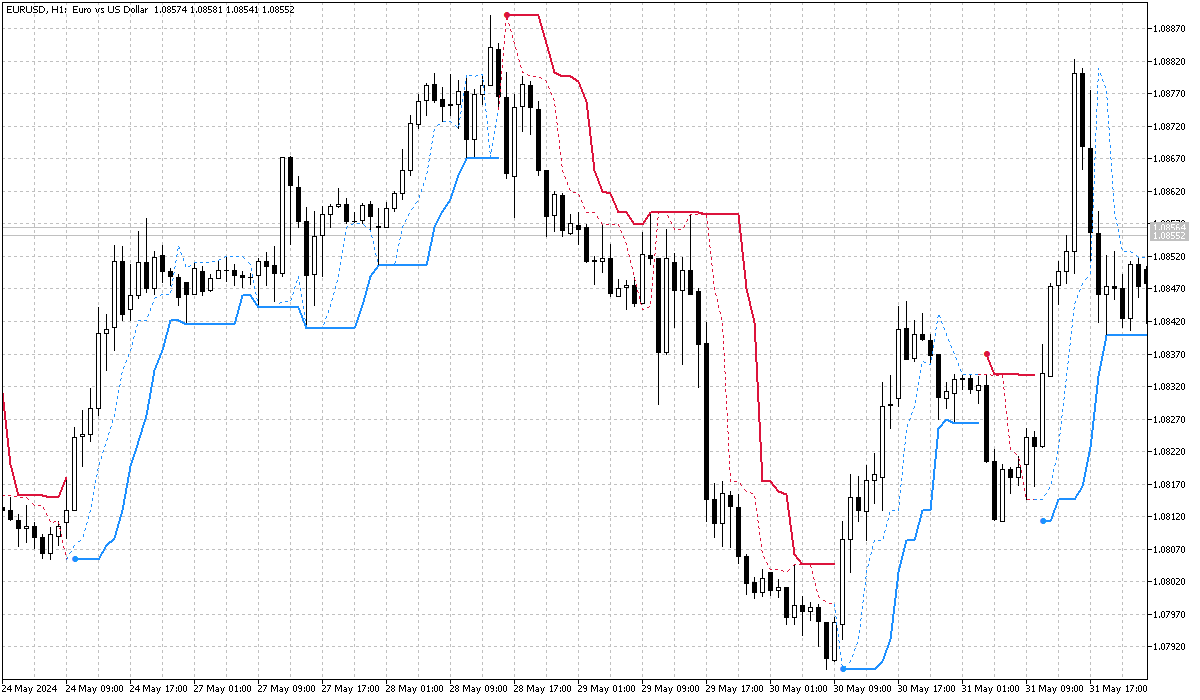
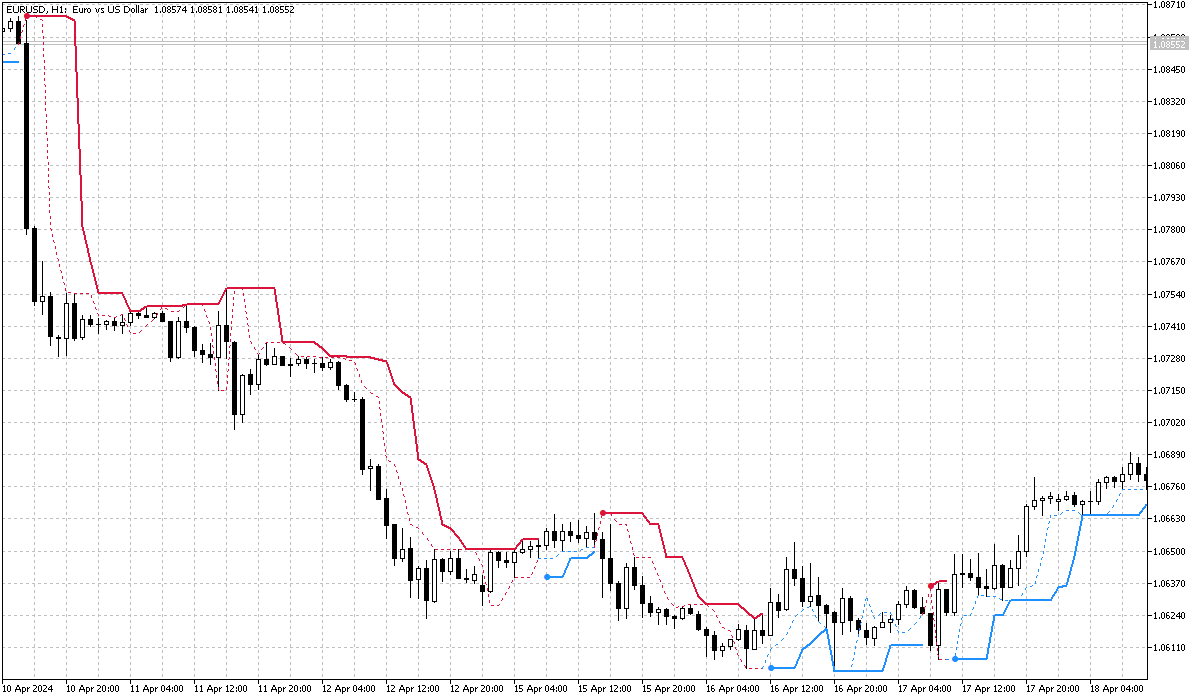
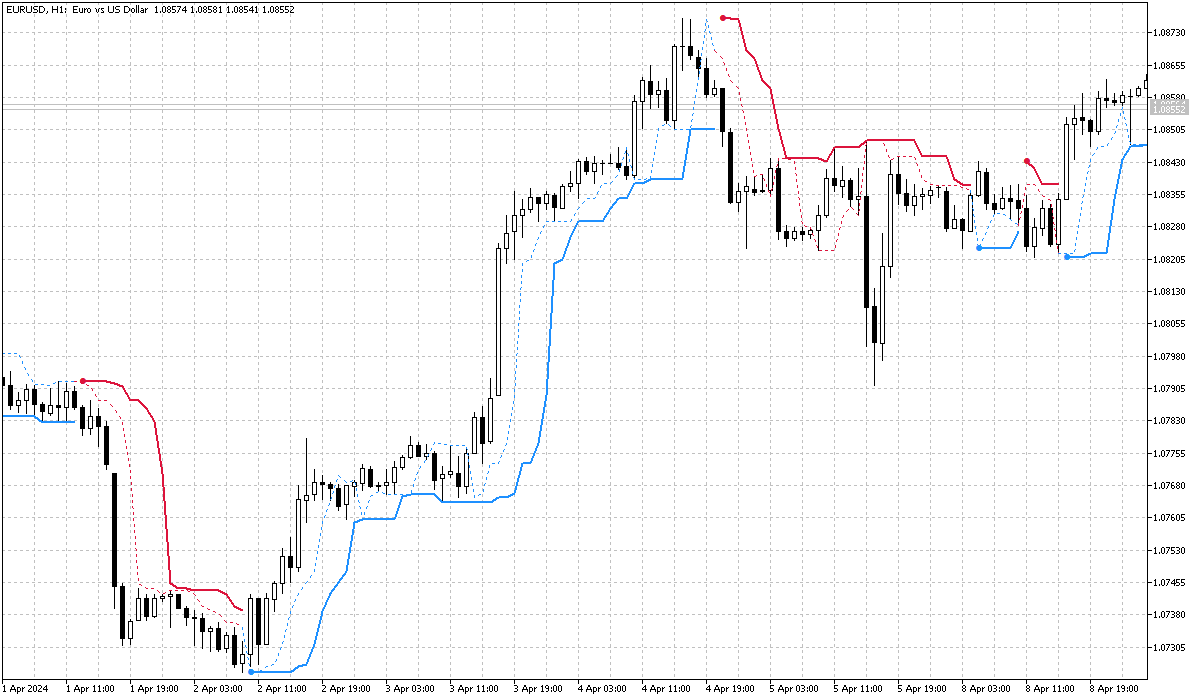
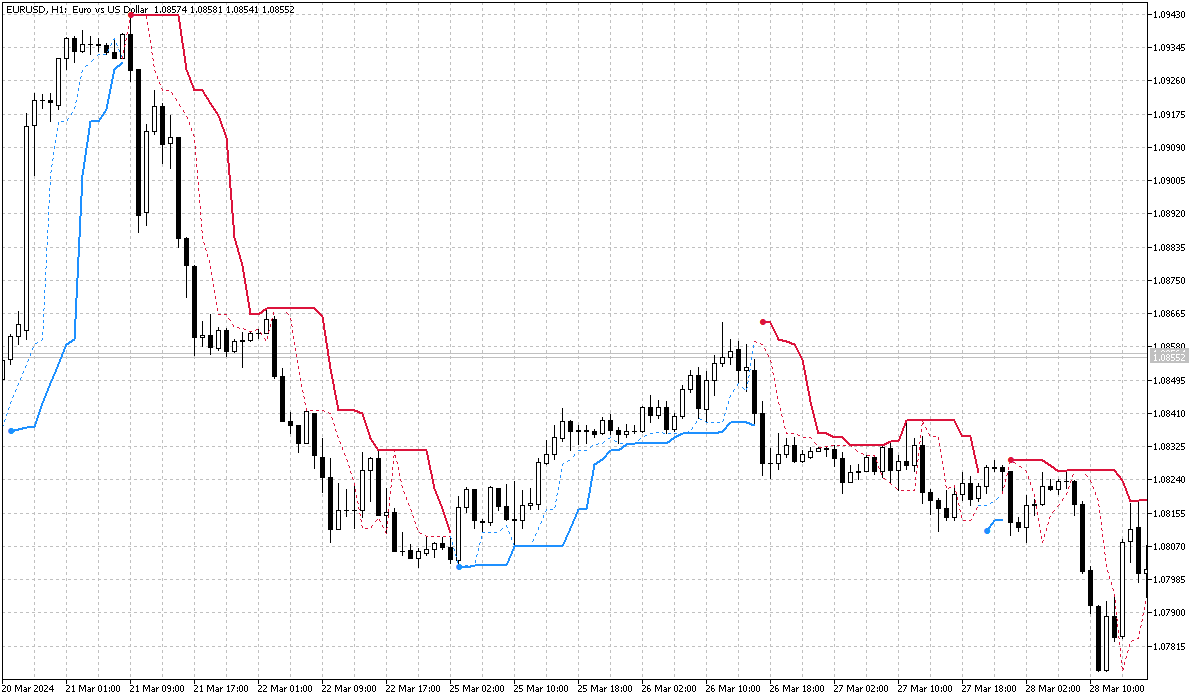
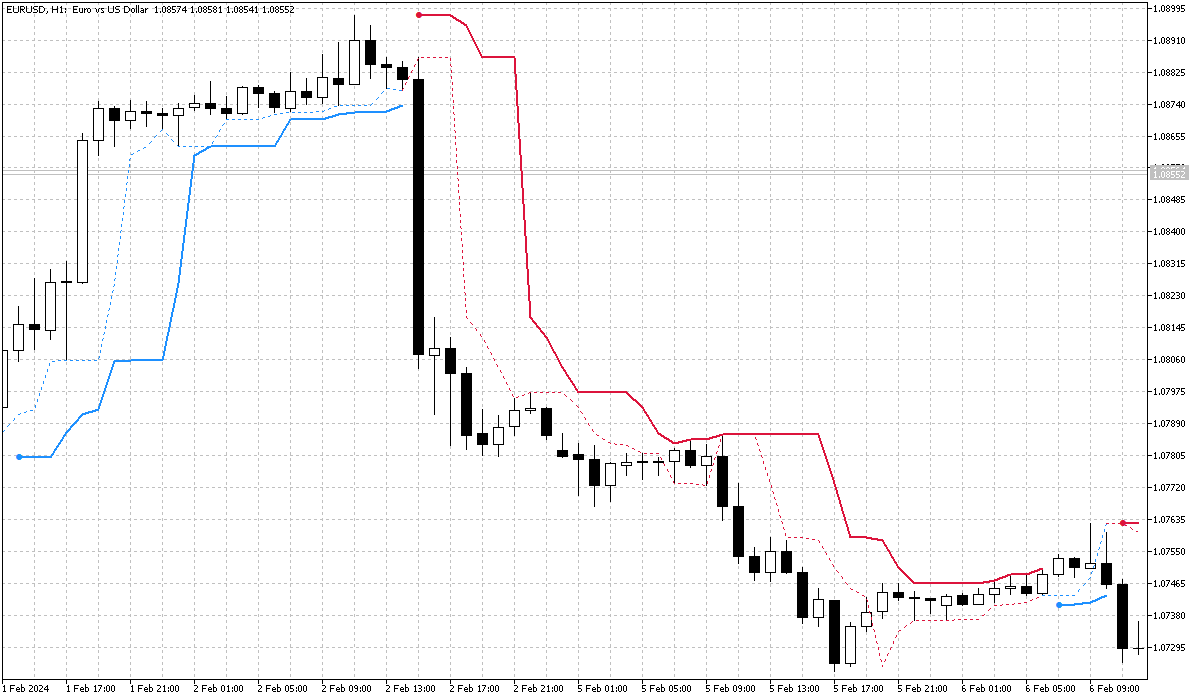
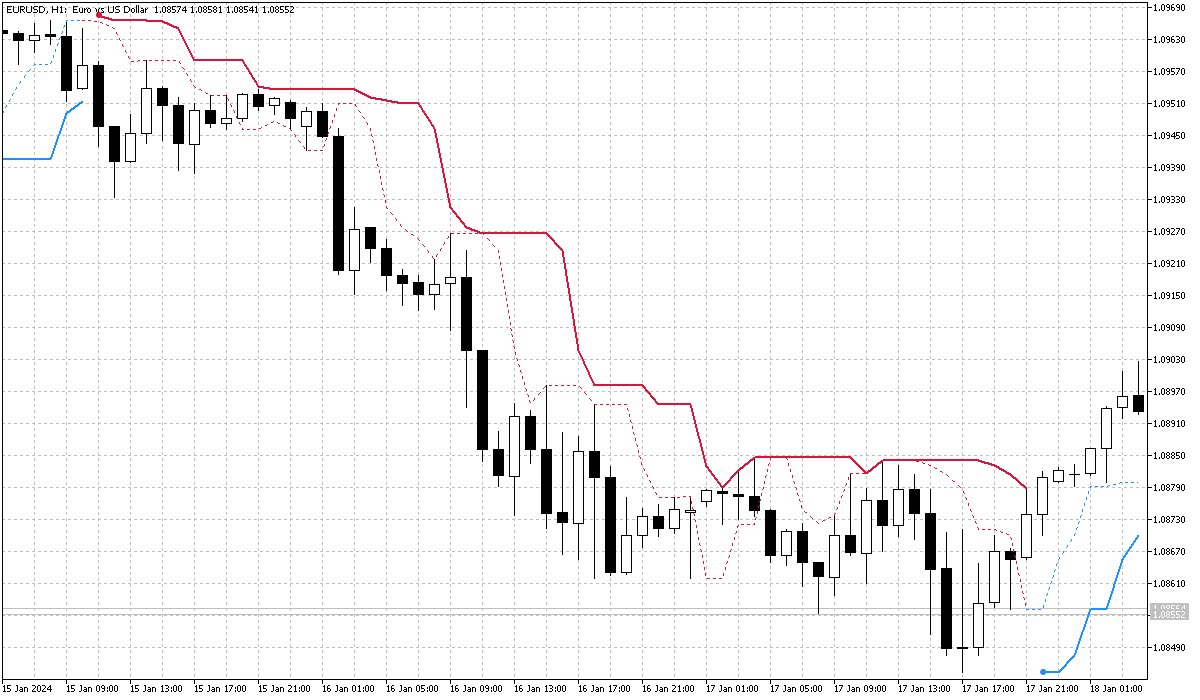
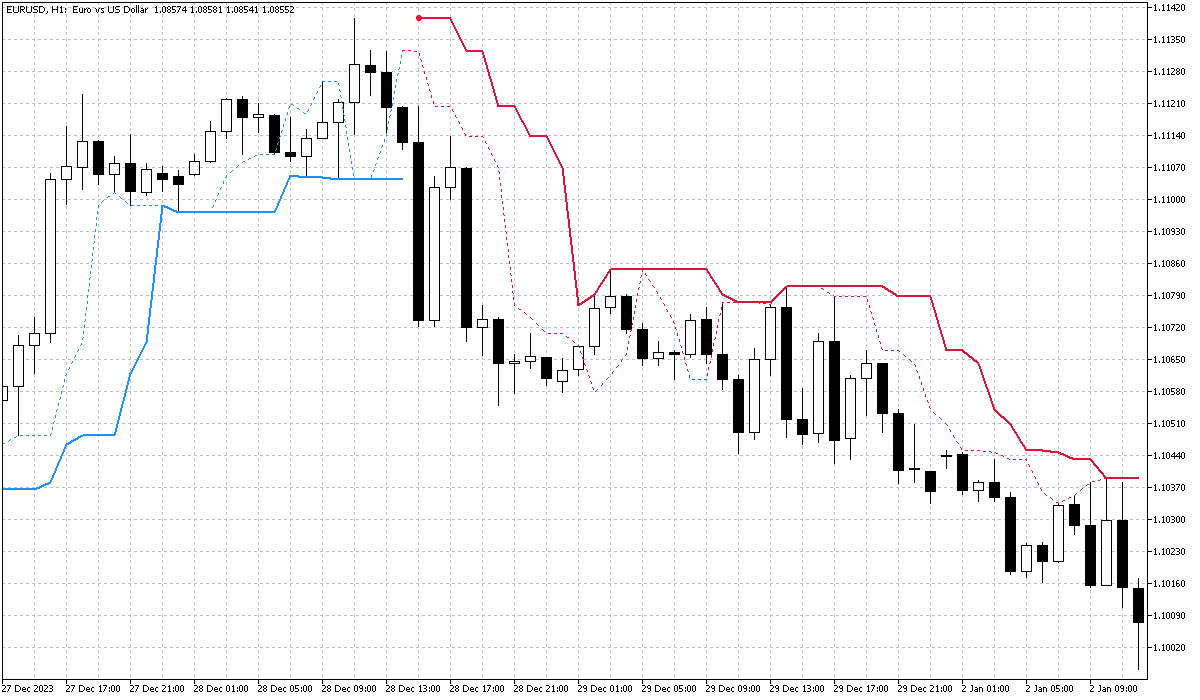
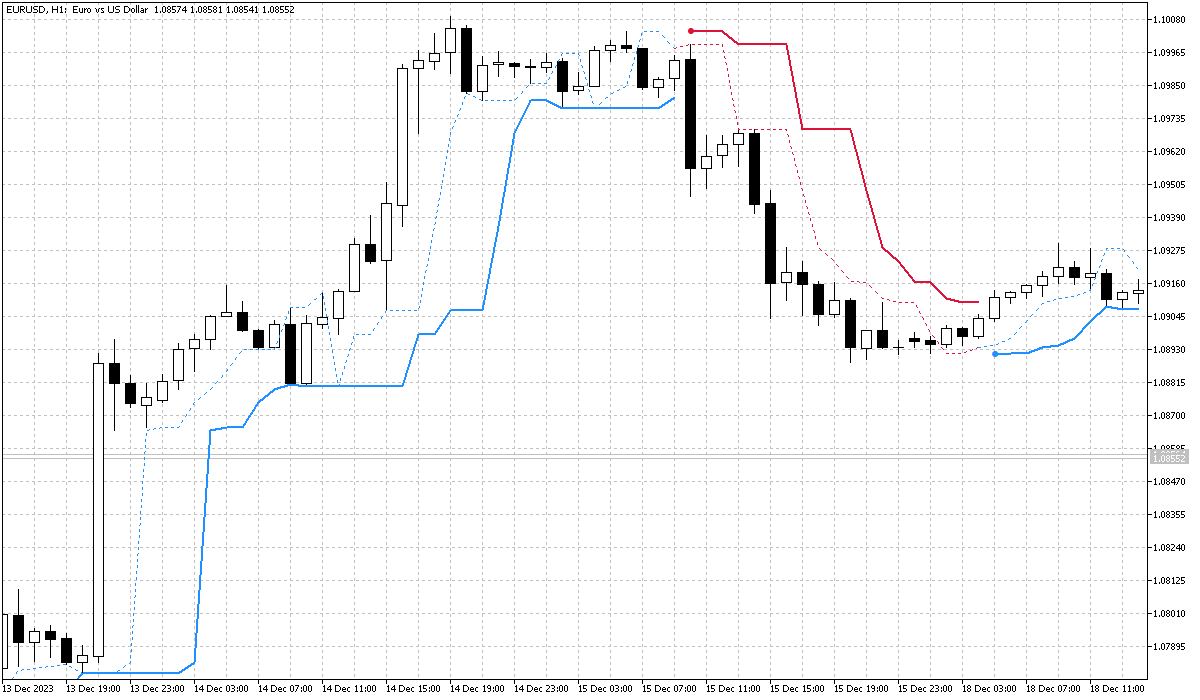
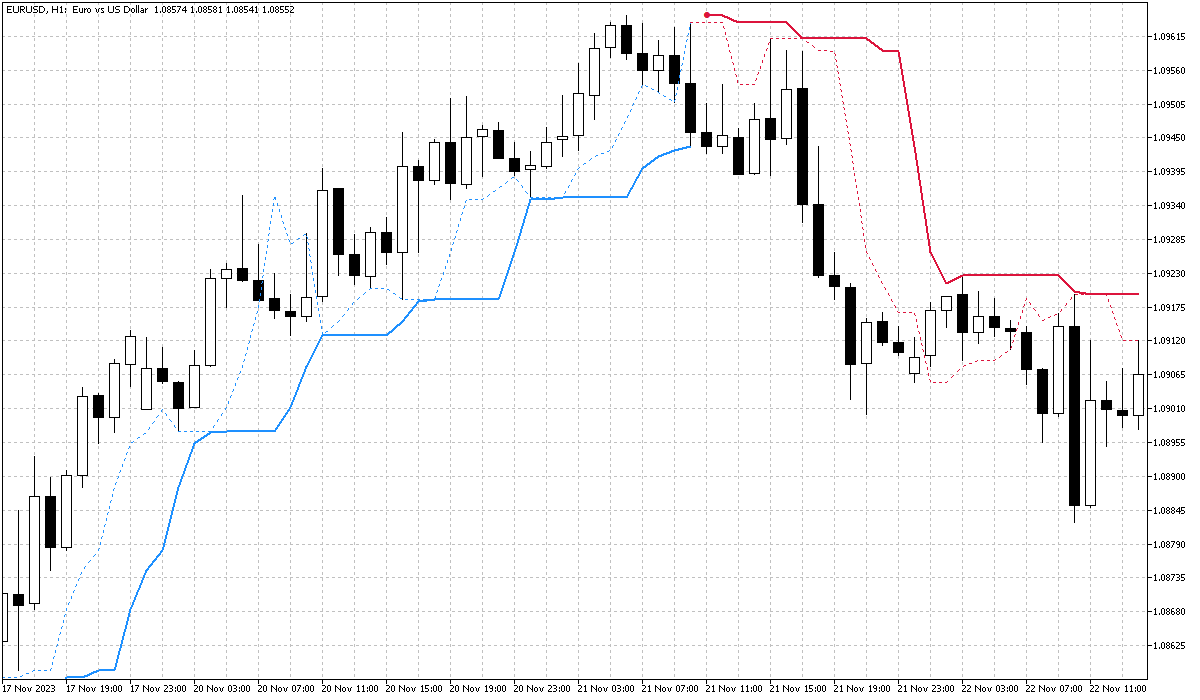
Balanced Work is a trend-following indicator designed to simplify market analysis and trading decisions. This algorithmic tool draws two-colored dots along the price chart, connected by lines, offering a clear visual representation of market trends. The simplicity of this indicator lies in its color-coded signals: buy when a blue dot appears and sell when a red dot appears. It is particularly effective for scalping and pipsing, and it has proven to be a reliable tool for traders.

Key Features of Balanced Work

  • Visual Clarity: The indicator uses blue and red dots to signal potential buying and selling points, respectively, making it easy for traders to follow the market's direction.
  • Trend Analysis: Balanced Work excels at analyzing trend direction over specific time intervals, helping traders identify the prevailing market trend.
  • Beginner-Friendly: This indicator is perfect for novice traders who are learning market dynamics with the help of trend-following tools.

Understanding Market Trends with Balanced Work

Types of Trends

  • Bullish Trend: When the price moves upward, indicating a buying opportunity.
  • Bearish Trend: When the price moves downward, signaling a selling opportunity.
  • Sideways (Flat) Trend: When the price fluctuates within a narrow range, indicating market indecision.

Balanced Work helps traders detect these trends and their direction, allowing for timely and informed trading decisions.

Advantages of Using Balanced Work

  • Early Trend Detection: The indicator effectively identifies the beginning and end of trends, as well as potential reversal points.
  • Scalping and Pipsing: Ideal for short-term trading strategies, Balanced Work provides quick and actionable signals for entry and exit points.
  • Comprehensive Market View: By using multiple trend indicators in conjunction, traders can get a more detailed and accurate picture of the market conditions.

Practical Applications of Balanced Work

Scalping with Balanced Work

  1. Setup: Apply Balanced Work on a short time frame, such as M5 or M15.
  2. Buy Signal: Enter a long position when a blue dot appears.
  3. Sell Signal: Enter a short position when a red dot appears.
  4. Exit Strategy: Use additional indicators or price action to determine the best exit points for maximizing profits.

Trend Following for Long-Term Trades

  1. Setup: Apply Balanced Work on a longer time frame, such as H1 or H4.
  2. Trend Confirmation: Use the dots to confirm the trend direction before making a trade.
  3. Position Management: Adjust your stop-loss and take-profit levels based on the indicator's signals and overall market analysis.

Maximizing the Use of Balanced Work

  • Combine with Other Indicators: Enhance the reliability of your trading strategy by using Balanced Work alongside other technical indicators, such as moving averages or RSI.
  • Adapt to Different Markets: While primarily used in the Forex market, Balanced Work can also be applied to stocks, commodities, and cryptocurrencies for broader trading opportunities.
  • Regular Updates: Stay updated with the latest market news and events to ensure your trading strategy remains effective and aligned with current market conditions.

Conclusion

Balanced Work is a powerful and straightforward trend-following indicator that simplifies the trading process by providing clear, visual signals for buying and selling. Whether you are a beginner or an experienced trader, this tool can help you make more informed decisions and enhance your trading performance. Start using Balanced Work today and experience a more efficient and effective way to trade market trends.

Enhanced Content for Deeper Insights

Detailed Analysis of Trend Types

Understanding the nature of different market trends is crucial for effective trading. Balanced Work helps you identify:

  • Bullish Trends: Characterized by higher highs and higher lows, indicating a strong buying interest.
  • Bearish Trends: Marked by lower lows and lower highs, signaling a dominant selling pressure.
  • Sideways Trends: Occur when the market lacks a clear direction, with prices oscillating within a range.

Using Balanced Work, traders can easily distinguish between these trends and adapt their strategies accordingly.

Real-World Trading Scenarios

To illustrate the practical application of Balanced Work, let's consider two scenarios:

  1. EUR/USD on M15:

    • Initial Setup: Apply Balanced Work on a 15-minute chart.
    • Trade Execution: Enter a long trade on a blue dot and a short trade on a red dot.
    • Exit Strategy: Use a combination of take-profit and stop-loss levels to manage the trade.
  2. GBP/JPY on H1:

    • Initial Setup: Apply Balanced Work on a 1-hour chart.
    • Trend Confirmation: Ensure the trend is validated by the appearance of consecutive dots in the same color.
    • Position Management: Adjust positions based on trend strength and market volatility.

Advanced Trading Techniques

  • Combining with Volume Indicators: Use volume indicators to confirm the strength of signals provided by Balanced Work, enhancing the accuracy of your trades.
  • Backtesting and Optimization: Regularly backtest the indicator on historical data to fine-tune settings and improve performance.
  • Risk Management: Implement strict risk management rules to protect your capital and maximize returns.

Final Thoughts

Balanced Work is not just an indicator but a comprehensive tool for understanding and navigating market trends. Its simplicity, combined with powerful analytical capabilities, makes it an essential part of any trader's toolkit. Embrace Balanced Work today and take your trading to new heights by leveraging its clear signals and robust performance.

4o


おすすめのプロダクト
Supply and Demand DE inspired EA Professional Supply & Demand Zone Trading System with Multi-Timeframe Confirmation Overview This advanced Expert Advisor automatically identifies and trades high-probability Supply and Demand zones using institutional trading principles. The EA combines classical supply/demand zone detection with modern confirmation filters including Break of Structure (BoS), Fair Value Gaps (FVG), and higher timeframe validation. 5m chart Setfile link: https://drive.google.com/
FREE
Professional Averaging Calculator - Essential Risk Management Tool for Every Trader Whether you're a beginner learning position averaging or a professional managing complex grid strategies, this calculator is your must-have tool. Beginners instantly see how averaging works, understand maximum loss scenarios, and learn proper risk management before entering trades - no more "I didn't know I could lose that much" surprises. Professionals save time and eliminate calculation errors with instant simu
新しいトレーディングツール:トレードを最適化しよう! 私は、悩まずに簡単に取引できるように開発した全く新しいツールを紹介できることを嬉しく思います!従来の指標とは異なり、このツールは単に価格の変動を追跡するのではなく、通貨間の相関関係を深く分析し、市場に入る戦略的なタイミングを見つける手助けをします。 使い方は以下の通りです: ゼロ = 取引なし:指標がゼロの間は、市場の条件が適していないことを意味し、市場に参加しません。 4の数字でアラートが発動:通貨の1つが4に達すると、ツールがアラートを送信し、4つの通貨ペアで取引をするのに適した条件が整ったことを知らせます。 相関関係の分析:従来の指標とは異なり、このツールは通貨間の相関に基づいています。例えば、ある通貨がドルと相関している場合は1、2つの通貨が相関していれば2となります。4に達すると、それは複数の通貨がドルに対して弱いことを意味し、ツールは4つの通貨ペアをアラートとして送信します。 各通貨ペアを手動で探す手間を省く、時間を大幅に節約できるツールです!このツールは最適な取引機会を自動的にお知らせします。 今こそ
The Urgently indicator is designed to quickly determine the situation in the market, reflect the state of the market and signal profitable levels for opening trades. Market conditions change quickly enough, requiring constant calibration of trading strategies. Recommended for use in conjunction with any of the oscillators. The Urgently forex market trend indicator shows the trend direction and entry points. It smooths out price fluctuations when generating a signal by averaging the data and the
Manyal trading system, CovEchoTrend Robot, focuses on reliability and flexibility. By employing statistical analysis methods to study the relationships between the base indicator and market patterns, the system enables a deeper understanding of market processes. Intelligent pattern analysis: The application of statistical data processing helps identify key trend reversal points more accurately, signaling significant market shifts. Informed decision-making is based on the intersection of indicato
**SPECIAL LAUNCH PRICING:** **REGULAR PRICE:** ~~$200~~ **PROMO LAUNCH PRICE:** **$100** **YOU SAVE:** $100 (50% OFF) **PRICE INCREASE WILL INCREASE EVERY 10 SALE :** *$100 increases with every sale!* --- Smart Boxes Indicator: Multi‑Session Breakout, Wick Rejection & Smart Signal System Smart Boxes  is a professional‑grade market structure indicator engineered for traders who rely on precision, session timing, and clean intraday levels. It automatically maps the Opening Range, Yeste
FiveStarFX Gold Reversal Edge Professional automated trading solution designed for structured execution and controlled risk management in the Gold market. Built for traders who value discipline, precision, and consistency. Key Features Fully automated trading One trade at a time (controlled exposure) Fixed Stop Loss and Take Profit Smart Break-Even protection Profit lock with buffer Step-based trailing management Spread protection system Works on any broker Trade Management The E
FREE
Universal Soul Reaper is an atmospheric market-flow oscillator designed to interpret price behavior as a cycle of spiritual energy. Instead of reacting to raw price alone, it visualizes the state of the market’s soul —revealing when momentum is awakening, stabilizing, or fading. The indicator operates in a separate window and presents three interwoven entities: the Ectoplasmic Veil , the Spirit Boundary , and the Soul Core . Together, they form a living framework that helps traders sense pressu
RBreaker Gold Indicatorsは、金先物の短期日内取引戦略であり、トレンドフォローと日内反転の2つの取引手法を組み合わせたものです。トレンド相場での利益を捉えるだけでなく、相場が反転した際には迅速に利確し、その流れに沿ってポジションを反転させることができます。 この戦略は、アメリカの雑誌『Futures Truth』において、15年連続で最も収益性の高い取引戦略トップ10に選ばれた実績を持ち、非常に長いライフサイクルを誇り、現在も国内外で広く使用・研究されています。 本インディケーターは、2026年の金先物の値動きに対応し、14日間のATR指標に基づいて、ブレイクアウト係数A、観察係数B、リバーサル係数Rをより合理的な値で定義しています。非常に優れたインディケーターであり、安定的な年間収益を実現しています。ぜひおすすめします〜
QuantumPlus Cent Automator EA  is a high-precision Expert Advisor designed for Cent account trading and traders who prioritize stability and capital preservation. By combining RSI momentum filtering with a smart Grid logic, this EA captures market reversals while strictly avoiding the "Black Swan" risks associated with weekend gaps. ## Why QuantumPlus Cent Automator EA? * The Weekend Protector: Automatically closes all positions every Friday at your preferred hour to ensure your capital is ne
Description of   Simo : an innovative robot with a unique trading system Simo is a revolutionary trading robot that changes the rules of the game with its unique trading system. Using sentiment analysis and machine learning, Simo takes trading to a new level. This robot can work on any time frame, with any currency pair, and on the server of any broker. Simo uses its own algorithm to make trading decisions. Various approaches to analyzing input data allow the robot to make more informed decis
Noize Absorption Index - is the manual trading system that measures the difference of pressure between bears forces and bulls forces. Green line - is a noize free index that showing curent situation. Zero value of index shows totally choppy/flat market.Values above zero level shows how powerfull bullish wave is and values below zero measures bearish forces.Up arrow appears on bearish market when it's ready to reverse, dn arrow appears on weak bullish market, as a result of reverse expectation.
" Silicon Ex ": Your Reliable Assistant in the World of Forex Silicon Ex is a modern trading bot, specially created for traders in the Forex market. This innovative tool serves as a reliable partner for those who strive for efficient and automated trading. Key Features of "Silicon Ex": Reliability and Stability: Created using advanced technologies that ensure stable and reliable operation in the market. Intelligent Risk Management: Built-in money management system (Money Management) allows you
Larry Connors TPS – PercentB - (Bollinger Band %) A professional implementation of Larry Connors' Percent B strategy, designed to systematically capture high-probability short-term reversals in equity markets. This system uses the Bollinger Band %b indicator to identify when price has moved to a statistical extreme relative to its recent volatility envelope. When %b drops near zero, price is at or below the lower Bollinger Band — a quantified oversold condition that this EA captures with discipl
バックテストではなく、実際の取引システムを購入してください    Live Signal   この価格はプロモーション期間中の一時的なものであり、間もなく値上げされます バックテストは実際のティックのみで実行する必要があります。そうでないと、不正確な結果になります。 公開チャットグループに参加するには、 こちらをクリックしてください。 US30 ダウ ジョーンズ EA へようこそ US30 ダウ ジョーンズ EA: ダイナミック ダウ ジョーンズをマスターする US30 はダウ ジョーンズとしても知られ、市場で最も人気のある指数の 1 つです。専門アドバイザーが多数存在するにもかかわらず、グリッド、マーチンゲール、リカバリーなどのリスクを伴う戦略に頼らずに長期的に成功する人はほとんどいません。これらの戦略はリスク対報酬の結果が劣悪になることがよくあります。複雑な市場力学と高いボラティリティのため、特にニューヨーク取引中は、ダウ・ジョーンズの舵取りが難しい場合があります。マーケットメーカーはストップロスを狙うことが多く、流動性が十分になった時点でサポートとレジスタンスのレベルを利
Just Keep CALM and Trade SMART This EA is only for serious traders, who wants really robust strategy for longterm and sustainable profits.  Strategy uses MACD direction change for finding trading opportunities. It is fully automatic and doesn't require any action from you. Just attach it to the EURUSD H1 chart and let this EA works for you. This EA has passed   9 robustness tests , indicating a quality strategy. Benefits for you Plug & Play system  - just attach to the chart, configure your ri
DAILY OH/OL SDEV QUANT MODEL - STATISTICAL TRADING WITH PRECISION RISK MANAGEMENT TRADE WITH MATHEMATICAL CERTAINTY - KNOW YOUR EXACT STOP-LOSS AND TAKE-PROFIT BEFORE YOU ENTER This indicator analyzes 5,000+ days of price history to give you: Exact entry levels (sigma bands locked at daily open) Exact stop-loss distance (from M
AlphaTrader: Your Intelligent Partner in Forex Trading AlphaTrader   is an advanced trading system that utilizes automated analysis and trading strategies to optimize decision-making in the Forex market. Built using geometric patterns and cutting-edge algorithms, this bot detects pricing patterns, providing precise signals for successful trades.   Why Choose AlphaTrader? AlphaTrader is not just a trading bot; it’s a   full-fledged partner   designed to help you manage your capital as efficien
https://youtu.be/JJanqcNzLGM ,  https://youtu.be/l70MIHaQQa4 ,  https://youtu.be/pg0oiT5_8y0   Automated Supply and Demand Trading Edge MT5. These videos demonstrate how we apply the supply and demand system to our latest trading review and market analysis Enhance your Trading Strategy with the Supply and Demand Trading Edge MT5. Gain a competitive market advantage with the Supply and Demand Trading Edge MT5 indicator, a powerful tool that combines MACD signals with supply and demand zones. By
The implementation of the Trend Turn trend indicator is simple - in the form of lines of two colors. The indicator algorithm is based on standard indicators as well as its own mathematical calculations. The indicator will help users determine the direction of the trend. It will also become an indispensable advisor for entering the market or closing a position. This indicator is recommended for everyone, both beginners and professionals. How to interpret information from the indicator. We sell
Gecko EA MT5
Profalgo Limited
5 (1)
NEW PROMO: Only a few copies copies available at 349$ Next price: 449$ Make sure to check out our " Ultimate EA combo package " in our   promo blog ! Gecko runs a simple, yet very effective, proven strategy.  It looks for important recent support and resistance levels and will trade the breakouts.  This is a "real" trading system, which means it will use a SL to protect the account.  It also means it will not use any dangerous techniques like martingale, grid or averaging down. The EA shows its
Bollinger Trend Lines – MT4 & MT5 Bollinger Trend Lines is a professional volatility-based trend indicator designed to clearly identify trend direction and dynamic stop levels using Bollinger Bands. Fuses on one core principle: follow the trend, ignore noise, and let volatility define the stop. How it works The indicator builds trailing trend lines using Bollinger Bands: In an uptrend , the lower band trails price and can only rise In a downtrend , the upper band trails price and can only
Axiom Point — Precision Structural Breakout Indicator Axiom Point is a high-performance analytical indicator designed to identify high-probability reversal zones using price-action behaviour and adaptive balance filtering. The indicator applies a multi-layer analytical model to detect moments when price transitions beyond its normal equilibrium area, indicating a potential shift in market momentum. Unlike conventional trend-following tools, Axiom Point focuses on so-called points of no return —
AurumPulse Pro Gold
Mohamad Syamir Bin Senin
AurumPulse Pro – Smart Intraday Gold Trading EA AurumPulse Pro is a professional XAUUSD intraday trading robot designed for real-tick market conditions, combining momentum logic, dynamic trade management, and session-based execution to capture high-probability gold movements on lower timeframes. About AurumPulse Pro AurumPulse Pro is a fully automated Expert Advisor for MetaTrader 5 , specifically optimized for Gold (XAUUSD) trading under real tick conditions . This EA is designed for traders
The  SuperTrend Advance Trading  is a widely-used technical indicator based on  SuperTrend Strategy + Price Action + EMA . How it works: -  Buy/Sell Signals  can be generated when the trend reverses, the conditions of Price action, TrendLine and EMA are met. - After the  Signal  appears, be patient and wait until the candle closes, at that time place the order as soon as possible. You may have time to review your entry, consider whether it is a good entry or not. - Carefully review the entry, up
Description of Scalping MT5 EA Scalping MT5 EA is a powerful, simple, and user-friendly trading tool designed for traders seeking an effective scalping strategy. This fully automated EA saves you time and maximizes profit opportunities from short-term price movements. Key Features Fully Automated : Scalping MT5 EA handles every stage of trading, from market analysis to order placement and risk management. Easy Setup : With simple input parameters, you can customize the EA to suit your trading st
##   ONLY GOLD ##   Тiльки Золото ## **Mercaria Professional Trading Zones - Complete Guide** ## **Mercaria Professional Trading Zones - Повний посібник** ### **How Mercaria Zones Work / Як працюють зони Mercaria** **English:** Mercaria Zones is an advanced trading indicator that identifies high-probability support and resistance areas using ZigZag extremes combined with mathematical zone calculations. The indicator works on multiple timeframes simultaneously, providing a comprehensive view
With this easy to set up indicator you can display and set alerts for the following candlestick formations: Bull Breakout, Bear Breakout, Hammer, Pin, Bullish Engulfing, Bearish Engulfing. Input parameters: ShortArrowColor: The color of the Arrows, displaying a Bearish candle formation LongArrowColor: The color of the Arrows displaying a Bullish candle formation BullishEngulfing: Disabled/Enabled/EnabledwithAlert BearishEngulfing: Disabled/Enabled/EnabledwithAlert Pin:  Disabled/Enabled/Enabledw
FREE
Jacket is an arrow indicator for forex, futures and binary options without redrawing. Tracks the market trend, ignoring sharp market fluctuations and noise around the average price. Works only at open prices. Therefore, it is reliable and without redrawing. This indicator uses its algorithms to analyze previous periods and predict further market behavior. It is based on the calculation of levels with a certain period, which allows you to more accurately assess the situation. Often, signals that
The MA Crossover EA is an automated trading system for MT5 that executes trades based on moving average crossovers. It is designed to capture medium-term trend shifts on the M12 timeframe with clear entry signals and strict risk management. One important aspect to consider: it was trained and tested on NASDAQ.  Key Features Moving Average Crossover Strategy – Uses a fast and a slow moving average to generate buy and sell signals when crossovers occur, confirming trend direction changes. Customiz
このプロダクトを購入した人は以下も購入しています
ARIPoint is a powerful trading companion designed to generate high-probability entry signals with dynamic TP/SL/DP levels based on volatility. Built-in performance tracking shows win/loss stats, PP1/PP2 hits, and success rates all updated live. Key Features: Buy/Sell signals with adaptive volatility bands Real-time TP/SL/DP levels based on ATR Built-in MA Filter with optional ATR/StdDev volatility Performance stats panel (Success, Profit/Loss, PP1/PP2) Alerts via popup, sound, push, or email Cu
このインジケーターを購入された方には、以下の特典を 無料 で提供しています: 各トレードを自動で管理し、ストップロスとテイクプロフィットを設定し、戦略ルールに基づいてポジションを決済する補助ツール 「Bomber Utility」 様々な銘柄に合わせたインジケーターの設定ファイル(セットファイル) 「最小リスク」、「バランスリスク」、「待機戦略」 の3つのモードで使用できる Bomber Utility 用の設定ファイル このトレーディング戦略をすぐに導入・設定・開始できる ステップバイステップのビデオマニュアル ご注意: 上記の特典を受け取るには、MQL5のプライベートメッセージシステムを通じて販売者にご連絡ください。 オリジナルのカスタムインジケーター 「Divergence Bomber(ダイバージェンス・ボンバー)」 をご紹介します。これは、MACDのダイバージェンス(乖離)戦略に基づいた 「オールインワン」型のトレーディングシステム です。 このテクニカルインジケーターの主な目的は、価格とMACDインジケーターの間に発生するダイバージェンスを検出 し、将来の価格の動きを示す
優れたテクニカルインジケーター「Grabber」をご紹介します。これは、すぐに使える「オールインワン」トレーディング戦略として機能します。 ひとつのコードに、市場のテクニカル分析ツール、取引シグナル(矢印)、アラート機能、プッシュ通知が強力に統合されています。 このインジケーターを購入された方には、以下の特典を無料で提供します: Grabberユーティリティ:オープンポジションを自動で管理するツール ステップバイステップのビデオマニュアル:インジケーターのインストール、設定、取引方法を解説 カスタムセットファイル:インジケーターをすばやく自動設定し、最大限の成果を出すための設定ファイル 他の戦略はもう忘れてください!Grabberだけが、あなたを新たなトレードの高みへと導いてくれるのです。 Grabber戦略の主な特徴: 推奨タイムフレーム:M5〜H4 対応通貨ペア・資産:どれでも使用可能ですが、私が実際に検証した以下を推奨します(GBPUSD、GBPCAD、GBPCHF、AUDCAD、AUDUSD、AUDSGD、AUDCHF、NZDUSD、NZDCAD、EURCAD、EURUSD、E
Quantum TrendPulse を ご紹介します。これは、   SuperTrend   、   RSI   、および Stochastic のパワーを 1 つの包括的なインジケーターに組み合わせて、取引の可能性を最大限に引き出す究極の取引ツールです。精度と効率を求めるトレーダー向けに設計されたこのインジケーターは、市場のトレンド、勢いの変化、最適なエントリー ポイントとエグジット ポイントを自信を持って特定するのに役立ちます。 主な特徴: SuperTrend 統合: 現在の市場動向に簡単に追従し、収益性の波に乗ることができます。 RSI精度: 買われすぎと売られすぎのレベルを検出し、市場の反転のタイミングに最適で、SuperTrendのフィルターとして使用されます。 確率的精度: 確率的振動を活用して、変動の激しい市場で隠れたチャンスを見つけます。SuperTrend のフィルターとして使用されます。 マルチタイムフレーム分析:   M5 から H1 または H4 まで、さまざまなタイムフレームで市場を常に把握します。 カスタマイズ可能なアラート: カスタム取引条件が満たされ
Azimuth Pro
Ottaviano De Cicco
5 (7)
Azimuth Pro V2:MT5向けシンセティック・フラクタル構造分析と確認済みエントリー 概要 Azimuth Pro は Merkava Labs によるマルチレベルスイング構造インジケーターです。4つのネストされたスイングレイヤー、スイングアンカーVWAP、ABCパターン検出、3タイムフレーム構造フィルタリング、そして確定バーでの確認済みエントリー — 1つのチャートで、ミクロスイングからマクロサイクルまでを網羅するワークフロー。 これはブラインドシグナル製品ではありません。ロケーション、コンテキスト、タイミングを重視するトレーダーのための構造ファーストワークフローです。 V2発売記念オファー — Azimuth Pro V2をUSD 399で(次の100本)。最終価格:USD 499。 1. V2での変更点 シンセティック・マルチタイムフレームエンジン 上位タイムフレーム分析をMeridian Proと同じ独自のシンセティックアーキテクチャで一から再構築。よりクリーンなHTFコンテキスト、安定したライブ動作、従来のMTF同期問題なし。シンセティックエンジンは 固定比率タ
これはMT5のインジケーターで、再描画なしで取引に参入するための正確なシグナルを提供します。 外国為替、暗号通貨、金属、株式、インデックスなど、あらゆる金融資産に適用できます。かなり正確な見積もりを提供し、取引を開始して終了するのに最適な時期を教えてくれます。1つのシグナルを処理しただけでインジケーターの元が取れた例の 動画 (6:22)をご覧ください。Entry PointsPro インジケーターの助けを借りたほとんどのトレーダーの最初の1週間の結果が改善しています。 Telegramグループ に登録してください。Entry Points Proインジケーターのメリットは次の通りです。 再描画のないエントリーシグナル 再描画されるインジケーターでは一度表示されたシグナルが削除されて大きな金銭的損失につながることがありますが、これと異なり、表示されて確認されたシグナルは消えることがありません。 エラーなしの取引開始 インジケーターアルゴリズムによって取引を開始する(資産を売買する)理想的な瞬間を見つけることができます。それを使用するすべてのトレーダーの成功率が向上します。 あら
マーケットメーカーのためのツール。 Meravith は次の機能を提供します: すべての時間足を分析し、現在有効なトレンドを表示します。 強気と弱気の出来高が等しくなる流動性ゾーン(出来高均衡)を強調表示します。 異なる時間足のすべての流動性レベルをチャート上に直接表示します。 テキスト形式の市場分析を生成し、参考情報として表示します。 現在のトレンドに基づいて目標値、サポートレベル、ストップロスを計算します。 取引のリスクリワード比を算出します。 口座残高に基づいてポジションサイズを計算し、潜在的な利益を推定します。 また、市場に大きな変化があった場合には警告を表示します。 インジケーターの主要ライン: 強気/弱気の出来高エグゾーストライン ― 目標値として機能します。 市場のトレンドを示すライン。市場が強気か弱気かによって色が変わり、トレンドのサポートとして機能します。主にその色が市場センチメントを示します。 出来高均衡ライン(Eq)。Eq(Volume Equilibrium)ラインはシステムの中核です。これは買い手と売り手の出来高のバランスポイントを表します。市場の流動性を示し
SignalTech MT5 is a trading system for EURUSD, USDCHF, USDJPY, AUDUSD, NZDUSD, EURJPY, AUDJPY, NZDJPY, CADJPY H2 and H3 Timeframe.  It can generate signals with Buy/Sell Arrows and Pop-Up/Sound Alerts. Each signal has clear Entry and Stop Loss levels, which should be automatically flagged on the chart, as well as potential Targets 1, 2, and 3. The Entry and TP levels are fixed after the trade is taken. The exit level is dynamic. If there are signs of a potential short-term trend reversal, the
BTMM State Engine Pro is a MetaTrader 5 indicator for traders who use the Beat The Market Maker approach: Asian session context, kill zone timing, level progression, peak formation detection, and a multi-pair scanner from a single chart. It combines cycle state logic with a built-in scanner dashboard so you do not need the same tool on many charts at once. What it does Draws the Asian session range; session times can follow broker server offset or be set in inputs. Tracks level progression (L
Bill Williams Advanced is designed for automatic chart analysis using Bill Williams' "Profitunity" system. The indicator analyzes four timeframes at once. Manual (Be sure to read before purchasing) Advantages 1. Analyzes the chart using Bill Williams' "Profitunity" system. Signals are displayed in a table in the corner of the screen and on the price chart. 2. Finds all known AO and AC signals, as well as zone signals. Equipped with a trend filter based on the Alligator. 3. Finds "Divergence Bar
トレンド スクリーナー インジケーターでトレンド取引の力を解き放ちます。ファジー ロジックと複数通貨システムを活用した究極のトレンド取引ソリューションです。 ファジー ロジックを活用した革新的なトレンド インジケーターである Trend Screener を使用して、トレンド取引を向上させます。 これは、13 を超えるプレミアム ツールと機能、および 3 つの取引戦略を組み合わせた強力なトレンド追跡インジケーターであり、Metatrader をトレンド アナライザーにする多用途の選択肢となります。 期間限定オファー : トレンド スクリーナー インジケーターは、わずか 100 ドルで生涯ご利用いただけます。 (元の価格 50$ ) (オファー延長) Trend Screener の 100% 非再描画精度の揺るぎない精度を体験して、取引の決定が過去の価格変動の影響を受けないようにしてください。 マルチタイムフレームおよびマルチ通貨機能の多用途性を解放し、比類のない自信を持って外国為替、商品、暗号通貨、インデックスの世界を取引できるようにします。 Trend Screener の包括的な
ご紹介     Quantum Breakout PRO は 、ブレイクアウト ゾーンの取引方法を変革する画期的な MQL5 インジケーターです。 13年以上の取引経験を持つ経験豊富なトレーダーのチームによって開発されました。     クォンタム ブレイクアウト プロ   は、革新的でダイナミックなブレイクアウト ゾーン戦略により、あなたのトレーディングの旅を新たな高みに押し上げるように設計されています。 クォンタム ブレイクアウト インジケーターは、5 つの利益ターゲット ゾーンを備えたブレイクアウト ゾーン上のシグナル矢印と、ブレイクアウト ボックスに基づいたストップロスの提案を提供します。 初心者トレーダーにもプロのトレーダーにも適しています。 量子EAチャネル:       ここをクリック 重要!購入後、インストールマニュアルを受け取るためにプライベートメッセージを送ってください。 推奨事項: 時間枠: M15 通貨ペア: GBPJPY、EURJPY、USDJPY、NZDUSD、XAUUSD アカウントの種類: ECN、Raw、またはスプレッドが非常に低い R
OmniSync Projection
Antonio-alin Teculescu
5 (1)
Chronos Fractal Engine is an innovative price projection indicator for MetaTrader 5, designed to transform your technical analysis by intelligently identifying and projecting historical price patterns. Built upon an advanced correlation algorithm and the fractal principles of the market, this powerful tool visualizes potential future price movements, giving you a unique edge in your trading decisions. What is Chronos Fractal Engine? At its core, the Chronos Fractal Engine employs a sophisticat
Berma Bands
Muhammad Elbermawi
5 (8)
Berma Bands (BBs) インジケーターは、市場のトレンドを特定して活用したいトレーダーにとって貴重なツールです。価格と BBs の関係を分析することで、トレーダーは市場がトレンド段階にあるか、レンジ段階にあるかを判断できます。 詳細については、[ Berma Home Blog ] をご覧ください。 バーマ バンドは、上部バーマ バンド、中部バーマ バンド、下部バーマ バンドの 3 つの異なる線で構成されています。これらの線は価格の周りにプロットされ、全体的な傾向に対する価格の動きを視覚的に表します。これらのバンド間の距離から、ボラティリティや潜在的な傾向の反転についての洞察を得ることができます。 バーマ バンドの線がそれぞれ離れると、市場が横ばいまたはレンジ相場の期間に入っていることを示すことがよくあります。これは、明確な方向性の偏りがないことを示しています。トレーダーは、これらの期間中にトレンドを特定するのが難しいと感じる可能性があり、より明確なトレンドが出現するまで待つ場合があります。 バーマ バンドの線が 1 本の線に収束すると、強いトレンド環境の兆候となること
Gartley Hunter Multi - An indicator for searching for harmonic patterns simultaneously on dozens of trading instruments and on all possible timeframes. Manual (Be sure to read before purchasing) | Version for MT4 Advantages 1. Patterns: Gartley, Butterfly, Shark, Crab. Bat, Alternate Bat, Deep Crab, Cypher 2. Simultaneous search for patterns on dozens of trading instruments and on all possible timeframes 3. Search for patterns of all possible sizes. From the smallest to the largest 4. All fou
ARICoin is a powerful trading companion designed to generate high-probability entry signals with dynamic TP/SL/DP levels based on volatility. Built-in performance tracking shows win/loss stats, PP1/PP2 hits, and success rates all updated live. Key Features: Buy/Sell signals with adaptive volatility bands Real-time TP/SL/DP levels based on ATR Built-in MA Filter with optional ATR/StdDev volatility Performance stats panel (Success, Profit/Loss, PP1/PP2) Alerts via popup, sound, push, or email Cust
メタポイントプロ   これは、取引における推測を排除し、市場が既に決定を下したポイントを示すトレンドフォローツールです。この指標は、トレンド、動向、構造が変化する重要なポイントを特定し、主要プレーヤーがポジションを取るべき価格の戻り領域を強調表示します。 単に値動きを見るだけでなく、その背後にある論理を理解できます。すべてのシグナルはローソク足が確定した後に記録され、再描画されることなくチャート上に保存されるため、自信を持って状況を分析し、意思決定を行うことができます。トレード目標(利益確定)も表示されます。 この指標の有効性について完全に確信を持っていただくために、自動統計機能をご利用いただけます。 方向転換のたびに、インジケーターはストップロスレベルとそのインテリジェントな段階的移動(Move SL)も表示します。これは非常に重要です。     削減する   リスク   ポジション別。 損切り/利益確定/リスクリワード 右側に内蔵されたパネルには、現在の世界的なトレンドの方向における市場参入ポイントが表示され、過去のデータからもこれらのシグナルが確認できます。 任意の時間枠/ツール
「 Dynamic Scalper System MT5 」インジケーターは、トレンド波の中でスキャルピング取引を行う手法のために設計されています。 主要通貨ペアと金でテスト済みで、他の取引商品との互換性があります。 トレンドに沿った短期的なポジションオープンのシグナルを提供し、追加の価格変動サポートも提供します。 インジケーターの原理 大きな矢印はトレンドの方向を決定します。 トレンド波の中では、小さな矢印の形でスキャルピングシグナルを生成するアルゴリズムが機能します。 赤い矢印は強気方向、青い矢印は弱気方向です。 トレンドの方向には敏感な価格変動ラインが描かれ、小さな矢印のシグナルと連動します。 シグナルは次のように機能します。適切なタイミングでラインが現れるとエントリーシグナルが形成され、ラインが開いている間はポジションが保持され、完了すると取引が終了します。 推奨される動作時間枠はM1~H4です。 矢印は現在のローソク足に形成され、次のローソク足が開いている場合は、前のローソク足の矢印は再描画されません。 入力パラメータ Trend Wave Period - トレ
Gannスクエアインジケーターは、W.D. Gannによって執筆された「市場予測のための数学的な式」の記事に基づく強力な市場分析ツールです。このツールは、解析に数学的な概念を応用し、Gann理論に基づいています。それは、144、90、52のスクエアや9のスクエアなど、Gannの関連テクニックの要素を取り入れています。さらに、の方法を組み込んでおり、9のスクエアとその関連性についてのチャネルやスターパターンに焦点を当てています。 ユーザーマニュアルと使用方法: このインジケーターを使用する前に、ユーザーマニュアルを読んで疑問点を解決するためにお問い合わせいただくことをお勧めします。ユーザーマニュアルの完全版は、当社のウェブサイトで入手できます。 MT5の完全版は購入できますし、MT4の無料版も試すことができます。両方のバージョンへのリンクを提供していますので、ご利用ください。 主な機能と機能: Gannスクエアインジケーターは、市場分析のための完全なツールセットを提供し、幾何学的な概念とGann理論に基づいて的確な判断を行う手助けをします。以下に主な機能を示します。 9のスクエアの分析:
Cvd Divergence
Thalles Nascimento De Carvalho
CVD Divergence ― オーダーフローとダイバージェンスのプロフェッショナル分析 CVD Divergence は、価格と Cumulative Delta Volume(CVD)との間に発生する信頼性の高いダイバージェンスを検出するために開発されたテクニカル指標です。実際の注文フローが価格の動きを確認していない局面を正確に捉え、反転、勢いの減衰、そして機関投資家による操作の可能性を示します。 このインジケーターは、アグレッシブボリュームの読み取りと価格構造の分析を組み合わせ、明確で客観的かつ先行性のあるシグナルを提供します。 インジケーターの機能 CVD Divergence は、累積デルタボリュームを用いて注文フローの方向と価格の方向を比較します。両者が大きく乖離した際、チャート上にマーカーを表示し、ダイバージェンスの方向を視覚的に示します。 検出できる内容: 強気ダイバージェンス(価格が下落しているが CVD が上昇している場合) 弱気ダイバージェンス(価格が上昇しているが CVD が下降している場合) 買い手・売り手の勢いの枯渇 機関投資家の不均衡によるフェイクムーブ
Introducing Indicator for PainX and GainX Indices Traders on Weltrade Get ready to experience the power of trading with our indicator, specifically designed for Weltrade   broker's PainX and GainX Indices.  Advanced Strategies for Unbeatable Insights Our indicator employs sophisticated strategies to analyze market trends, pinpointing optimal entry and exit points.  Optimized for Maximum Performance To ensure optimal results, our indicator is carefully calibrated for 5-minute timeframe charts on
Presenting one-of-a-kind Gann Indicator for XAUUSD IQ Gold Gann Levels is a non-repainting, precision tool designed exclusively for XAUUSD/Gold intraday trading. It uses W.D. Gann’s square root method to plot real-time support and resistance levels, helping traders spot high-probability entries with confidence and clarity. William Delbert Gann (W.D. Gann) was an exceptional market analyst whose trading technique was based on a complex blend of mathematics, geometry, astrology, and ancient calcul
RelicusRoad Pro: 定量的市場オペレーティングシステム 【期間限定】無制限アクセス 70% OFF - 2,000人超のトレーダーと共に なぜ多くのトレーダーは「完璧な」インジケーターを使っても失敗するのでしょうか? それは、文脈を無視して 単一の概念 だけでトレードしているからです。文脈のないシグナルは単なるギャンブルです。勝ち続けるには、 根拠の重なり(コンフルエンス) が必要です。 RelicusRoad Proは単なる矢印インジケーターではありません。完全な 定量的市場エコシステム です。独自のボラティリティモデリングを用いて、価格が推移する「適正価値の道(Fair Value Road)」をマッピングし、ノイズと真の構造的ブレイクを判別します。 推測はやめましょう。機関投資家レベルの「ロード・ロジック」でトレードを。 コアエンジン:「Road」アルゴリズム システムの中心となる Road Algo は、市場環境にリアルタイムで適応するダイナミックなボラティリティチャネルです。 安全ライン(平衡点) と、価格が数学的に反転しやすい 拡張レベル を投影します。 Si
まず第一に、この取引ツールはノンリペイント、ノンリドロー、ノンラグの指標であり、プロの取引に理想的ですことを強調する価値があります。 オンラインコース、ユーザーマニュアル、デモ。 スマートプライスアクションコンセプトインジケーターは、新米から経験豊富なトレーダーまで、非常 に強力なツールです。Inner Circle Trader AnalysisやSmart Money Concepts Trading Strategiesなど、20以上の有用な指標を1つに組み合わせています。このインジケーターはスマートマネーコンセプトに焦点を当て、大手機関の取引方法を提供し、彼らの動きを予測するのに役立ちます。 特に、流動性分析に優れており、機関がどのように取引しているかを理解しやすくしています。市場のトレンドを予測し、価格の動きを慎重に分析するのに優れています。機関の戦略とトレードを合わせることで、市場の動向についてより正確な予測ができます。このインジケーターは多目的であり、市場構造を分析し、重要な注文ブロックを特定し、さまざまなパターンを認識するのに優れています。 このインジケーター
このインジケーターは、反転ポイントと価格戻りゾーンを正確に表示します。     主要プレーヤー 。新たなトレンドが形成される場所を把握し、最大限の精度で意思決定を行い、すべての取引をコントロールします。 TREND LINES PRO インジケーターと組み合わせることで、その潜在能力を最大限に発揮します。 VERSION MT4 インジケーターが示す内容: 新しいトレンドの始まりに活性化する反転構造と反転レベル。 リスクと報酬の比率を最小限に抑えた利益 確定 と 損失停止の レベルの表示     RR 1:2   。 インテリジェントな削減ロジックによるストップロス。 指定されたインジケーターから 2 つのトレンド タイプの反転パターンを表示します。 指標: トレンドを追う   TREND LINES PRO   (世界的なトレンドの変化) TREND PRO   (クイックトレンド変更) シンプルで効果的   スキャナー   リアルタイムトレンド(新機能)。 マルチタイムフレームのインストゥルメント フィルタリング。 画面   利益     LOGIC AI信号の後。 当日プラス方
CGE Trading Suite
Carl Gustav Johan Ekstrom
5 (2)
Institutional-Grade Analytics for MT5 C GE Trading Suite delivers the analytical edge typically reserved for professional trading desks. The platform integrates a full suite of analytical tools into one seamless workflow: dynamic grid mapping, liquidity behavior analysis, ECM, trend lines, MIDAS, trade cycles, and directional channel projections. Together, these provide a unified view of market structure and momentum. Directional clarity is further enhanced by the capital flow index, which meas
このインディケータは、価格アクション分析とドンチャンチャネルのみを使用して、ジグザグ方式で価格の反転を検出します。再描画やバックペインティングを一切行わずに、短期取引向けに特別に設計されています。それは彼らの操作のタイミングを増やすことを目指している賢明なトレーダーにとって素晴らしいツールです。 [ インストールガイド | 更新ガイド | トラブルシューティング | よくある質問 | すべての製品 ] 驚くほど簡単に取引できます すべての時間枠で価値を提供します 自己分析統計を実装します 電子メール/音声/視覚アラートを実装します 可変長のブレイクアウトと混雑ゾーンに基づいて、インディケータは価格アクションのみを使用して取引を選択し、市場が非常に高速に行っていることに反応します。 過去のシグナルの潜在的な利益が表示されます この指標は、独自の品質とパフォーマンスを分析します 負けブレイクアウトは強調表示され、説明されます インジケータは、非バックペインティングおよび非再ペイントです この指標は、日中のトレーダーが単一の価格反転を見逃さないようにするのに役立ちます。ただし、すべての
AriX
Temirlan Kdyrkhan
1 (4)
AriX Indicator for MT5 A powerful trend-following and signal-evaluation tool AriX is a custom MT5 indicator that combines Moving Averages and ATR-based risk/reward logic to generate clear buy/sell signals. It visualizes dynamic SL/TP levels, evaluates past trade outcomes, and displays win/loss statistics in a clean on-chart panel. Key features include: Buy/Sell signals based on MA crossovers ATR-based SL/TP1/TP2/TP3 levels with visual lines and labels Signal outcome tracking with real-time stat
プレミアムレベルは、正しい予測の精度が80%を超える独自の指標です。 この指標は、最高のトレーディングスペシャリストによって2か月以上テストされています。 あなたが他のどこにも見つけられない作者の指標! スクリーンショットから、このツールの正確さを自分で確認できます。 1は、1キャンドルの有効期限を持つバイナリーオプションの取引に最適です。 2はすべての通貨ペア、株式、商品、暗号通貨で機能します 手順: 赤い矢印が表示されたらすぐにダウントレードを開き、青い矢印が表示されたら閉じます。青い矢印の後に開くこともできます。 試してテストしてください!推奨設定はデフォルトです! 日足チャートで最高の精度を示します! インディケータは、2600 Pipsの収益性に対して、約10Pipsという非常に小さなマージンを使用します。
IVISTscalp5
Vadym Zhukovskyi
5 (6)
iVISTscalp5 — 時間ベースの市場予測システム iVISTscalp5は一般的なインジケーターではありません。 MetaTrader 5向けの時間ベースの予測システムであり、 市場がいつ動く可能性が高いかを特定します。 ⸻ 特徴  • 正確なタイミング  • BUY / SELL予測  • 平均利益の可能性  • 週間予測  • 120以上の金融商品 ⸻ コンセプト 市場は価格だけでなく時間によっても動く ⸻ iVISTscalp5 — 時間による優位性 iVISTscalp5インジケーターをご紹介します。このインジケーターは、トレーディングにおいて独自でありながら効果的です。時間データに基づくこのインジケーターは、多年にわたる経験と金融市場の深い分析の結果です。iVISTscalp5インジケーターは、手動トレーディングにとって優れたツールです。便利さ、簡単さ、可視化 - すべての複雑さが内部に隠されています。私たちは、iVISTscalp5インジケーターの設定と使用を最大限に簡素化しました。このインジケーターは、MT5ターミナルにあるすべての金融商品
作者のその他のプロダクト
Ось відформатований текст без альтернативних назв у дужках: Latency Edge Scalpel Latency Edge Scalpel is a high-frequency, institutional-grade trading solution engineered for high-precision scalping in the decentralized Forex market. This is not a simple grid or martingale bot; it is a sophisticated mathematical tool designed to exploit micro-structural price gaps and momentary volatility imbalances. The Algorithmic Core At its heart, Latency Edge Scalpel operates on a hybrid volatility-filterin
Pointer Trend Switch — precision trend reversal indicator Pointer Trend Switch is a high-precision arrow indicator designed to detect key moments of trend reversal based on asymmetric price behavior within a selected range of bars. It identifies localized price impulses by analyzing how far price deviates from the opening level, helping traders find accurate entry points before a trend visibly shifts. This indicator is ideal for scalping, intraday strategies, and swing trading, and performs equa
The Compare Graphs indicator is an analysis tool that allows traders to compare two or more graphs on the same chart window. This indicator is commonly used in trading platforms such as MetaTrader and provides a clearer comparison of different financial instruments or time frames. Functions of the Compare Graphs indicator may include: Selecting Charts: The trader can select the charts he wants to compare, such as price charts of different currency pairs or indicators on the same chart. Setting
The   Angle Prices   indicator is a tool that calculates the price angle based on price analysis, interpreting the time vector in the form of price points on the price chart. In other words, the X axis and Y axis are represented as price points, so you can actually calculate the angle with two axes of the same dimension. This allows traders to obtain information about the direction of price movement and possible entry or exit points for trades. Let's look at the main characteristics and interpr
The " Fortune Long " bot works using pending orders and reacts to a channel breakdown with the direction of work in the channel; it is necessary to correctly calculate the levels of entry, stop loss, take profit, and the level of deviation of the pending order from the price. The bot needs to be optimized for 2 years with a forward period of 1/2. Once optimization is complete, select the best settings and save them. Work for 6 months. The bot automatically calculates all levels and the entry le
In the world of trading, one of the main concerns is finding a reliable trading system. Meet the TrendEdge Channel indicator - your reliable companion in this search. Developed based on complex mathematical calculations, this indicator predicts the most likely short-term price movements. TrendEdge Channel is designed specifically to identify trends in price movements. Thanks to it, you can quickly determine not only the direction of the trend, but also the levels of interaction between buyers
With the growth of information technology and the increasing number of participants in financial markets, traditional analysis tools are becoming less effective. Conventional technical indicators, such as the moving average or stochastic, in their pure form are unable to accurately determine the direction of the trend or its reversal. Is it possible to find an indicator that remains effective for 14 years without changing its parameters, and at the same time adapts to market changes? Yes, such
Misio - can be used as an independent trading system. The indicator determines the market trend, ignoring sharp fluctuations and noise around the average price. It displays the trending movement with potential stop points. Simple, clear and effective use. The indicator does not redraw and does not lag. Suitable for all currency pairs and all timeframes. Interpretation: The location of the rate above or below the shadows indicates the presence of a trend. A move into the shadows signals a pos
Trend Divergence Indicator: Your Essential Tool for Market Analysis The Trend Divergence Indicator is a powerful tool designed to assist traders in identifying market trends and pinpointing entry points with precision. By leveraging price divergence, this indicator enhances your trading strategy, offering reliable insights and filtering unnecessary signals. Key Features and Benefits of the Trend Divergence Indicator Accurate Trend Analysis: The Trend Divergence Indicator uses price divergence t
The "BioStar" indicator is an innovative tool for trend analysis on the Forex market. It has unique capabilities and a wide range of settings that will help traders make informed decisions when trading. This indicator is based on the analysis of the market trend and helps to identify the direction of price movement. It uses various mathematical algorithms and statistical methods to determine the strength and stability of the trend in the market. One of the key features of the "BioStar" indica
Core Drift Index: Your Reliable Guide in the World of Trading Core Drift Index is an innovative trend indicator designed for precise detection of market directions and reversal points . This powerful tool enables traders to optimize their investments , minimize risk, and maximize profit. Key Features and Benefits Intuitive Trend Detection Core Drift Index clearly shows trend direction, helping traders make timely entry and exit decisions. High Probability of Success With its high accuracy
Warp Range Sensor: The Color of Your Trend Warp Range Sensor is a trend direction indicator that visually displays the current market condition by coloring bars red and blue based on trend direction. What Does Warp Range Sensor Do? Identifies the Current Trend Direction Blue bars indicate an uptrend Red bars signal a downtrend Universal Application Compatible with all currency pairs and timeframes , from short-term scalping to long-term trading. Powered by Market Context & Historical Data W
Pointer Trend Switch — precision trend reversal indicator Pointer Trend Switch is a high-precision arrow indicator designed to detect key moments of trend reversal based on asymmetric price behavior within a selected range of bars. It identifies localized price impulses by analyzing how far price deviates from the opening level, helping traders find accurate entry points before a trend visibly shifts. This indicator is ideal for scalping, intraday strategies, and swing trading, and performs equa
TrendCore Adaptive FX — Smart Expert Advisor for Confident and Adaptive Forex Trading TrendCore Adaptive FX   is a powerful, fully automated trading robot designed for consistent performance in the Forex market. It combines trend-based technical analysis, adaptive lot management, and solid capital protection strategies to ensure robust and efficient trading under real market conditions. Whether you're a professional trader or a long-term investor, this EA offers an intelligent solution to a
FlexiTrade Bot: Trade Smart, Not Blind Ditch the guesswork.   FlexiTrade Bot   is more than just a trading tool — it’s an intelligent trading engine built for traders who value   speed, precision, and adaptability . With real-time market analysis and pattern recognition, FlexiTrade delivers actionable signals with razor-sharp accuracy so you can focus on results, not reaction.   What Sets FlexiTrade Apart? Market Structure Awareness Unlike bots that rely on rigid indicator rules,   FlexiTr
AlphaTrader: Your Intelligent Partner in Forex Trading AlphaTrader   is an advanced trading system that utilizes automated analysis and trading strategies to optimize decision-making in the Forex market. Built using geometric patterns and cutting-edge algorithms, this bot detects pricing patterns, providing precise signals for successful trades.   Why Choose AlphaTrader? AlphaTrader is not just a trading bot; it’s a   full-fledged partner   designed to help you manage your capital as efficien
Acceleration Bias — Price Acceleration Impulse Indicator Acceleration Bias   is a modern analytical tool designed to measure changes in price acceleration and visualize impulse asymmetry using a robust mathematical model. This indicator is intended for traders working with market volatility, impulse phases, and price-movement structure, as well as those who need algorithmic, rule-based analytical support. Purpose and Core Concept Unlike traditional oscillators that analyze only velocity changes
Structural Equilibrium: A New Era of Adaptive Market Analysis As information technology advances and market participation grows, traditional analytical tools often face declining efficiency. Standard technical indicators frequently struggle to interpret the complexities of modern, algorithm-driven market structures. Structural Equilibrium was developed as a high-performance solution featuring a multi-level adaptive smoothing mechanism. This core logic allows the tool to maintain its analytical r
Phase Analytics Pro: Advanced Cyclic Market Analyzer Phase Analytics Pro is a sophisticated technical tool designed for traders who prioritize mathematical precision over lag-heavy traditional indicators. Based on the principles of digital signal processing, this indicator decomposes price action into phase and quadrature components to identify the dominant market cycle. How it works: The algorithm calculates the instantaneous phase of the market, allowing it to distinguish between trending and
Sub Algo is a revolutionary indicator for MQL4/MQL5 that transforms how algorithmic strategies are built and executed. Instead of writing endless if–else conditions, Sub Algo provides a complete visual configuration system with: 6 independent logical operations Adaptive thresholding Automatic Buy/Sell symmetry Simple dropdown menus and input parameters This is not a library . This is a ready-to-use professional indicator that converts any combination of technical indicators into precise logical
Orynth P&F Chart Overlay – Clean Trend Visualizer Orynth is a professional technical analysis tool that brings the power of Point and Figure (P&F) charting directly onto your standard candlestick chart. It filters out market noise by focusing solely on meaningful price movement, allowing traders to identify clear trends and reversals without the distraction of minor fluctuations. Unlike traditional P&F charts that open in a separate window, Orynth overlays price "boxes" directly on your main cha
The Plasma Trend indicator is a simple technical indication that is used to determine the current trend direction in the market. The Plasma Trend indicator is a powerful tool for determining the direction of the trend in the Forex market. It is based on both standard technical indicators and proprietary mathematical calculations, which provides a more accurate and reliable trend determination. Its implementation in the form of lines of two colors simplifies the visual determination of a change
Cryo
Sabina Fik
5 (1)
Cryo is based on the process of identifying the rate of change in price growth and allows you to find entry and exit points from the market. A fundamental technical indicator that allows you to assess the current market situation in order to enter the market of the selected currency pair in a trend and with minimal risk. The Cryo indicator was created on the basis of the original indicators for searching for extremes, the indicator is well suited for determining a reversal or a large sharp jer
The Angle Prices indicator is a tool that calculates the price angle based on price analysis, interpreting the time vector in the form of price points on the price chart. In other words, the X axis and Y axis are represented as price points, so you can actually calculate the angle with two axes of the same dimension. This allows traders to obtain information about the direction of price movement and possible entry or exit points for trades. Let's look at the main characteristics and interpretat
The " Fortune Long " bot works using pending orders and reacts to a channel breakdown with the direction of work in the channel; it is necessary to correctly calculate the levels of entry, stop loss, take profit, and the level of deviation of the pending order from the price. The bot needs to be optimized for 2 years with a forward period of 1/2. Once optimization is complete, select the best settings and save them. Work for 6 months. The bot automatically calculates all levels and the entry le
PricePulse Pro - Indicator of Simple Solutions! Using this indicator is very easy - just follow the colored arrows on the chart. The indicator algorithm takes into account daily price fluctuations and focuses on measuring the "candlestick" share in the trend. This indicator uses an algorithm that considers price changes based on various parameters such as H/C (high price/close), H/O (high price/open), LC (low price/close), LO (low price/open). This allows for a more detailed analysis of price
The "Trend Orbital" indicator is a tool for tracking trends in the financial asset market. It is based on the analysis of price data and provides a visual interpretation of the current direction of price movement. Options: InpAmplitude: Amplitude - determines the amount of volatility that the indicator takes into account when determining the trend. Group "Arrow": InpCodeUpArrow: Up Arrow Code - Defines the arrow symbol to display an uptrend. InpCodeDnArrow: Down Arrow Code - Defines the arrow
The Market Might indicator, despite its apparent simplicity, is based on complex analytical algorithms that allow you to accurately determine the moments of entry and exit from transactions. The signals generated by this indicator are accurate and timely, appearing directly on the current candle. The main task of the Market Might indicator is to determine the moments of entry and exit from trades. Therefore, it displays only the trend line and entry points, which provides a clear view of the m
This technical analysis indicator allows you to determine with high probability whether a trend or a flat pattern prevails in the market. It can be used both for trading within a channel and for breakout trading, provided that stop losses are used to protect against false signals. The indicator displays the channel in the form of lines located above and below the price, like other similar indicators. The upper and lower lines can also act as resistance and support levels. It quite accurately
Determining the current market trend is a key task for successful trading. It is for this purpose that the Book Scheme indicator was developed, which is an advanced algorithm for visually displaying a trend on a chart. Many traders dreamed of having reliable moving averages that kept up with the market. It was this dream that I turned into reality with the help of my indicator. Book Scheme allows you to predict future values ​​and create accurate signals for entering and exiting the market. T
フィルタ:
レビューなし
レビューに返信