 MetaTrader 5
 エキスパート
 インディケータ
 ライブラリ
 ユーティリティ
 ウィジェット
 ルール
YouTubeにあるマーケットチュートリアルビデオをご覧ください
ロボットや指標を購入する
仮想ホスティングで
EAを実行
EAを実行
ロボットや指標を購入前にテストする
マーケットで収入を得る
販売のためにプロダクトをプレゼンテーションする方法
MetaTrader 5のための新しいエキスパートアドバイザーとインディケータ - 534
 自動売買ロボットとインジケータを使用して、外国為替取引の収益性を高めます。 自動売買ロボットを使用すると、取引の開始と終了を自動化でき、インジケータは市場の行動をより正確に予測するのに役立ちます。
このページには、MetaTrader5アプリケーションのカタログが掲載されています。
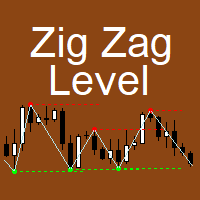
The indicator implements the author's approach to the construction of the popular "Zig-Zag" indicator.
The advantages of the "ZIgZag Level" indicator is that it filters out market noise and shows levels.
"ZIg Zag Level" is based on peaks and troughs, displays levels.
These levels can be disabled and configured.
The indicator displays the price of the level, the price tag can be disabled.
The "zigzag" line between the points can also be disabled.
The indicator has a built-in notification s
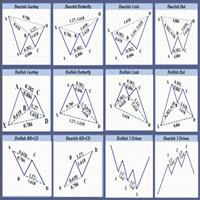
Only 5 copies of the EA at $30! Next price --> $45 Find charts and signals based on harmonic patterns, which work great in 1-hour timeframes and up.
Buy and sell signs based on different harmonic patterns as follows:
0: ABC_D
1: ABCD_E
2: 3Drive
3: 5_0
4: Gartley
5: Bat
6: Crab
7: Butterfly
8: Cypher
9: NenStar
10: Shark
11: AntiBat
12: AntiGartley
13: AntiCrab
14: AntiButterfly
15: AntiCypher
16: AntiNenStar
17: AntiShark
How to use:
When there is an opportunity to buy or sell, you have 5:
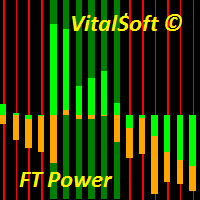
The FT Power indicator system is designed to determine the trend direction of the price chart. Consists of two histograms. The central histogram Bull/Bear Power determines the predominance of bullish or bearish power. When the indicator value is above zero, Bull/Bear Power shows that the bulls are strong, and when the histogram goes below 0, the bulls are exhausted and further growth becomes doubtful. The main histogram is used to determine the trend or flat sections of the chart and confirm the
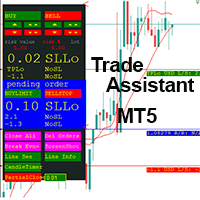
This EA is a trade management tool for Mt5 and Mt4. Mt4 version will find the Mt4 section here: https://www.mql5.com/en/market/product/80214?source=Site +Market+MT4+Utility+New+Rating006. It was to make a way for the trader to make the initial decision of when and which direction to enter. The trader decides in advance whether he wants the robot to take or stop an order. He also decides what new lot size, percent size or money size to use on each trade. On a live chart you can place
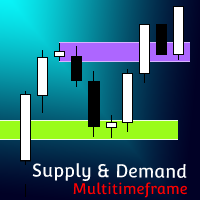
[ MT4 Version ] Supply and Demand Multitimeframe Supply and Demand Multitimeframe is the first indicator in the market that combines multiple aspects like trading volume, price structure and momentum to identify Supply and Demand zones for every asset. The Supply and Demand indicator analyzes simultaneously up to 4 different TFs and represents their information in the current graph. Its interactive UI highlights everytime the price enters a Supply or Demand zone even if the zones are not visible

I am a trader not a seller so unlike most of them, I don't use any tricks to hack the backtest look like holy grail!
EXTREME risk SIGNAL still alive
On May 1, 2022, I will raise the product price!
British Nuclear is a fully automated trend-following trading system based on principles of volatility breakout and coming back cross resistance/support levels. It is the advanced swing system that utilizes smart entry/exit algorithms focused on long-term stable growth. It is a professional tool de
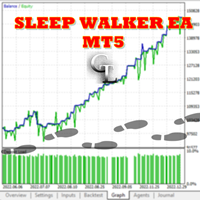
NEXT PRICE : $649
Sleep Walker EA is a multi-currency expert advisor based on a strong scalping strategy in the night when the market volume is low combined with a strong trade management and execution system . Trading Strategy
Sleep Walker EA trades on 5 currency pairs GBPUSD, EURUSD, AUDUSD, NZDUSD & USDCHF using instant order execution. It starts taking trades on specific times with proper Stop Loss and Hidden Profit Booking mechanism when the scalping strategy probability is the highest,
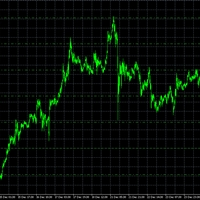
SaTo EA simple for free. 1. Double MA indicator for Entry signal 2. RSI for trend filter (Uptrend: RSI value greater than RSI level, Downtrend: RSI value less than RSI level ) 3. MACD for trend filter (Uptrend: MACD greater than signal , Downtrend: MACD less signal ) Buy signal : Fast MA greater than Slow MA, RSI value greater than RSI level, MACD greater than signal Sell signal : Fast MA less than Slow MA, RSI value less than RSI level, MACD less signal
FREE

Future of Ea:
We make this Ea on scalping strategy for short term trend. Ea is able to works on any Currency pair and any time chart frames but profits and risk are depends on time chart.We provide you full support to setup ea on his best time chart according to currency pair. Contact us by sending massage in mql5 chat for Ea setups. We also stored our set files in comment area for easy use for you.This Ea's Mt4 version is also available in Mt4 expert area. Using of Ea: Indicator settings is ou
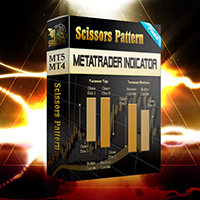
Configure scaffolding charts and signals based on the scissor pattern, which works great at low times.
Buy and sell signs based on 2 previous candle patterns
It works on the active time form, and when detecting the pattern in 4 time frames, 5 minutes, 15 minutes, 30 minutes and one hour, the alert can be set to notify us of the formation of this pattern.
MetaTrader version 4 click here
How to use:
When there is an opportunity to buy or sell, the marker places a scissors mark on the candle

• Please test the product in the Strategy Tester before purchasing to understand how it works.
• If you face any issues, contact me via private message—I’m always available to help.
• After purchase, send me a screenshot of your order to receive a FREE EA as a gift.
Time frame: M1
Leverage : Higher the better
Spread: Lower the better
Account type : All types
(EA may enter hedge positions, if you want to

• Please test the product in the Strategy Tester before purchasing to understand how it works.
• If you face any issues, contact me via private message—I’m always available to help.
• After purchase, send me a screenshot of your order to receive a FREE EA as a gift.
Time frame: M1
Leverage : Higher the better
Spread: Lower the better
Account type : All types
(EA may enter hedge positions, if you want to
Good Wheel Pro uses the idea of combining trend and shock to intervene in the market when the trend starts , and it can close the order if it detects that the trend is most likely to reverse. Which is applicable to multiple currency pairs. When using, only one currency pair needs to be loaded. It's running on M1 chart, EA will automatically detect three currency pairs, including EURUSD, GBPUSD and USDCAD. Recommended timeframe: M1 Features: > One Chart Setup: you need only one chart to trade al

WHAT CHANGED FOR YOU: SPREAD CAP 0 NOW MEANS NO CAP, CLOSES WAIT FOR AN OPEN SESSION, AND THE GRID MOVES ONLY AFTER A CONFIRMED FILL. Speedy EA is a fast-reacting two-sided Stochastic grid that waits for a deep extreme, ladders 150 pips apart and closes each side as one small basket. Try it free first in the Strategy Tester with visual mode on. Reproduce it in two minutes: Strategy Tester, 2025.01.01 to 2026.09.30, 10,000 USD, 1 minute OHLC, default inputs. EURUSD H1: +14.58 USD, 16 trades, all

Offer 249 down from 350 for the next 1 copies. then back to 350 $
Are you tired of using outdated indicators that leave you guessing where to set your profit targets? Look no further than the AK CAP Opening Range Breakout Indicator. This powerful tool is backed by a US patent and has already helped countless traders pass funded challenges like FTMO. We use it daily on our prop traders and internal funds, and now it's available to you as well. The calculation behind the indicator is incredibly a

STALK, WAIT, STRIKE: A WIDE-STEP STOCHASTIC GRID THAT ONLY MOVES ON A CLEAR TURN. Built for traders who want a calm, two-sided grid with room to breathe. One job: wait for a slow Stochastic to turn out of an extreme zone, ladder 100 pips apart, close each side as one basket. Try it free first in the Strategy Tester with visual mode on. Reproduce it in two minutes: Strategy Tester, 2025.01.01 to 2026.09.30, 10,000 USD, 1 minute OHLC, default inputs. EURUSD H1: +24.58 USD, 29 trades, 28 of them wi
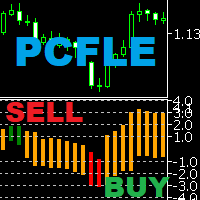
PCFLE Histogram (Price Change From the Last Extreme) - plots the percentage movement from the last extreme. Can be used for graphical representation of percentage movement from last lowest low to current high / from last highest high to current low. Input parametters: InpDigits - the number of decimal places displayed on the y-axis You can set colors and horizontal levels in the indicator properties. Examples of how to trade with the indicator can be found in screenshots.

Trend Reversal alert: The concept of the EA is to give you a message/alert when something happens in the market, so you will never pass a tradechance for a trendreversaltrade. The EA give you the message when the chance is higher for a trendreversal, but it is important to say that this doesn`t mean that you should trade every signal. The advantage provided by the program is that you don`t need to sit the hole time for the PC and look at the chart because you get a message when a good trendrever
FREE

僕自身が数年間使っている便利なロボットをご紹介します。半自動モードでも完全自動モードでもお使いいただけます。 >>> Chat <<<
当プログラムは経済指標カレンダーで発表されるニュースをもとにした取引の柔軟な設定が可能です。戦略テスターでは確認不可です。実際の取引のみです。
最新の設定アーカイブをダウンロードしてください: https://www.mql5.com/en/blogs/post/747929 シグナルモニタリング: https://www.mql5.com/en/signals/author/test-standart 当該エキスパート・アドバイザーのためのカスタマイズ設定セットを作る場合は、ブログの全パラメータの説明を参照してください : https://www.mql5.com/en/blogs/post/748545 。
基本的なデフォルト設定について 一つのチャートからGBPとの通貨ペア(GBPUSD、EURGBP、GBPJPY、GBPCAD、GBPAUD、GBPCHF)で取引をします。GBPは最もボラティリティの高い通貨のため、取引が成功するチ

Vix 75 and Boom Sniper Entry
= Assistance for Non Beginners traders = Market Structure is KEY =Trading is a Risk ... Know what you are entering into when starting your trading journey
Basically the indicator gives signals due to reach of Support and Resistance, it also give signals on touch of order block. Works Best on Gold and Eurusd and Synthetic Index - its best give accurate confluences with a TDI
TDI settings: RSI Period -10 Bollinger Bands - Period 34 - First indicators Data M
Forex Calculator は、すべてのトレーダーにとってなくてはならないプログラムです。
このスクリプトを使用すると、設定されたピップ単位のストップロスに応じて、預金のリスクの割合を計算できます。
外国為替計算機を使用すると、取引を開始する前にリスクを簡単に計算できます。情報は、取引を開始するために必要なロットを示すポップアップウィンドウとして表示されます。これにより、計算にかかる時間を節約でき、最終的な取引を開始するときに、その開始の結果を確認できます。
キーボードのボタンを押すことでスクリプトをすばやく実行するのに役立つホットキーをスクリプトに添付できます。 Robot Scalper - https://www.mql5.com/en/market/product/77108
スクリプトの利点:
あなたは常にあなたがすべての取引で何を危険にさらしているのかを正確に知っています。 計算機は契約の仕様を考慮に入れます データ入力リスクとピップ単位のストップロスサイズの2列のみ オプション
Risk_in _% -トランザクションで使用するリスクのパーセンテー

KT Auto SL TP EAは、すべての手動取引にストップロスとテイクプロフィットを追加し、その後ストップロスを建値(ブレークイーブン)に移動してトレーリングします。 パソコンでもスマートフォンでも、取引を開いてください。すぐにストップロスとテイクプロフィットが設定され、チャート上のラベルに使用中の設定がそのまま表示されます。このEAが自分で取引を開いたり決済したりすることはありません。 主な機能 成行の取引と待機注文に、あなたのストップロスとテイクプロフィットを追加します。対象はチャートの銘柄だけ、または1つのチャートからすべての銘柄を選べます。 管理するのはあなたの手動取引だけで、他のEAの取引には触れません。 新しいティックを待たず、1秒間に約7回取引をチェックします。 待機注文のレベルは注文価格から設定されるため、注文が約定した時点で保護が整っています。 ブローカーの最小ストップレベルより小さい距離は、その最小値まで広げます。 ブレークイーブンとトレーリングストップ 取引が設定した利益に達すると、EAはストップロスをエントリー価格に移動します。オプションのオフセットで数ポイ

真の需給指標 -すべての時間枠で抵抗の場所とサポートレベルをすばやく決定できます。 この指標は、取引でテクニカル分析を使用する人に役立ちます。 インジケーターは使いやすく、チャート上でドラッグアンドドロップするだけで、インジケーターは最も可能性の高いサポートレベルとレジスタンスレベルを表示します。 時間枠を切り替えると、新しく選択した時間枠のレベルが表示されます。
おすすめのロボットスキャルパー - テスト 。
入力パラメータ Use_priceラベル -オン/オフレベルの近くに価格アイコンを表示する 価格レベルの色 -価格アイコンの色を選択します 価格Lebelサイズ -価格アイコンサイズ サポート/耐性レベルの色 -レベルの色を選択します 私の購読 ページ 、私は他の多くの有用な製品を持っています。 この指標が気に入ったら 、レビューを残してください。便利な製品を無料で共有する動機付けになります。
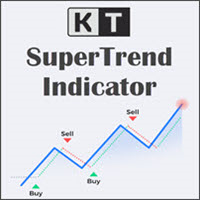
KT SuperTrend は、価格チャート上に分かりやすい一本の方向ラインを表示します。上昇トレンドではラインが価格の下を階段状に進み、値動きを追うための基準になります。下降トレンドではラインが価格の上に移動し、市場の下落に合わせて進みます。価格との距離は Average True Range を基にしているため、ボラティリティの拡大や縮小に応じて変化します。 ローソク足が SuperTrend ラインの反対側で確定すると方向が変わります。ラインより上での確定は上昇トレンドのシグナル、下での確定は下降トレンドのシグナルです。最新シグナルの方向とエントリー価格もチャートに表示されるため、過去のローソク足を探さなくても現在の状態を確認できます。 チャートを三段階で確認する 現在のラインを確認: ラインが価格の下にあれば上昇方向、価格の上にあれば下降方向の見方を支えます。 時間足を比較: 内蔵スキャナーは M1 から月足までの SuperTrend の方向を表示します。実際に取引する時間足の方向がそろっていると、全体像を判断しやすくなります。 直近の変化を確認: チャート上の最新シグナルと

市場方向をひと目で確認 KT Trend Filterは、改良されたトレンド分析方法を価格チャート上の見やすい色分けラインとして表示します。複数のインジケーターを重ねなくても、市場が上昇、下降、横ばいのどの状態にあるかを素早く確認できます。Trend Periodの初期値は200で、広い方向性を捉えながら現在の状態を明確に表示します。 トレンド方向を分かりやすい視覚情報に変換 青のUptrend: 強気の市場状態を示し、ご自身の戦略に合う買い機会へ集中しやすくします。 サーモン色のDowntrend: 弱気の市場状態を示し、ご自身の戦略に合う売り機会へ集中しやすくします。 カーキ色のSideways: トレンド条件が明確でない場面で、持ち合いや方向の混在を見つけやすくします。 取引中のチャートで、エントリー、ポジション管理、時間軸の整合を確認する素早い視覚フィルターとして活用できます。 9つの時間軸で全体像を確認 オプションのMTF Scannerは、M1、M5、M15、M30、H1、H4、D1、W1、MN1についてUptrend、Downtrend、Sidewaysを表示します。チャ
KT Aroonオシレーターは、Tushar Chande氏が1995年に開発した元のAroonオシレーターを改良したバージョンです。現在の高値および安値間の時間間隔を測定し、その情報をもとに市場トレンドの方向と強さを計算します。 このインジケーターは、上昇トレンド中には連続して新高値が形成され、下降トレンド中には新安値が形成されるという概念に基づいています。 買いシグナル: Aroon UpラインがAroon Downラインを上抜けたとき。
売りシグナル: Aroon DownラインがAroon Upラインを上抜けたとき。
特徴
チャート上にAroonシグナルを示す上下の矢印を表示。 市場のトレンドを効率的に表示。 シンプルで視認性が高く、チャートが煩雑になりません。 すべてのMetaTraderアラートに対応。
入力項目 期間: Aroon UpおよびDownラインの計算に使用される期間。 上下矢印の表示: Trueに設定すると、各新しいシグナルでチャートに矢印を表示します。 アラート設定: ポップアップ、サウンド、モバイル通知、メールなどの各種アラートを設定可能。
Ar

KT Heiken Ashi Alert は、標準的な平均足(Heiken Ashi)ローソク足に基づいて、買い・売りの矢印を表示し、アラートを生成するインジケーターです。Heiken Ashi をトレード戦略に取り入れたいトレーダーにとって、必須のツールです。 平均足が弱気から強気に変わったときに買い矢印が表示されます。 平均足が強気から弱気に変わったときに売り矢印が表示されます。 モバイル通知、メール通知、サウンド、ポップアップアラートを搭載。
Heiken Ashiとは? 日本語で「Heiken Ashi(平均足)」は「平均バー」を意味し、ローソク足チャートをより見やすくし、トレンドの把握をしやすくします。トレーダーは Heiken Ashi をエントリー・エグジットの両方に活用できます。色の変化は、相場の方向転換を示すことがよくあります。
覚えておきたいポイント
Heiken Ashi Alert を単体で使うのではなく、他のインジケーターと組み合わせて使用することで精度が向上します。 トレンド転換は、上下ヒゲのある小さなローソク足から始まることが多いです。 上ヒゲのない赤

KT Pip Counter は、リアルタイムで重要な数値を表示するシンプルかつ実用的なインジケーターです。現在の損益やスプレッド、残り時間などを素早く把握できるため、緊張感の高いトレード中でも客観的な判断を下しやすくなり、無駄なストレスを軽減しながら取引戦略を最適化できます。
特徴
現在の損益を通貨・pips・パーセンテージで同時表示。 最新スプレッドを即時に表示。 現在のバーがクローズするまでの残り時間をカウントダウン。 損益状況に応じた色分けで視認性を向上。 テキストの位置とレイアウトは完全にカスタマイズ可能。 CPU 使用率は極めて低く、プラットフォームの動作を妨げません。
入力パラメータ Account P&L: true にすると口座全体の損益を表示し、false なら現在のシンボルのみ表示。 カラーおよびフォントサイズの設定。 Show After Current Bar: true の場合、情報はバー確定後に表示し、false の場合はチャート四隅に固定。 その他の入力項目は直感的で分かりやすい設定です。

KT Pivot Points は、最新の市場データに基づいて、日足・週足・月足のピボットレベルをチャート上に自動で表示します。ピボットポイントは、特にFX市場において、テクニカル分析で広く利用されている指標の一つです。
特徴
価格がピボットレベルに到達した際にアラートを送信します。 各種類のピボットレベルに対して完全なカスタマイズが可能です。 シンプルな表示で、日足・週足・月足のピボットレベルを一目で確認できます。 最小限のCPUリソースを使用し、高速な計算を実現します。 チャート上の他のインジケーターとも互換性があります。
ピボットポイントとは ピボットポイントは、前の取引日の高値、安値、終値の平均から算出されます。 この計算により、将来のサポートおよびレジスタンスレベルを予測でき、価格がこれらのレベル付近でどのように動くかを判断する手助けとなります。 また、価格がピボットポイントの上にあるときは強気傾向、下にあるときは弱気傾向とされるのが一般的です。
ピボットの計算式
ピボットレベルの計算には、前日、週、または月の高値、安値、終値が使用されます。 P = (H +
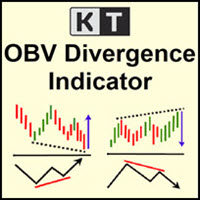
KT OBV Divergence は、価格と OBV(オンバランスボリューム)オシレーターとの間に形成される通常および隠れたダイバージェンスを表示します。
機能
非対称なダイバージェンスは除外され、精度が向上し、チャートの見やすさも保たれます。 トレンドの反転とトレンド継続の両戦略に対応。 エキスパートアドバイザーへの組み込みに完全対応。 エントリーにもエグジットにも使用可能。 すべての MetaTrader アラートに対応。
ダイバージェンスとは何か?
テクニカル分析において、価格が高値を更新している場合、オシレーターも同様に高値を更新すべきです。価格が安値を更新している場合も、オシレーターはそれに追随すべきです。このような通常の関係が崩れたとき、価格とオシレーターが乖離(ダイバージェンス)していると判断されます。 ダイバージェンスには、以下の2つの主要な種類があります: 通常の強気ダイバージェンス: 価格がより低い安値をつけるが、オシレーターはより高い安値をつける場合。 通常の弱気ダイバージェンス: 価格がより高い高値をつけるが、オシレーターはより低い高値をつける場合

KT Currency Strength Meter は、主要なFX通貨ペアに集約された数学的計算式を適用することで、各通貨の強さと弱さを測定します。 固定された期間内の強気および弱気のローソク足に基づいて通貨の強さが計算されます。その後、アルゴリズムが最も強い通貨と最も弱い通貨をリアルタイムのデータで並べ替え、継続的に順位を更新します。
利点
強い通貨に対して弱い通貨を買うような誤った取引シグナルを除外することで、トレーディング戦略を即座に改善できます。 意図しないヘッジ取引や過剰取引を回避します。 最強通貨に対して最弱通貨を買うといった、リスクの高い逆張り取引を避けられます。 互いに打ち消し合うようなポジションをフィルタリングします。 最新データを用いてリアルタイムで更新されます。 軽量設計でPCのリソースを最小限に抑え、他のインジケーターやEAに影響を与えません。 各通貨に専用カラーが割り当てられており、識別が簡単です。 複雑な設定は不要で、シンプルで直感的な入力パラメータ。
プロのヒント データは現在の時間足から取得されるため、低い時間足での使用は避けてください。データの変
KT TRSI は、RSI(相対力指数)、EMA(指数移動平均)、SMA(単純移動平均)を組み合わせて作られたオシレーターです。従来のRSIと比較して、TRSIはSMAのスムージング効果により、偽のシグナルに対する感度が低くなります。また、MetaTraderのすべてのアラート機能にも対応しています。
シンプルなエントリールール
買い:青いライン(RSI)が赤いライン(TRSI)を上抜けたとき。 売り:青いライン(RSI)が赤いライン(TRSI)を下抜けたとき。
高度なエントリールール 買い:青いライン(RSI)が売られすぎレベルを下回り、その後再び上回り、赤いライン(TRSI)と強気のクロスオーバーが発生したとき。 売り:青いライン(RSI)が買われすぎレベルを上回り、その後再び下回り、赤いライン(TRSI)と弱気のクロスオーバーが発生したとき。
より正確な判断を行うには、TRSIに加えて他のインジケーターや確認シグナルを併用することが重要です。
TRSIの計算式
トリプルEMA = RSIのEMAのEMAのEMA。 TRSI = トリプルEMAのSMAを3バー右にシフトしたも

チャート上でボリンジャーバンドへのタッチを監視 KT Bollinger Bands Alert は、上部、中央、下部のボリンジャーバンドを表示し、現在のローソク足が選択したバンドに触れたかを監視します。取引手法に必要なバンドイベントを有効にしておけば、ほかの市場に集中している間も重要な瞬間を通知で確認できます。 3本のバンド価格を常に確認 オプションの価格タグは、上部、中央、下部バンドの現在値に合わせてチャート上を移動します。各バンドの色も個別に設定できるため、外側の境界と中央の基準線を自分のレイアウト内で見分けやすくできます。 計算方法とアラートの流れを設定 ボリンジャー設定: 期間、偏差、シフト、適用価格を調整できます。 チャート履歴: バンドを表示する過去のバー数を選択できます。 バンド選択: 上部、中央、下部バンドのアラートを個別に有効または無効にできます。 アラート間隔: タッチ通知の繰り返しを調整するため、アラート間の最小分数を設定できます。 必要な方法でアラートを受信 選択可能なサウンドファイル、ポップアップ、メール、モバイルプッシュ通知を自由に組み合わせて使用できます
KT RSI Alerts は、RSI(相対力指数)オシレーターをベースとしたカスタムインジケーターで、次の4つのイベントに基づいたシグナルとアラートを提供します。 RSI が買われすぎゾーンに入ったとき。 RSI が買われすぎゾーンから出たとき。 RSI が売られすぎゾーンに入ったとき。 RSI が売られすぎゾーンから出たとき。
特徴 RSI が買われすぎ・売られすぎゾーン内でどのように動くかを分析するトレーダーにとって最適な選択肢です。 軽量に設計されており、パソコンのメモリやリソースをほとんど消費しません。 MetaTrader のすべてのアラート機能に対応しています。
相対力指数(RSI)の歴史 RSI は J・ウェルズ・ワイルダーによって開発され、1978 年に出版された著書『New Concepts in Technical Trading Systems』および同年 6 月号の『Commodities』誌で初めて紹介されました。RSI はモメンタム・オシレーターの一種であり、価格変動のスピードと大きさを測定します。上昇終値と下降終値の比率からモメンタムを計算する仕組み

KT Forex Volumeは、通貨ペアの買いと売りのボリュームをカラーのヒストグラムで表示します。ボリュームとは、資産の買い取引と売り取引の総量を指します。 FX市場では: 買いのボリュームが売りのボリュームを上回ると、通貨ペアの価格は上昇する傾向があります。 売りのボリュームが買いのボリュームを上回ると、通貨ペアの価格は下落する傾向があります。
特徴 ティックボリュームのデータを用いてトレードを確認することで、不利な取引を回避できます。 大口トレーダーの流れに沿ったトレードを支援します。 すべてのMetaTraderアラートに対応しています。
ティックボリュームの活用 他の市場と異なり、スポットFX市場は中央集権化されていないため、リテールトレーダーにとって正確な取引ボリュームデータを得るのは困難です。 ベテランのFXトレーダーであるCaspar Marneyは2011年に論文を発表し、ティックボリュームと実際の取引ボリュームとの間に高い相関と精度があると結論付けました。
ヒストグラムの計算式
KT Forex VolumeインジケーターはChaikinオシレーターを基にし
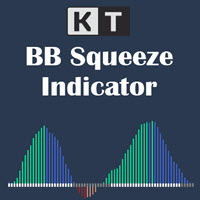
モメンタム拡大の前にボラティリティの収縮を確認 KT BB Squeeze は、ボラティリティの状態とモメンタムの方向を一つの見やすいオシレーターにまとめます。Bollinger Bands と Keltner Channels を比較して市場が収縮中か拡大中かを示し、ヒストグラムでゼロラインを基準にモメンタムの変化を確認できます。 灰色のドット: Bollinger Bands が Keltner Channels の内側にあり、スクイーズまたは収縮局面を示します。 白色のドット: Bollinger Bands が Keltner Channels の外側にあり、拡大局面を示します。 ゼロラインを基準に四つのモメンタム状態を読む 色分けされたヒストグラムが方向と強さを分けて表示するため、強気または弱気のモメンタムが増しているのか、弱まり始めているのかを把握できます。 緑色のバー: 強気モメンタムがゼロより上で上昇しています。 青色のバー: 強気モメンタムはゼロより上ですが弱まっています。 赤色のバー: 弱気モメンタムがゼロより下で強まっています。 サーモン色のバー: 弱気モメンタム
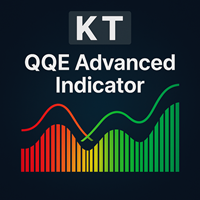
KT QQE Advanced は、クラシックな QQE オシレーターを改良し、カラー ヒストグラムと高速・低速のトレーリングライン(TL)でより正確に視覚化するインジケーターです。
従来の QQE と異なり、KT QQE Advanced はヒストグラム形式で表示され、買われ過ぎ・売られ過ぎレベルを明示します。
活用例
MTF スキャナーで全タイムフレームの売買シグナルを素早く検出。 トレンド方向をより正確に把握。 買われ過ぎ・売られ過ぎの市場状態を特定。 価格モメンタムの強弱を可視化。
入力パラメータ RSI 期間 平滑化期間 MTF スキャナー アラート設定
QQE とは? QQE は Quantitative Qualitative Estimation の略で、超スムーズ RSI と ATR を組み合わせたオシレーターです。 クラシック RSI の代わりに Wilder RSI を採用し、独自の指数平滑移動平均でスムージングを行います。 Wilder の平滑式 = 前回 MA + (1 / n × (終値 − 前回 MA))
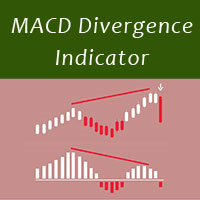
MACD divergence indicator finds divergences between price chart and MACD indicator and informs you with alerts (popup, mobile notification or email) . Its main use is to find trend reversals in the chart. Always use the divergence indicators with other technical assets like support resistance zones, candlestick patterns and price action to have a higher possibility to find trend reversals. Three confirmation type for MACD divergences: MACD line cross zero level Price returns to previous H/L Crea
FREE
Mouse You can draw fibonaccis moving the mouse over the zigzag indicator Pin them You can click on fibonacci with this option and it will no longer be deleted unless you click on it again :) Precision The tuned fibonacci gets the precise point in lower timeframes Enjoy it You can ask me for add more features, so please comment and leave your ranting for me to be happy, thank you :)
FREE

The market eagle - it is a Secure Automated Software for trade Forex market and indices.This EA takes perspective of the market looking like an eagle. From a distance, observe the entire market amphitheater detecting the entry points and the best points to implement the algorithm based on the set that we indicate in the input.This system allows us to use the key points of the market to adapt them to our algorithms, trend and countertrend. The system uses multiple lot depending on the algorithm
MACD Divergence Scanner is a multi-timeframe and multi-symbol dashboard and alert that checks all timeframes and symbols to find regular and hidden divergences between price chart and MACD indicator. This divergence scanner is integrated with support and resistance zones so you can check the MACD divergences in the most important areas of the chart to find trend reversals in the price chart. Download demo version (works on M4,M6,M12,M20,H3,H8 timeframes of 20 symbols of Market Watch window)
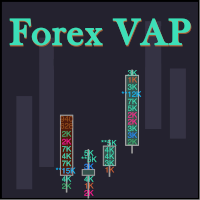
What do you see inside a candle? How to interpret the fight between bulls and bears? The candlestick chart brings a lot of information, but the volume is lacking in the candlestick body. This is where the Forex Volume At Price Expert Advisor comes in. This advisor searches for a set of recent trades, calculates the buy and sell attack volumes and prints on the candles, the volume value in each price range. You can also define up to ten colors to filter volumes and make it easier to
FREE

The added video will showcase all functionality, effectiveness, and uses of the trade manager. Drag and Drop Trade Manager. Draw your entry and have the tool calculate the rest. Advanced targeting and close portions of a trade directly available in tool (manage trades while you sleep). Market order or limit order on either side with factored spread. Just draw the entry, the tool does the rest. Hotkey setup to make it simple. Draw where you want to enter, and the stop loss, the tool calculates al

Market Momentum Alerter Market Momentum Alerter will inform you about danger to operate in the market.
Imagine you see a very nice setup (Forex, Stocks, Indices) and you decide to place your trade...
And you finally lose your trade and don't understand what happened.
This can happen due to big operations in the market carried out by banks and big institutions.
These operations are invisible for most people.
Now with the Market Momentum Alerter you will be able to detect those operations...

Tomamos 5 medios móviles las unimos en una la cual suavizamos y volvemos a suavizar, resultando un mega suavizador de medios móviles suavizadas. Indicador de mql5 funciona en cualquier broker y para todos los tiempos, siendo el mas optimo el de 5, 15 a mas. Funciona mejor en grupo consigo misma osea poner uno de 14 y otro de 50 y 400,, así se observa mejor su desempeño.

Eakao is a trending following EA. This EA uses some custom indicators to detect entry signal. There are 2 trades opened per signal, one trade has fixed take profit, EA will use breakeven and trailing stop for another trade. The fixed stop loss and take profit are always set for each trade. Beside stop loss, this EA uses an exit indicator to exit the trade before stop loss or take profit are triggered. This EA has smart money management. Users only need to determine the accepted loss for each tr

LL Hedge EA is a structured hedge recovery system for MT5 designed for controlled drawdown and stable execution. Trader's guide available here . Built for disciplined traders who prioritize risk control over aggressive exposure.
Engine optimized with centralized position cache to reduce CPU load and improve execution efficiency.
Suitable for:
• Traders familiar with hedge strategies
• VPS users seeking stable execution
• Users who understand lot and risk control
Core Features Dynamic hedg

Vero Grid is an advanced grid system that has been working on real accounts for many months. The system is designed to detect market inefficiencies and find the best entry points to close trades in the positive.
The system supports many pairs but it is recommended to use it on pre-posted pairs:
Supported currency pairs: AUDNZD;NZDCAD;EURCHF WITH TIMEFRAME M15
Supported currency pairs: AUDUSD;AUDCAD;EURAUD WITH TIMEFRAME H1
Features: Only one chart for setup: You can use EA only on one pair

ATR Scanner Pro is a multi symbol multi timeframe volatility scanner that monitors and analyzes Average True Range indicator value in up to 28 symbols and 9 timeframes in 3 modes : ATR value: As a volatility dashboard it shows the ATR indicator value in all pairs and timeframes and signals when the ATR value reaches a maximum or minimum in a given duration. Short term ATR/Long term ATR ratio: It shows ratio of 2 ATRs with different periods. It's useful in detecting short term volatility and

SL Gold Scalper EA is optimized to trade GOLD (XAUUSD) asset. Based on the analysis of the market behavior a strategy that minimizes loss trades to successfully implement the martingale method. Multi-time frame analysis included for higher percentage of safe entries avoiding stop loss (SL) hunting from the market makers.
Expert Advisor Recommended Guide lines ================================================ Input Settings: MagicNumber => (Unique number per chart e.g 34505)
XAUUSD => 4 Hour Ch

Indicator and Expert Adviser EA Available in the comments section of this product. Download with Indicator must have indicator installed for EA to work.
Mt5 indicator alerts for bollinger band and envelope extremes occurring at the same time. Buy signal alerts occur when A bullish candle has formed below both the lower bollinger band and the lower envelope Bar must open and close below both these indicators. Sell signal occur when A bear bar is formed above the upper bollinger band and upper
FREE

Test it free first: load Hope EA in the MetaTrader 5 Strategy Tester, turn on visual mode, and watch how little it does while it waits and what it does when price turns against it. PATIENT ENTRIES. A LADDER WITH LIMITS. A BOOK THAT REMEMBERS. Hope EA is a two-sided grid for traders who prefer a quiet robot to a busy one. It enters only after a slow momentum reading turns back from an extreme, adds levels only when price has really moved, and pays down its oldest order with the profit of its newe
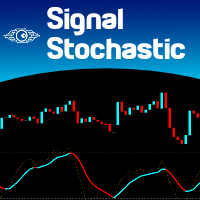
It is the very same classic Stochastic indicator, but with a little twist: we changed the Signal Line with a 2-color line, so we can use it with EAs as a filtering system. And that's it! I know it could seem stupid but I needed that, so I created it. The original formula is right from Metaquote's chest, no additions, no subtractions, it is Stochastics in its core.
So I will not publish here the Stochastics parameters as they are all the same as always... Enjoy!
If you like this indicator, all I
FREE

Script for Metatrader 5. One click to Delete the background grid and object, all objects on the chart such as Trend lines you have drawn or created by another program arrows text Fibonacci lines removes the background grid making a clearer clean chart horizontal and vertical lines
Easy for clearing a chart or when opening new charts. Please leave a review on how its working.
FREE
Application with Close Button.
Program include parameters to change settings:
Robot work with Symbols: - All Symbols - Current Chart Symbol
Transaction close (Profit/Loss): - All - Close Profit Only - Close Losing Only
Retries - max retries to close all transaction Sleep - time in ms between next Retries
Robot is free.
Robot designed for learn publish robots in Market.
FREE

KT Fisher Transform is an advanced version of the original Fisher Transform oscillator equipped with divergence detection, crossover alerts, and many more features. Originally it was developed by John F. Ehlers. It converts the asset's price into a Gaussian normal distribution to find the local extremes in a price wave.
Features
A light-weighted oscillator that efficiently identifies the upward and downward crossovers and marks them using vertical lines. It also finds regular and hidden diverg

FAST, PATIENT, TWO-SIDED: A STOCHASTIC GRID THAT KNOWS WHEN TO WAIT. Built for traders who want a quiet two-sided grid. One job: wait for a smoothed Stochastic turn, ladder 40 pips apart, close each side as one basket. Try it free first in the Strategy Tester with visual mode on. Reproduce it in two minutes: Strategy Tester, EURUSD H1, 2025.01.01 to 2026.09.30, 10,000 USD, leverage 1:100, 1 minute OHLC, default inputs. Our run on terminal data: +7.28 USD, 13 trades, profit factor 1.48, maximum e
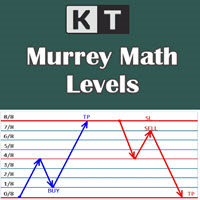
It shows the Murrey Math levels on chart and also provides an alert when price touch a particular level. T. Henning Murrey, in 1995, presented a trading system called Murrey Math Trading System, which is based on the observations made by W.D Gann.
Applications
For Murrey Math lovers, this is a must-have indicator in their arsenal. There is no need to be present on the screen all the time. Whenever the price touches a level, it will send an alert. Spot upcoming reversals in advance by speculatin

Only 1 copies left at a price of $99. Next price $199!
actual .set files (click me)
interactive panel manual (click me) Version for MT4: Smart Start MT4 Smart Start
is a smart trading system, the indicators of which allow it to be used both for trading with small deposits (fast acceleration) and for conservative trading. is a modernized trading indicator system that uses the MACD indicator to analyze the market. To analyze entry points, smart start takes into account the historical in

Утилита TemplateSwitcher позволяет автоматически переключать набор используемых на графике индикаторов и объектов в зависимости от текущего таймфрейма графика и/или символа. Часто бывает так, что на графике старшего таймфрейма используется индикатор с одним периодом расчета, а для младшего таймфрейма этот же индикатор необходим с увеличенным периодом расчета. Можно, конечно же, открыть два графика разных таймфреймов с нужными периодами индикатора. Но что, если мы не можем позволить себе дублиров
KT Candle Timer shows the remaining time in the closing of the current bar. You can use the bar closing time for multiple purposes, including time and trade management during the trading hours.
Features
It also shows the Symbol spreads along with the remaining time. It offers two convenient timer display positions, i.e., chart corner or next to the current bar. From colors to text size, it offers full customization according to user preferences. It is optimized to work without using extensive c

• Please test the product in the Strategy Tester before purchasing to understand how it works.
• If you face any issues, contact me via private message—I’m always available to help.
• After purchase, send me a screenshot of your order to receive a FREE EA as a gift.
In this EA you will have two sources of income:
1- Direct trades
2- Rebates from your broker.
Thus insure to register under an IB that shares with you their revenues
Scalping! What a thrill!
Forex trading had been a source of

KT Bullish Bearish shows the bullish/bearish regime of the market in the form of a colored histogram representing both of the market states alternately. Bull Market (Blue Histogram): A bull market indicates an uptrend when an instrument price rises over a continued period like days, months, or years. Bear Market (Red Histogram): A bear market indicates a downtrend when an instrument price rises over a continued period like days, months, or years.
Applications
It prevents trading against the big
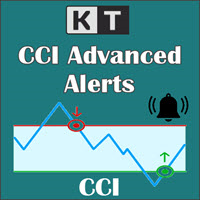
KT CCI Alerts is a personal implementation of the Commodity Channel Index (CCI) oscillator that provide signals and alerts on four custom events: When CCI enter in an overbought zone. When CCI exit from an overbought zone. When CCI enter in an oversold zone. When CCI exit from an oversold zone.
Features A perfect choice for traders who speculate the CCI movements within an overbought/oversold zone. Lightly coded without using extensive memory and resources. It implements all Metatrader alerts.
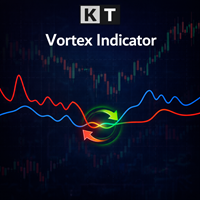
The Vortex Indicator was first presented by Douglas Siepman and Etienne Botes in January 2010 edition of Technical Analysis of Stocks & Commodities. Despite its based on a complex implosion phenomenon, the vortex is quite simple to interpret. A bullish signal is generated when +VI line cross above the -VI line and vice versa. The indicator is mostly used as a confirmation for trend trading strategies. The Vortex was inspired by the work of Viktor Schauberger, who studied the flow of water in tur

• Please test the product in the Strategy Tester before purchasing to understand how it works.
• If you face any issues, contact me via private message—I’m always available to help.
• After purchase, send me a screenshot of your order to receive a FREE EA as a gift.
Time frame: M1
Leverage : Higher the better
Spread: Lower the better
Account type : All types
(EA may enter hedge positions, if you want to
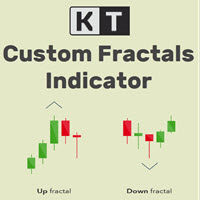
KT Custom Fractals is a personal implementation of the Fractal indicator first introduced by Bill Williams. With KT Custom Fractals you can choose a custom number of bars to allow to the left and right side of the fractal. For example, you can display the fractals that have "three" successive bars with the highest high in the middle and one lower high on both sides , or you can display the fractals that have "Eleven" consecutive bars with the lowest low in the middle and five higher lows on bot

KT Fractal Channel Breakout draws a continuous channel by connecting the successive Up and Down fractals. It provides alerts and also plots the Up and Down arrows representing the bullish and bearish breakout of the fractal channel.
Features
If you use Bill Williams fractals in your technical analysis, you must also include it in your trading arsenal. It can be very effective and useful for stop-loss trailing. A new market trend often emerges after a fractal channel breakout in a new direction.
Mago B3 Trader é um robô especialista baseado na estratégia do trader Dantas . A estratégia é baseada em cruzamento de médias móveis , com estabelecimento de stops fixos (alvo e stoploss). Além disso, é possível configurar o stoploss para ser dinâmico conforme análise de velas anteriores (máximas e mínimas). As funcionalidades de daytrade, habilitar apenas ordens de compra ou venda, bem como definição de horários para trades também podem ser configuradas. Funciona tanto para Miniíndice WIN , qua
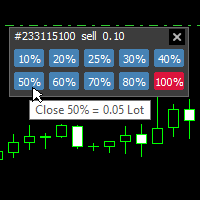
With this tool, you can easily and quickly close part of the trade. Click near the trade to display the closing panel. There are ten preset values for partial closing, but you can set your own values. You can also resize the panel according to Windows settings (125%, 150% ...) See the animation below for how it works. **********************************************************
Note: This tool does not work in the tester.
MetaTraderマーケットは自動売買ロボットとテクニカル指標を販売するための最もいい場所です。
魅力的なデザインと説明を備えたMetaTraderプラットフォーム用アプリを開発するだけでいいのです。マーケットでプロダクトをパブリッシュして何百万ものMetaTraderユーザーに提供する方法をご覧ください。

取引の機会を逃しています。
- 無料取引アプリ
- 8千を超えるシグナルをコピー
- 金融ニュースで金融マーケットを探索