 MetaTrader 5
 エキスパート
 インディケータ
 ライブラリ
ライブラリ
 ユーティリティ
 ウィジェット
 ルール
ルール
YouTubeにあるマーケットチュートリアルビデオをご覧ください
ロボットや指標を購入する
仮想ホスティングで
EAを実行
EAを実行
ロボットや指標を購入前にテストする
マーケットで収入を得る
販売のためにプロダクトをプレゼンテーションする方法
MetaTrader 5のためのテクニカル指標 - 180
 テクニカル指標からのシグナルは、株式および外国為替市場での取引の開始と終了に重要な役割を果たします。指標の本質は、将来の価格変動を予測することを目的とした金融銘柄価格の数学的変換です。
テクニカル指標をテストして、市場の動きとそれからの利益をより正確に予測します。
テクニカル指標からのシグナルは、株式および外国為替市場での取引の開始と終了に重要な役割を果たします。指標の本質は、将来の価格変動を予測することを目的とした金融銘柄価格の数学的変換です。
テクニカル指標をテストして、市場の動きとそれからの利益をより正確に予測します。 
概要 Asian Session Break and Retest Dashboard Pro は マルチシンボル対応の機関投資家スタイルのトレーディングインジケーターです アジアセッションの流動性ゾーンを特定し ブレイクアウト後の市場方向の変化を検出し M30時間足で重要なリテストポイントへ価格を導くことで 高確率なエントリー機会を提供します このインジケーターは マルチシンボルスキャン 構造化された市場ロジック ブレイクアウト検出 リテストアラートを 1つのダッシュボード型トレーディングシステムに統合しています コアトレーディングロジック このインジケーターは 各シンボルごとに 3段階の状態モデルで動作します ステージ 1 アジアンレンジ形成 取引日の最初に確定した H4 ローソク足を識別します 取得内容 Asian High Asian Low Asian Open 時間 描画内容 青ライン Asian High オレンジライン Asian Low 黄色の垂直ライン Asian Open これにより 日々の機関投資家の流動性レンジを定義します ステージ 2 ブレイクアウト確認 H

ZIVA Kinetic Rail (ZKR) The Science of Price Equilibrium ZIVA Kinetic Rail (ZKR) is a professional visual indicator designed to display an adaptive price rail directly on the chart. The rail follows price movement and changes its visual state according to active market behavior, helping traders observe directional movement, price balance, and structural transitions with greater clarity. Instead of presenting market direction through a static line or a conventional trend filter, ZKR builds a resp

As the name suggests pullback trades. I have been trading this signals for a long time now. Enjoy the pullback trades. You won't find something like this anywhere else. The most beautiful thing about this indicator is that you can trade it on any instrument. Forex, commodities, Stocks, crypto, index. No mean reversion trades just trading continuation. So enjoy No repaint. Signal only after bar close.

Trend Filter Check - ダウ理論ベースの環境認識インジケーター 【チャートの「迷い」を排除する王道のトレンド判定ツール】 Trend Filter Checkは、ダウ理論(一定期間の高値・安値の更新)に基づき、現在の相場が「買い優勢」か「売り優勢」かを瞬時に判定し、視覚化する極めてシンプルかつ強力な環境認識インジケーターです。 複雑な分析は必要ありません。チャート右上に表示される「BUY ONLY ZONE」または「SELL ONLY ZONE」のサインに従うことで、トレンドに逆らった無謀な逆張りや、無駄なエントリー(ポジポジ病)を物理的に防ぎ、トレードの勝率と安定性を向上させます。 【3つの強力な機能】 明確なゾーン表示(UI): 現在の価格が中心線を上回っているか下回っているかで、狙うべき方向をチャート上に常時テキストで明示します。 終値確定フィルター(ノイズ排除): 相場のノイズ(ヒゲによる一時的な価格のブレ)に騙されないよう、「ローソク足の終値が確定した時点」でのみ厳格にシグナルを判定します。後からシグナルが変わる(リペイントする)ことはありません。 スマート

Short Description On-chart strength analysis for synthetic currency baskets. Shows pair breakdown, coherence, pip sum and signal label directly on basket charts. Full Description Mattrix Basket Strength is an on-chart indicator designed for synthetic currency basket charts. It displays real-time strength analysis directly on the chart of any of the 8 major currency baskets (EUR, GBP, AUD, NZD, USD, CAD, CHF, JPY). What it shows When attached to a basket chart such as #USD, the indicator breaks

Vanguard Hedge Force MT4 は、構造化されたヘッジバスケット管理、クリーンなチャート制御、明確なダッシュボード可視性を備えた、規律あるゾーン回復型エキスパートアドバイザーです。MetaTrader 4 向けに設計され、精度、忍耐、制御された回復ロジックを重視するトレーダー向けに、システマティックなリスク管理による複雑な市場条件の管理のためのプロフェッショナルフレームワークを実装しています。 コア戦略
Vanguard Hedge Force MT4 は、専用クローズロジックでバスケットエクスポージャーを監視するゾーンベースのヘッジ回復フレームワークを採用しています。システムはランダムなエントリーではなく制御された意思決定を中心に構築され、主要な取引情報をチャートダッシュボードに直接表示します。手動制御と自動操作の両方をサポートし、マジックナンバーフィルタリングを使用してより安全な EA 固有のオーダー管理を実現し、不必要な複雑さよりも効率性を優先します。 主要機能 構造化されたバスケット管理を備えたゾーンベースのヘッジ回復フレームワーク インテリジェントなクロ

RSI Envelope Colored Zones は、MetaTrader 5 用のプロフェッショナルな RSI インジケーターです。Envelope バンドとカラー表示された極端ゾーンを搭載しています。
RSI ウィンドウ内で買われすぎ・売られすぎゾーンを直接表示し、素早く市場分析を行うことができます。
70以上の買われすぎゾーンは赤色で表示されます。 30以下の売られすぎゾーンは青色で表示されます。
さらに、RSI に Envelope バンドを適用して、モメンタムやボラティリティ分析を強化できます。
機能: • カラー RSI ゾーン • Envelope バンド • Push通知 • RSI ゾーンアラート • カスタマイズ可能 • 軽量設計 • 全市場・全時間足対応
アラート: • 買われすぎゾーンへの突入 • 売られすぎゾーンへの突入 • 買われすぎゾーンからの退出 • 売られすぎゾーンからの退出
設定: • RSI期間 • Envelope期間 • Envelope偏差 • 色設定 • Alerts ON/OFF • Push通知 ON/OFF
対応市


GDS Renko Anatomy Free Renko Structure and Movement Anatomy Indicator for MetaTrader 5 GDS Renko Anatomy is a free MetaTrader 5 indicator for traders who use Renko charts and want a clearer way to understand how brick-based movement is built. The indicator helps visualize Renko movement anatomy: structure, legs, pullbacks, pauses, continuation areas and weakening movement phases. It does not give buy or sell signals. It does not predict price movement. It is a visual context tool for manual Renk

The Big Short (Smart Money)
The Big Short (Smart Money) is a professional chart analysis indicator for MetaTrader 5, designed to help traders read market pressure, absorption zones, flow behavior, and important reaction areas directly on the chart.
This indicator was created for discretionary traders who want a clearer visual view of buy and sell pressure without using multiple separate indicators.
It is especially useful for fast chart reading on lower timeframes such as M1, and is suitab

ZeroLag Cosine MA: Break Lag, Catch Trend Extremes In trading, lag is the biggest pain point for every moving average user. By the time you see a signal and enter the market, much of the move has already passed. ZeroLag Cosine MA was created to solve this problem, delivering ultra‑fast response to help you catch trends at their earliest pulse. Key Advantages True Zero‑Lag Response Traditional moving averages overweight historical data, causing severe signal delay. Our indicator uses advanced wei

MTF Candle Visualizer Pro Elevate your Price Action analysis with a professional Multi-Timeframe Dashboard. Monitoring multiple timeframes is essential for high-probability trading, but switching charts constantly is exhausting. MTF Candle Visualizer Pro solves this by displaying real-time candles from 4 different timeframes (D1, H4, H1, M30) directly in a sub-window, ensuring you never lose sight of the "Big Picture." Key Features: Simultaneous Multi-Timeframe View: Display high-quality candles

DoubleBB MARSI — デイトレードに最適化されたオールインワン・チャートツール 価格の現在位置 · 市場の雰囲気 · エントリーシグナル — すべてを一画面で 一行サマリー DoubleBB MARSI は、デイトレードに必要な3つの核心情報 — 日次基準ライン · RSI による相場感 · ダブルボリンジャーバンドのシグナル — を一つのチャートに統合し、トレーダーが素早く正確な判断を下せるようサポートします。 トレーダーが得られる3つの価値 DoubleBB MARSI は単なる補助指標ではなく、デイトレードの一日のサイクル全体に必要な情報を一画面に提供します。 1. 「今、価格はどこにある?」 — 日次の重要ラインを自動表示 チャート上に次の3本のラインが自動で描かれます。 · DO (Day Open · 当日始値)
· PDH (Previous Day High · 前日高値)
· PDL (Previous Day Low · 前日安値) 現在価格が買い優勢ゾーンにあるのか、売り優勢ゾーンにあるのかを一瞬で判断できます。 「今日の始値より上で

HAS RSI Signal — SL/TP自動計算機能付き プロフェッショナル・トレンドインジケーター HAS RSI Signal は、信頼性の高いクラシックな手法と最新のノイズ除去アルゴリズムを融合させた強力なトレーディングツールです。 平均足スムーズド(Heiken Ashi Smoothed) と RSI を組み合わせることで、トレンドの転換点や買われすぎ・売られすぎ圏からの脱出タイミングを正確に捉え、明確なエントリーシグナルを提示します。 主な特徴: 二重のフィルタリング: 平均足スムーズドで市場の「ノイズ」を除去し、RSIで勢い(モメンタム)の強さを確認します。 損切り・利確ラインの自動計算: 単にシグナルを出すだけでなく、ボラティリティ( ATR )に基づいた最適なストップロス(SL) と テイクプロフィット(TP)を自動で算出します。 視覚的な分かりやすさ: シグナルはチャート上にカラーキャンドルとして表示されるため、一目でトレンドを把握でき、取引画面をスッキリと保てます。 充実の通知機能: アラート、音声、スマートフォンへのプッシュ通知機能を搭載。チャンスを逃すこと

Crypto_Forex MT5用インジケーター「 RSI with Dynamic OverSold/OverBought zones 」(リペイント機能なし) - RSIは最も人気のあるオシレーターの一つで、スキャルピングに最適です。 - ダイナミックな買われすぎゾーンから売り、売られすぎゾーンから買いを行うのに最適です。 - RSIオシレーターはダイバージェンス検出にも非常に役立ちます。 - このインジケーターは、売られすぎ/買われすぎゾーンからのプライスアクショントレードと組み合わせるのにも最適です。 - ダイナミックな買われすぎゾーン - 黄色の線より上。 - ダイナミックな売られすぎゾーン - 緑の線より下。 - PCとモバイルの両方でアラート機能付き。 高品質のトレーディングロボットとインジケーターをご覧になるにはここをクリックしてください! これは、このMQL5ウェブサイトでのみ提供されるオリジナル製品です。

概要 Forex Strength Matrix HeatMapは、8つの主要通貨(EUR、GBP、AUD、NZD、USD、JPY、CAD、CHF)のペア間の変動率を計算し、8×8のマトリクスパネルで各通貨の相対的な強さをチャート上に視覚的に表示するリアルタイム通貨強度ヒートマップインジケーターです。 28通貨ペアのリアルタイム状態を一画面で確認できます。赤は上昇(ブル)、青は下降(ベア)を示し、色の強さが変動の大きさを表します — 最も強く最も弱い通貨を素早く特定し、トレード判断をサポートします。 主な機能 28通貨ペアを完全カバー :8つの主要通貨の全組み合わせ、利用可能なペアを自動検出;サポートされていないペアはN/Aを表示 リバースペアの自動検出 : direttoペアが利用できない場合、自動的にリバースペアに切り替わり、方向を反転 カラーグラデーションヒートマップ :変動の大きさに応じて、中性色(白)から上昇色(赤)または下降色(青)にスムーズに推移 ドラッグ可能なパネル :パネルはマウスでドラッグでき、チャート上の任意の位置に配置可能 ホバーツールチップ :任意のセルにマウ

KS Magic Trend Signalは、MetaTrader 5用のトレンドおよび反転シグナルインジケーターです。
移動平均線によるトレンド検出、ジグザグベースのスイング/ピボット分析、高値更新/安値更新パターン認識を組み合わせることで、明確な売買シグナル、サポート/レジスタンスレベル、スイングラベルを生成します。これらの情報はすべてインジケーターバッファのみで描画されます。
コアコンセプト
このインジケーターは、ジグザグスイング(フィルタリングされたピボット)を用いて市場構造を特定し、以下の古典的なスイングパターンを検出します。
HH – 高値更新
HL – 安値更新
LH – 高値更新
LL – 安値更新
そして、これらのスイングから導出される動的なサポート/レジスタンスレベルと価格の相互作用に基づいてトレンド状態を構築します。
主な機能
機能説明:買い/売り矢印 トレンド転換時に、ドジャーブルーの↑矢印と赤の↓矢印が表示されます(価格がレジスタンスラインを上抜けると買い、サポートラインを下抜けると売り)。EHMAトレンドライン:カラー表示(ライム/

ご購入後、ご連絡いただければ、本インジケーターをベースにしたEA(自動売買システム)を無料ボーナスとしてご提供いたします。 ChandraSAR Optimizer:自己適応型・定量的トレンドエンジン ほとんどのトレンドインジケーターが機能しなくなる理由は単純です。それは「市場は変化するのに、静的なパラメーターは変化しないから」です。 ChandraSAR Optimizer は、単なるシグナル生成と高度なアルゴリズムテストの壁を取り払います。本製品は、配列ベースの高効率なウォークフォワード(Walk-Forward)最適化エンジンをチャートに直接組み込むことで、ボラティリティ変動の問題を解決するMetaTrader 5用のダイナミックなトレンドフォローシステムです。 シャンデリア・エグジット(Chandelier Exit)の精度と、パラボリックSAR(Parabolic SAR)のモメンタム追従性を融合させたChandraSARは、単にシグナルを生成するだけではありません。現在の相場環境に合わせて、自らのパラメーターを継続的にテスト、スコアリングし、適応させます。手動での調整は一

Lass System MT5: The Ultimate Non-Repainting Precision Indicator Lass System is a high-performance trading tool designed for traders who demand transparency, accuracy, and adaptability. Built on a sophisticated algorithm that never repaints , this indicator provides reliable entry signals across multiple asset classes including Gold (XAUUSD), Bitcoin (BTCUSD), and major Forex pairs like EURUSD . Key Features 100% Non-Repainting: Once a signal appears and the candle closes, it is locked in. Yo

Heikin – Smart Volume Support Overview
It provides enhanced visualization of price trends and momentum, with advanced customization options, theme integration, and seamless compatibility with volume-based tools. Designed for manual traders, scalpers, and algorithmic analysts, this indicator offers superior clarity for trend detection, momentum strength, and reversal spotting — especially when combined with volume analysis.
Key Features Pure Heikin Ashi Candles Generated natively (not overlays

The Advanced Volume Profile MT5 indicator is a powerful tool for analyzing market dynamics. It visualizes the total market order of buy versus sell within its defined range, offering a clear insight into the strength of price levels.
Here's an expanded description you can use: **Key Features and Advantages:**
Visualizes Market Order Flow: The indicator clearly displays the volume of buy and sell orders, allowing traders to understand the underlying sentiment and pressure at different price lev

Crypto_Forex MT5用インジケーター「ストキャスティクス(アラート機能付き)」(リペイント機能なし) - ストキャスティクスは市場で最も優れたインジケーターの一つで、多くのトレーダーにとって最適なツールです。 - 売られ過ぎ/買われ過ぎゾーンへのエントリーと、売られ過ぎ/買われ過ぎゾーンからの決済の両方に対応する、PCとモバイル向けのアラート機能を搭載しています。 - ストキャスティクスとシグナルラインの交差に対応する、PCとモバイル向けのアラート機能を搭載しています。 - アラート発動のトリガーレベルを調整可能です。 - 買われ過ぎゾーンは80以上、売られ過ぎゾーンは20以下です。 - インジケーターはどの時間足でも使用できます。 - このインジケーターは、プライスアクションテクニックと組み合わせるのに最適です。 高品質のトレーディングロボットとインジケーターをご覧になるにはここをクリックしてください! これは、このMQL5ウェブサイトでのみ提供されるオリジナル製品です。

DO YOU KNOW WHICH CURRENCY IS STRONGEST RIGHT NOW?
Before entering any trade, the most important question isn't "will this pair go up or down?" — it's "which currency has the most momentum right now?". Currency Strength Meter Pro answers that automatically, monitoring all 8 major currencies in real time across the Forex market.
HOW IT WORKS
The indicator analyzes 28 currency pairs and scores each currency based on the direction of closed

Anan Smart Flow Pro is a premium MT5 signal indicator designed for traders who prefer structured entries, clean visual execution zones, and confirmed closed-candle signals.
The indicator combines smart trend-following logic with ATR-based dynamic TP/SL levels to provide professional BUY and SELL opportunities directly on the chart.
Signals are confirmed only after candle close and do not repaint on closed candles.
Main Features:
• Non-repainting closed-candle signals • Smart BUY / SELL entr

️ FWS Currency Strength - 8-Currency Multi-Timeframe Meter See which currency is strongest - and which pair to trade right now. Currency Strength ranks all 8 G8 currencies (USD, EUR, GBP, JPY, AUD, CAD, NZD, CHF) from strongest to weakest using true cross-pair averaging across 5 timeframes (M5/M15/H1/H4/D1). It then auto-suggests the best pair to trade - the strongest currency vs the weakest. Compact on-chart panel plus a stunning browser dashboard. Part of the Forex Weather Station suite.

Greensight AI COMBO — xLSTM · GRU · Mamba → XGBoost | 21-TF Signal HUD What Is It? Greensight AI COMBO is a fully self-contained artificial intelligence indicator for MetaTrader 5. It trains three distinct deep learning sequence models — xLSTM (sLSTM) , GRU , and Mamba (Diagonal SSM) — directly on live market data, then feeds their outputs into a gradient-boosted XGBoost ensemble to produce a final directional signal. This two-stage pipeline runs across all 21 native MetaTrader 5 timeframes simu

Fimathe Shortcan Equador is a visual MetaTrader 5 indicator based on the historical XAU/USD weekly short candle from the week of June 13, 2021. This exceptional weekly candle had a range of approximately 11,687 points. In the Fimathe approach, the top and bottom of this candle define the original Shortcan channel. This channel is then projected forward as a structural price grid. The projected Equador lines have remained relevant over time and can act as important visual support and resistance z

Institutional Fusion Levels(インスティテューショナル・フュージョン・レベルズ) Institutional Fusion Levelsは、前日・前週・前月のマーケット構造レベルを活用し、機関投資家レベルの高確率な価格反応ゾーンを特定するために設計されたプロフェッショナルなマルチタイムフレームのサポート&レジスタンスインディケーターです。 このインディケーターは、流動性に基づく重要なサポート・レジスタンスゾーンをチャート上に自動的に描画し、上位タイムフレームのレベルが重なり合う強力なコンフルエンスゾーンを強調します。これらの融合ゾーンは、価格が反発・反転・または強い継続を見せる可能性が高い機関投資家の反応エリアとして機能します。 Institutional Fusion Levelsは、水平線を手動で引くことなく重要な市場レベルを素早く把握できるため、デイトレーダー、スイングトレーダー、スマートマネートレーダー、機関投資家スタイルの戦略に最適です。 特徴 • 以下のレベルを自動描画: 前日高値(PDH) 前日安値(PDL) 前週高値(PWH) 前週安値(PWL

Apex Divergence Pro MT5 は、一般的なダイバージェンスシグナル以上のものを求めるトレーダーのために開発された、プロフェッショナル向けの反転系インジケーターです。 このインジケーターは、高度なダイバージェンス検出と、多層的なマーケットコンテキストフィルターを組み合わせています。これには、トレンド方向、上位足での確認、そして重要な需要・供給ゾーンの分析が含まれます。これにより、弱く孤立したシグナルではなく、より質の高い反転セットアップに集中することができます。 Apex Divergence Pro は、より構造的なエントリー、より明確な市場認識、そして反転トレードにおけるよりプロフェッショナルなアプローチを求めるトレーダーのために設計されました。 主な特長 • コンテキストフィルター付きの高度なダイバージェンス検出
• 蓄積ゾーンと操作ゾーンを可視化する PO3(Power of 3)表示機能
• 3つの最適化モード:Gold、Majors、Scalping
• Take Profit と Stop Loss の自動計算
• 重要な取引統計を表示するリアルタイムダッ

Smart Imbalance Edge: Decode Institutional Footprints and Market Momentum
The market doesn't move randomly. Its direction and structural shifts are driven by major players—institutional capital, banks, and hedge funds. Smart Imbalance Edge is an advanced, analytical MetaTrader 5 tool designed to help you spot these institutional footprints and measure the true force behind their actions. This isn't just another standard "ZigZag" indicator that blindly connects highs and lows. This algorithm sc

Well, I share this indicator that i'm using for myself. it clearly shows your trading performance in a month. i charge for a cup of beer, but here min 30 usd, so 3 cups. it is not a complecated one, but easy to use and clear. you can also make one yourself, or, pay a little for your time and convenience. have a nice trading day, cheers!
WOW, min 300 characters,,,,,,,,, OK, u dont have to reand the following, i'm tring to reach 300 characters for it.

PIPSBEE DECIDER INDICATOR Multi-Currency Trend & Level Identification System Built with professional market experience, PipsBee Decider is a powerful MetaTrader 5 indicator designed to help traders identify important market levels, trend direction, and potential reaction zones across multiple symbols and timeframes. This indicator is created for traders who want clear structure, accurate levels, and better decision-making without confusion. WHY PIPSBEE DECIDER IS DIFFERENT PipsBee Decider is not

EMA ATR Breakout Indicator for MT5 The EMA ATR Breakout Indicator identifies momentum breakouts by combining ATR-based volatility bands with an EMA trend filter. The goal is to reduce low-quality signals during consolidation and highlight only those breakouts where volatility expansion and trend direction align. How It Works The indicator plots adaptive breakout bands derived from Average True Range, centered on a configurable moving average. When price closes beyond a band, the indicator checks

MTF MA Color Candles Alert helps traders read moving-average context faster by replacing regular candles with four customizable candle colors.
The indicator can use the current timeframe or a selected higher timeframe moving average. For example, a trader can view M5 price action while coloring the candles from an H1 or H4 moving average condition.
Main features: - Multi-timeframe MA source: current, M5, M15, M30, H1, H4, D1, and W1 - Moving average period, method, and applied price are adjus

MACD intel Professional MACD Oscillator with Adaptive Noise Filtering and Divergence Detection The Problem MACD intel Solves Trader Question How MACD intel Answers "Is this crossover real or just market noise?" Adaptive Dead Zone filters out false signals. Grey histogram = noise zone. Only decisive moves generate arrows. "Should I follow the trend or fade the move?" 3-Mode Zero-Line Filter lets you switch between TREND (follow momentum) and REVERSION (fade extremes) with one click. "Why di

Phantom Quant Momentum
AI-Inspired 6-Agent Scoring Indicator with Buy/Sell Arrows for MetaTrader 5
Tired of simple moving-average crossovers that give too many false signals? Phantom Quant Momentum- is a next-generation indicator built on quantitative logic originally designed for institutional AI trading systems.
Instead of relying on a single indicator, this system runs 6 independent scoring agents- simultaneously — each analyzing a different dimension of the market. Only when the majority

週足・日足OHLCレベル ― 重要な価格帯を見逃すことはもうありません 市場の反応を推測する必要はもうありません。このインジケーターは、機関投資家、銀行、そしてスマートマネーが毎日注目する最も重要な価格帯を、チャート上に自動的に表示します。手動操作は一切不要です。
機能 チャートを開くたびに、以下の情報がすぐに表示されます。
4つの週足レベル ― 前週の始値、終値、高値、安値 4つの日足レベル ― 前日の始値、終値、高値、安値 色分けによる分かりやすさ ― 週足は青、日足は白で表示されるため、常に何を見ているのかが一目でわかります。 明確な価格ラベル ― 各レベルには、チャート上に正確な価格が表示されます。
これらのレベルが重要な理由 前週と前日のOHLCレベルは、プロのトレーダーが最も注目する価格帯の一つです。銀行や機関投資家は、これらのレベル付近で注文を出します。価格は頻繁に以下のパターンを示します。
前週/前日の高値と安値で反転する 前日の始値と終値付近で横ばいになる これらの水準を突破し、再びテストしてから上昇を続ける
FX、金、指数、仮想通貨など、どの市場を取

Buy Sell Trend Indicator Clean Signals. Smarter Trend Detection. Buy Sell Trend Indicator is a trend-following tool designed to help traders identify market direction, potential reversals, and high-probability Buy & Sell opportunities using clear visual signals and structured trend logic. Built with ATR-based trend analysis and optional ADX confirmation, the indicator focuses on filtering weak signals and improving accuracy in dynamic market conditions. It automatically plots trend lines, Buy/S

ボリュームデルタスキャナーMT5
Volume Delta Scannerは、MetaTrader 5用のリアルタイム市場スキャンインジケーターで、単一のパネルから複数の銘柄と時間枠を同時に監視します。チャートを手動で切り替える代わりに、ウォッチリスト全体の買い圧力と売り圧力を一目で把握できます。
このインジケーターはボリュームデルタロジックに基づいて構築されています。ローソク足の構造とティックボリュームに基づいて買い圧力と売り圧力の差を計算し、監視対象として選択したすべてのシンボルと時間枠における市場の支配力を直接的かつフィルターなしで表示します。
パネルに表示される内容
パネルには、シンボルが一覧表示された見やすい表が表示されます。各行には、シンボル名、2つのシグナル列、5つの時間枠列が含まれます。
各セルは、次の3つの状態のうちの1つを示します。 緑の三角形 ― 買い圧力が優勢 赤い三角形 — 売り圧力が優勢 — 中立ダッシュ — 明確な優位性はなく、市場は均衡している
Mコラム ― 市場バイアスフィルター
M列は、金や主要金融商品における長年の実取引経験に基

This indicator automatically identifies strong market zones and displays only high-probability BUY and SELL signals. The indicator filters weak signals, analyzes swing points and zone strength to provide the highest-quality entry opportunities. Suitable for the following instruments:
• XAUUSD
• EURUSD
• GBPUSD
• USDJPY
• BTCUSD
• NAS100
• US30 Indicator Advantages:
• Not an ordinary indicator — built with Smart Money logic
• Filters weak market noise
• Very few fake signals
• High potential fo

Dragon Trend System v3 — 10-Factor Trend Scoring with Built-In Entry Signals Stop relying on a single indicator to judge the trend. The Dragon Trend System scores 10 independent market dimensions and only generates entry signals when the combined score crosses your chosen threshold. Every signal includes DiNapoli Fibonacci TP targets and automatic SL placement. Version 3 is a complete rebuild — one self-contained indicator replaces the old two-indicator setup. No more running separate Trend and

This indicator is engineered to solve one of the most frustrating challenges in institutional trading: the "premature entry" trap. Often, a standard supply or demand zone appears valid on a higher timeframe, but in reality, it acts as early liquidity —a magnet for price to sweep through before finding a true reversal point. The Problem: Early Liquidity In traditional Smart Money Concepts (SMC), a "Regular Zone" is often too broad. Because the zone covers a wide price range, your stop loss must b

**** **ZoneTrader v1.0** **大陽線ゾーン & レンジ極値検出システム** **for XAUUSD (Gold)** ****
### **【製品概要】** ZoneTrader v1.0は、**XAUUSD(金)**専用のプライスアクションゾーン検出インジケーターです。 主に **M15・M30** で使用するよう設計され、強力な動きが生まれた瞬間に「 institutional order blocks 」となるゾーンを自動検出します。
大きな動きの後、価格はほぼ必ずそのエリアに戻ってきます——その法則を純粋に捉えた、**シンプルで高精度なゾーンインジケーター**です。
**・完全ノーリペイント** **・信号は常に確定足(closed candle)で発生** **・トレンドフォロー

Mtf Market Structure Color Candles Alert is a MetaTrader 5 indicator for traders who use multi-timeframe market structure in their chart reading. The indicator draws selected-timeframe structure references on the execution chart and colors the current-chart candles only when price confirms a structure condition. It is designed to help traders separate trend continuation, possible trend change, and neutral range conditions. Version 1.31 includes: Confirmation mode: execution-chart close or fully

GDS Renko Structure Free Renko Structure Indicator for MetaTrader 5 GDS Renko Structure is a free MetaTrader 5 indicator for traders who use Renko charts and want a clearer way to read market structure, movement phases and brick-based behavior. The indicator helps visualize how Renko structure is forming on the chart: movement legs, pauses, continuation areas, pullback behavior and structural shifts. It does not give buy or sell signals. It does not predict price movement. It is a visual context

Smart MW Pattern Dual ATR System Elevate your trading with a professional-grade Price Action system designed to identify high-probability M-shaped (Double Top) and W-shaped (Double Bottom) patterns. Unlike basic indicators, the Smart MW Pattern Dual ATR System provides a complete trading framework, integrating entry signals with a sophisticated two-stage risk management system. Core Logic: This indicator detects market turning points by identifying classic M and W price structures. T

Crypto_Forex MT5用インジケーター「 Evening Starパターン 」。リペイントなし、遅延なし。 - インジケーター「Evening Starパターン」は、プライスアクショントレードに非常に効果的なツールで、下降トレンドの市場に最適です。 - インジケーターはチャート上で弱気のEvening Starパターンを検出します。チャート上に赤い矢印シグナルが表示されます(画像参照)。 - PCとモバイルの両方でアラート機能付き。 - 兄弟機種である強気の「Morning Starパターン」インジケーターも利用可能です(下記リンクを参照)。 - インジケーター「Evening Starパターン」は、サポート/レジスタンスレベルと組み合わせるのに最適です。 高品質のトレーディングロボットとインジケーターをご覧になるにはここをクリックしてください! これは、このMQL5ウェブサイトでのみ提供されるオリジナル製品です。

Wait for clean candle-close break confirmations without staring at the chart. Bar Break Alerter monitors selected long-side or short-side break confirmations directly from the chart. Activate the alert at a planned setup area, step away from the screen, and get notified when the chosen break signal appears. No constant chart watching. No early FOMO entries before confirmation. Only clean break alerts when the selected condition is actually triggered.
Built for Traders Who Want To: Wait for can

GDS Renko Conscience - Renko Decision Awareness Indicator for MetaTrader 5 GDS Renko Conscience is a free Renko decision-awareness indicator for MetaTrader 5. It helps traders slow down and review the current Renko context before making manual trading decisions. This tool is not a signal indicator and does not tell you when to buy or sell. Its purpose is to support discipline, context review and risk awareness during Renko chart analysis. Golden Delta | Algo Trading Research
Updates, research a

GDS Renko Ghost Free Renko Market Memory Visualization Indicator for MetaTrader 5 GDS Renko Ghost is a free MetaTrader 5 indicator for traders who use Renko charts and want to study how similar Renko structures behaved in the past. The indicator visualizes historical Renko memory: similar past structures, continuation paths, consensus behavior and uncertainty zones. It does not give buy or sell signals. It does not predict price movement. It is a visual research and context tool for manual Renko
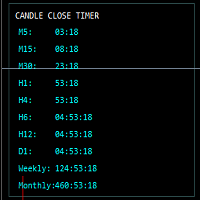
# MT5用マルチタイムフレーム・ローソク足終値タイマー
**マルチタイムフレーム・ローソク足終値タイマー**で市場の一歩先を行きましょう。ローソク足のタイミングと正確なエントリーを重視するトレーダーのために設計された、洗練された強力なMetaTrader 5インジケーターです。
このインジケーターは、複数のタイムフレームのリアルタイムカウントダウンタイマーを同時に表示し、チャートを切り替えることなく各ローソク足の終値を正確に追跡できます。
## 機能
* ローソク足の終値カウントダウンをリアルタイムで表示 * 複数の時間足に対応:
* M5
* M15
* M30
* H1
* H4
* H6
* H12
* 日足 * 週足 * 月足 * シンプルで軽量なチャート表示 * 色分けされた警告システム:
* 通常カウントダウン * 警告モード * 重要な最終秒 * ローソク足の終値前にプッシュ通知とポップアップアラートを表示 * 完全カスタマイズ可能:
* 色
* フォント * パネルの位置 * アラートのタイミング * CPU使用率を低く抑えるよう最

MACD Multi-Dimensional (MACD intel MTF) Professional MACD Oscillator with Adaptive Noise Filtering, Divergence Detection & Multi-Timeframe Confirmation The Problem MACD intel MTF Solves Trader Question How MACD intel MTF Answers "Is this crossover real or just market noise?" Adaptive Dead Zone filters out false signals. Grey histogram = noise zone. Only decisive moves generate arrows. "Should I follow the trend or fade the move?" 3-Mode Zero-Line Filter lets you switch between TREND (follow mom

# MT5用スクイーズ・モメンタム・インジケーター
MetaTrader 5向けにプロが開発した強力な**スクイーズ・モメンタム・インジケーター**で、爆発的な市場チャンスを掴みましょう。
この高度なボラティリティ・モメンタム・インジケーターは、トレーダーが大きな市場変動が起こる前の低ボラティリティ期間を特定するのに役立ちます。ボリンジャーバンドとケルトナーチャネルの強みを組み合わせたこのインジケーターは、市場が「スクイーズ」状態にあり、ブレイクアウトの準備をしているタイミングを明らかにします。
内蔵のモメンタム・ヒストグラムにより、トレンドの方向とモメンタムの変化を容易に把握でき、トレーダーは自信と精度を持ってトレードを行うことができます。
## 機能
* 高度なスクイーズ検出システム * プロフェッショナルなMT5実装 * 急激なブレイクアウト前にボラティリティスクイーズを検出 * 動的な色変化を伴うモメンタムヒストグラム * 市場状況を容易に把握できるスクイーズステータスドット * 以下の指標を組み合わせ:
* ボリンジャーバンド
* ケルトナーチャネル * 線

SEASONALITY ASSISTANT Understand Market Tendencies More Clearly Seasonality Assistant is a simple trading tool that helps identify the seasonal tendency of the market for each month based on historical price behavior. The indicator classifies market conditions into two categories: TREND → Price tends to move with directional momentum during the month.
This does not mean the market will always move up or always move down.
It simply means the market historically tends to develop a clearer directio

**Full Description (paste-ready)** Forex Warrior Trend Signal Guide is a signal indicator for forex traders who want structured trade guidance without automated execution.
The indicator analyzes each configured pair and displays a live dashboard with: - BUY, SELL, or NEUTRAL signal blocks - Breakout confirmation - Pattern detection and confidence - ADX, RSI, and ATR context - Multi-pair table for fast comparison
Core logic combines: - EMA trend structure - MACD directional confirmation - Brea

MT5用ボラティリティメーター ― 高度なリアルタイム市場ボラティリティダッシュボード
MetaTrader 5向けに、生のATRデータを強力なビジュアルボラティリティ分析システムに変換します。
MT5用ボラティリティメーターは、取引開始前に市場の静穏、活発、高リスク、そして急激な変動といった状況を瞬時に把握したいトレーダーのために設計された、プロ仕様のボラティリティ分析インジケーターです。
高度なATR比較ロジック、過去のボラティリティ分析、そしてインテリジェントなアラートシステムを搭載したこのツールは、トレーダーにチャート上で市場の動向をリアルタイムで表示します。
主な機能 リアルタイムボラティリティダッシュボード
洗練されたモダンなチャートパネルには、以下の情報が表示されます。
現在のATRボラティリティ 長期ベースラインATR ボラティリティ比率比較 過去の最大ATR リアルタイム市場状況
すべての情報はリアルタイムで自動的に更新されます。
スマートなボラティリティ検出
このインジケーターは、短期ATRと長期ATRの平均値を比較し、以下の状態を検出します。

MT5用Standard Deviation Channel 4x
MetaTrader 5用Standard Deviation Channel 4xで、チャートをプロの機関投資家向けトレーディングワークスペースへと変革しましょう。 この高度なインジケーターは、ダイナミック回帰チャネル、マルチレベルボラティリティゾーン、カスタマイズ可能な移動平均線、そして強力な上位時間足のサポート/レジスタンスレベルを、すべて1つの洗練されたカスタマイズ可能なツールに統合しています。
トレンドの方向性、ボラティリティの拡大、プレミアム/ディスカウントゾーン、そして高確率の反転エリアを正確に特定したいトレーダーに最適です。
主な機能 高度な標準偏差チャネル スマートな線形回帰トレンドチャネルを自動的にプロット 価格の上下最大4段階の偏差レベルを設定 ボラティリティの拡大と過熱した市場状況を検出 将来予測のためのチャネルの左右拡張オプション リアルタイムのトレンド傾斜分析 マルチレベルボラティリティゾーン +1 / -1偏差 +2 / -2偏差 +3 / -3偏差 +4 / -4偏差
以下の項

Institutional Liquidity & Footprint Indicator
This indicator is designed for traders who want to identify high-probability setups with institutional-level precision—without the complexity. What It Does:
This MT5 indicator combines liquidity zone detection with volume footprint analysis to reveal where institutional players are actively positioning. It automatically identifies key supply and demand areas, filters market noise, and highlights only the setups that matter. Key Features:
High-Pr

Thrust Map Real-Time Indicator Unlike standard Volume Profiles that aggregate tick counts by price level, this indicator tracks the number of candles that fall within each level's range. The profile accumulates data only from the moment of launch and categorizes it into Buy and Sell by analyzing the direction of every tick. It does not repaint. The indicator displays vertical and horizontal levels where the price travels the "greatest distance with the fewest actions" (on average per candle). In

Crypto_Forexインジケーター「 RVI Speed 」(MT5用、リペイント機能なし) - このインジケーターの計算は物理学の方程式に基づいています。RVI SpeedはRVI自体の1階微分です。 - Relative_Vigor_Index(RVI)自体は、トレンド相場で非常に有用なテクニカルモメンタムインジケーターです。 - RVI Speedは、価格調整後に主要トレンドの方向へモメンタムエントリーする際に有効です。 - 適切なトレンドインジケーター、例えば標準EMA(画像参照)と組み合わせて使用してください。 - RVI Speedインジケーターは、RVI自体の方向転換の速さを示します。非常に敏感です。 - RVI Speedインジケーターの値が0未満の場合、速度は負です。値が0を超える場合、速度は正です。 - インジケーターにはモバイルとPCのアラートが組み込まれています。 高品質のトレーディングロボットとインジケーターをご覧になるにはここをクリックしてください! これは、このMQL5ウェブサイトでのみ提供されるオリジナル製品です。

Smart Flow Trade uses an advanced intelligent ABCD pattern to identify high-probability trade setups. The indicator provides clear entry signals with candlestick color-change confirmation to help traders enter the market with confidence. It also displays: Entry point Take Profit (TP) levels Stop Loss (SL) making risk management simple and effective. This indicator is designed for intraday traders, swing traders, and beginners , as it clearly shows the overall market direction and possible trade

AlgoEdge — Stop Chasing Every Move Most traders don’t lose because they lack indicators.
They lose because their charts constantly pull them into bad decisions. Fake breakouts.
Late entries.
Overtrading.
Conflicting signals.
Momentum traps. After a few losses, hesitation starts creeping in — and suddenly the real move happens without you. AlgoEdge was built to reduce that noise. Instead of flooding your chart with endless confirmations, AlgoEdge focuses on identifying shifts in market pressure a

Prop Session Risk Guard MT5 は、アクティブな市場セッション中に統合されたリスク認識を備えた、より明確なエントリーおよび出口ガイダンスを必要とする手動トレーダー向けに設計された、MetaTrader 5 用のセッションベースのシグナルインジケーターです。このプロフェッショナルツールは、確認済みの売買矢印、テイクプロフィット/ストップロスの予測、セッションタイミングフィルター、スプレッド監視、および明確なチャート上ダッシュボードを統合し、規律ある取引決定をサポートします。 コア機能 このインジケーターは、市場状況を読み、低品質のセットアップをフィルタリングし、強化された構造で取引を計画するのに役立つ手動取引アシスタントとして機能します。これは自動取引ロボットではなく、適切なセッションおよびリスクコンテキスト内でのみシグナルを表示する視覚的確認ツールであり、より選択的で情報に基づいた取引決定を可能にします。 主要機能 手動取引確認のための売買シグナル矢印 エントリータイミングの改善のためのセッションベースの市場フィルタリング(アジア、ロンドン、ニューヨークセッシ

Volume Profile by Trading Session — Visualize where price spent its time and where the smart money traded, automatically segmented by Sydney, Tokyo, London, or New York sessions. What is Market Volume Profile? Market Volume Profile (MVP) is a professional-grade Volume Profile indicator built for traders who think in sessions, not just candles . While most volume tools show you a single profile across an arbitrary range, MVP automatically segments your chart by the four major Forex session

Obsidain Queen - AI Trend Signal Indicator
Obsidain Queen is a premium AI-inspired trading indicator designed to support trend analysis, signal confirmation, and disciplined market entry decisions.
The indicator focuses on identifying market direction, potential entry zones, and trend strength. It is created to help traders make more structured decisions instead of relying on emotion or random entries.
Obsidain Queen can be used for Forex, Gold, indices, and other major CFD markets, dependin

Crypto_Forex インジケーター HTF MFI オシレーター(MT5 対応) - マネーフローインデックス(MFI)は、価格と出来高データを用いて売られ過ぎと買われ過ぎのゾーンを特定するテクニカルオシレーターです。 - HTF とは、より長い時間軸を意味します。MFI が 80 を超えると買われ過ぎ、20 を下回ると売られ過ぎとなります。 - MFI はプライスアクションシグナルと組み合わせるのに最適です。強気と弱気の価格モメンタムに関する情報を提供します。 - このインジケーターは、他のインジケーターと組み合わせてマルチタイムフレーム取引システムに最適です。 - HTF MFI インジケーターを使用すると、より長い時間軸の MFI を現在のチャートに表示できます。 - インジケーターには、モバイルと PC の両方でアラートが利用できます。 高品質のトレーディングロボットとインジケーターをご覧になるにはここをクリックしてください! これは、この MQL5 ウェブサイトでのみ提供されるオリジナル製品です。

"QuickLineAlert" – Smart and Fast Price Level Indicator (MT5) "QuickLineAlert" is a tool designed for the MetaTrader 5 platform, created to maximize the speed and simplify the marking of price levels. It is perfectly suited for active traders (especially scalpers and day traders) who need to react instantly to market changes without long and tedious setups. You just press a button, place a line, and let the indicator do its job. Main Advantages: Fully Automated (No Need to Choose Direction) U

GDS Renko Pulse - Renko Market Activity Indicator for MetaTrader 5 GDS Renko Pulse is a free Renko market activity indicator for MetaTrader 5. It helps traders observe the current rhythm, pressure, activity and cleanliness of Renko movement directly on the chart. This indicator does not predict the market and does not generate buy or sell signals. Its purpose is to help you understand whether the current Renko environment is active, slow, clean, unstable, compressed or losing rhythm. Renko EDGE

Stop relying on a single oscillator to trade reversals! Divergence Pro is a professional-grade analytical tool designed to find high-probability reversal points through... confluence of 11 powerful oscillators . Instead of entering false signals from an isolated RSI or MACD, Divergence Pro tracks the market and only displays opportunities when multiple indicators agree on the same divergence simultaneously. It filters out market noise and delivers only the best opportunities.

VGRSI — Visibility Graphs Relative Strength Index is a technical indicator for MetaTrader 5 based on the concept of visibility graphs applied to financial time series. Unlike classical oscillators that mainly use local price changes, VGRSI analyses the geometric structure of price movement. It detects selected past points that remain “visible” from the current price in the time–price plane and uses them to estimate the relative strength of upward and downward movements. The indicator is scaled t
MetaTraderマーケットは自動売買ロボットとテクニカル指標を販売するための最もいい場所です。
魅力的なデザインと説明を備えたMetaTraderプラットフォーム用アプリを開発するだけでいいのです。マーケットでプロダクトをパブリッシュして何百万ものMetaTraderユーザーに提供する方法をご覧ください。

取引の機会を逃しています。
- 無料取引アプリ
- 8千を超えるシグナルをコピー
- 金融ニュースで金融マーケットを探索