 MetaTrader 5
 エキスパート
 インディケータ
 ライブラリ
ライブラリ
 ユーティリティ
 ウィジェット
 ルール
ルール
YouTubeにあるマーケットチュートリアルビデオをご覧ください
ロボットや指標を購入する
仮想ホスティングで
EAを実行
EAを実行
ロボットや指標を購入前にテストする
マーケットで収入を得る
販売のためにプロダクトをプレゼンテーションする方法
MetaTrader 4のための新しいエキスパートアドバイザーとインディケータ - 343
 自動売買ロボットは市場取引を自動的に実行しますが、インジケータを使用すると、相場をより適切に分析し、価格行動を予測できます。
これらのアプリケーションを使用すると、より多くの機会を獲得しながら、より多くの情報に基づいた方法でMetaTrader4で取引を実行できるようになります。
自動売買ロボットは市場取引を自動的に実行しますが、インジケータを使用すると、相場をより適切に分析し、価格行動を予測できます。
これらのアプリケーションを使用すると、より多くの機会を獲得しながら、より多くの情報に基づいた方法でMetaTrader4で取引を実行できるようになります。 
Unlimited Trade Copier Pro is a tool to copy trade remotely to multiple MT4, MT5 and cTrader accounts at different computers/locations over internet. This is an ideal solution for you if you are a signal provider and want to copy your trades to other receivers globally on your own rules. One provider can copy trades to multiple receivers and one receiver can get trade from multiple providers as well. The provider can even set the subscription expiry for each receiver, so that receiver will not b

Prometheus Smart Money is an indicator that combines both price & volume with calculations based on other custom indicators, smart volume and retail volume to create this leading indicator that gives you high probability moves to help you make a decision on what is MOST likely to happen in the market going forward Advantages You can use it in ALL financial markets including binary options on ALL asset classes or instruments. You can use it as a stand alone indicator or as a confirmation tool wit

Tick Advisor is an intraday trading system that tries to profit during the price rollback. Martingale can be enabled, but you should be extremely careful (take profit often and at a proper time!). You can examine the Expert Advisor's trading statistics for different brokers and symbols in the MetaTrader 4 Trading Signals sections.
Parameters Risk management: enter volume - a volume for entry If the value is greater than 0 - number of lots, if less than 0 - percentage of available funds, if equa
如果产品有任何问题或者您需要在此产品上添加功能,请联系我 Contact/message me if you encounter any issue using the product or need extra feature to add on the base version.
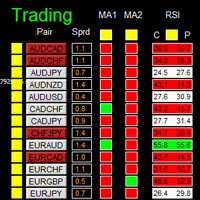
There is Demo version of this panel Dashboard Super MA RSI CCI Demo in my product list, pls try it out to get familiar with all functionalities free . Dashboard Super MA RSI CCI is an intuitive, and handy graphic tool to help you to: Have 28 pairs under control with one dashboard Monitor price movement, identify possible trend based on MA, RSI, and CCI i

Keltner's colored channel indicator, also called STARC band, drawn in an additional chart window for any of the five basic indicators included into the MetaTrader 4 platform. The indicator uses the calculation technique of the three drawing options: basic, improved and modified . The first two were proposed by Keltner, the third one - by a successful trader L. Rakshe. You can search for your own optimal parameters of the indicator. It is also possible to color the upper, middle and lower bands,
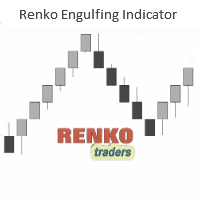
The Renko (and Mean Renko) Engulfing Bar Indicator is a versatile trading indicator that plots Buy/Sell arrows and gives potential trade ideas including buy entry and stop loss levels. The indicator is designed to work on offline renko charts as well as Mean or Median Renko charts. It is recommended to use this indicator on a minimum of 20Pips fixed renko box or more. The indicator does not repaint. It prints the arrows after the bar close. The indicator's buy/sell arrows can be a powerful way t

Unlimited Binary Options Copier Remote is a powerful tool to copy binary options trades remotely between multiple accounts at different locations over internet. This is an ideal solution for signal provider, who want to share his binary options trades with the others globally on his own rules. One provider can copy trades to unlimited receivers and one receiver can get trade from unlimited providers as well. The provider can set the subscription expiry for each receiver, so that receiver will no
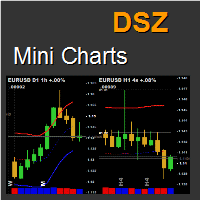
This indicator displays a bar chart for any time period and symbol. It allows to implement "top-down" investment approach. Charts have many features including unique statistical bands, rounded numbers, pivots, the elapsed time count, information about orders, change chart by clicking, saving and loading graphic objects and many others.
Key Futures Up to 9 chart per row. Unlimited number of instances. Symbol and timeframe freely adjustable for every chart. Moving Averages that have a unique meth

Standard ZigZag with added alert, push notifications and email messages on breakout of the last formed HIGH - LOW! It does not consider the current extremum of the ZigZag, that is being redrawn!
Indicator Settings Depth - determines the size of the interval or the number of candles after the previous extremum of the indicator, on which it will not look for a new extremum Deviation - the number of points between the extremums (Lows or Highs) of two adjacent candlesticks to form a local bottom of

インディケータは、最も可能性の高いトレンドストップ/反転エリア、自信のあるトレンド移動エリアを計算します。
計算では次のことが考慮されます。
価格変動率; チャートの相対偏差角度。 価格変動の平均振幅。 その「コンフォートゾーン」を離れる価格。 ATRインジケーターの値。 インジケーターは、価格がストップ/リバーサルエリアに入るとアラートを生成できます。
設定 全長を描きますか? -チャートの最後まで領域を描画します。 Show StopUP-trend-上昇トレンドのストップ/反転エリアを表示します。 上昇トレンドを表示-自信を持って上昇トレンドの領域を表示します。 下降トレンドを表示-自信を持って下降トレンドの領域を表示します。 Show StopDOWN-trend-下降トレンドのストップ/反転エリアを表示します。 エリア変更のアラート-価格がトレンドストップ/変更エリアに入ったときにアラートを生成します。 次は、各商圏の色設定です。
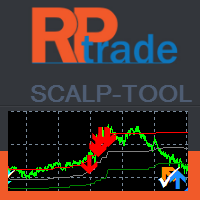
スカルプツールは非常に効率的なカウンタートレンドインジケーターです。
それは誰でも使用できるように設計されており、取引の完全な初心者でも使用できます。 頭皮ツールは再描画しません。 表示は、近いものから近いもの、または近いものから見えるレベルまで示されます。 頭皮ツールは単独で使用でき、他のインジケーターは必要ありません。
頭皮ツールは示します あなたの取引を開く場所。 それらを閉じるとき。 ストップオーダーを出す場所。 ライブテスト中の精度は80%を超えます。
頭皮ツールは機能します FXペア、インデックス、金属、先物などのあらゆる商品で... 任意の時間枠。 どんなブローカーでも。
頭皮ツールの機能 TradeType Wise:リスクと説明を制限するために簡単な取引を行います。矢印はいつ停止するかを示します。 TradeType Medium:バランスの取れたプロファイルで、中程度の長さのトレードでより多くのピップを生成します。停止は灰色の帯と矢印で示されます。 TradeType Maximum:非常に長いトレードでより多くのピップを生成します。停止は、緑と赤の

The Expert Advisor uses a strategy based on breakthrough and two additional strategies based on sharp price changes. You can adjust the slope of the breakthrough, the distance between the breakthrough levels and the number of breakthrough levels. The Expert Advisor itself marks the levels that should be broken through. The EA includes two strategies based on sharp price changes: that is the EA opens pending Sell Stop and Buy Stop orders in case of a sudden price change in any direction and close

The indicator displays Renko bars on the chart, plots two moving averages by them and generates buy/sell signals based on the conditions displayed in the screenshots and described below: the buy signal is formed if the fast moving average is above the slow moving average, from 4 to 10 consecutive bullish Renko bars are displayed, followed by no more than 2 bearish and one bullish Renko bars; the sell signal is formed if the fast moving average is below the slow moving average, from 4 to 10 conse
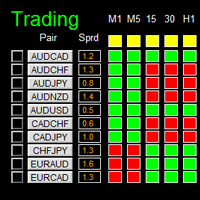
如果产品有任何问题或者您需要在此产品上添加功能,请联系我 Contact/message me if you encounter any issue using the product or need extra feature to add on the base version.
Dashboard Super Candle is an intuitive, and handy graphic tool to help you to: Have 28 pairs under control with one dashboard. Monitor candle direction, identify possible price movement and trend. Provide trading signals based on the candle direction selected by you. Automatically manage order once signal are generated. Have the ability to select which p
EMA Cross Alert is a signal indicator based on exponential moving average crossover. It will alert signal with audio or pop up on chart when 2 periods EMA cross above/below for Buy/Sell. It easy use. Help to your system trading. You can customize period of EMA for crossing alert signal, if you want. And You can ON/OFF audio alert. Indicator can use every currency pairs and every broker.
Features Period1: Short moving averages Period2: Long moving averages Audible_Alerts : ON/OFF audio alert on

Mean Reversion Supply Demand Indicator Mean Reversion Supply Demand is the indicator to detect the important supply demand zone in your chart. The concept of supply demand trading relies on the quantity mismatching between buying and selling volumes in the financial market. Typically, supply demand zone serves to predict the turning point. The wave pattern, for any supply demand zone to work as an successful trade, looks like the price must touch the base zone, move away and then return to zone

This indicator is based on Market Profile methodology, which contains the Z-Zone , unlike the latter, allows visualization of multiple time frames on the same graph. This methodology has proven to be very effective for: Reduce the number of windows required to analyze or track a financial asset. Display important resistance areas (ROZ), support (SoZ) and average distribution (PoC) in different periods of time. Define areas to take profits as well locate technical stop loss. Analysis in the devel

The Navigator is a next-generation panel very easy to use. Apply this indicator on the chart to navigate very quickly through all the symbol and timeframes listed in input. The arrows manage the zoom and time frames. You can customize both the graphic colors and the list of symbols to display. A quick and easy tool that it will help to analyse the charts.
Input Values Show_TF_Panel (true/false) it permits to show/hide panel with TF and Arrows
32 symbols COLORS AND SIZE SETTINGS BUTTON_WIDTH But

Expert Advisor designed for news trading. The news are downloaded from the Forex Factory, Investing.com, myfxbook.com websites. Make sure to add the URL to the terminal settings. The EA should be attached to each currency chart. In the Symbol News field, set the currency symbol for searching news in the calendar. Example: if the EA is attached to the AUDUSD chart, set Symbol News to AUD; if USDCAD, Symbol News - CAD, XAUUSD Symbol News - USD, and so on. Change the magic number for each chart, an

Pipfinite creates unique, high quality and affordable trading tools. Our tools may or may not work for you, so we strongly suggest to try the Demo Version for MT4 first. Please test the indicator prior to purchasing to determine if it works for you. We want your good reviews, so hurry up and test it for free...we hope you will find it useful.
Combo Channel Flow with Strength Meter Strategy: Increase probability by confirming signals with strength Watch Video: (Click Here)
Features Detects chan
Tipu Parabolic SAR Dashboard is based on the Tipu Parabolic SAR indicator. Please contact me here at MQL5 if you would like to use this panel for your custom signals. Tipu Parabolic SAR Dashboard is a multi-currency, multi-timeframe panel created to help traders in analyzing the markets quickly using the Parabolic SAR indicator signal. The dashboard panel is designed to help traders quickly change symbols and periods. If you are constantly missing trade opportunities while browsing through the
NearONE displays the average value of the price deviation in points for a specified period in a subwindow of a selected trading instrument.
Inputs : DRAWs - number of bars to display the indicator; NearPeriod - indicator period.
If NearPeriod is 0 , recommended periods are used for each chart timeframe.
If NearPeriod = 0: M1 timeframe - period = 60 ; M5 timeframe - period = 48 ; M15 timeframe - period = 96 ; M30 timeframe - period = 192 ; H1 timeframe - period = 96 ; H4 timeframe - period = 3
FREE

The Illusion EA uses the probability theory - after a series of consecutive virtual losses - i.e. right during a flat the EA already starts trading in the trend. In addition, the EA considers the ratio of bullish/bearish candles on the higher timeframes to determine the greatest probability of the price movement direction. Only 1 order can be opened at a time. In case of a loss the following order will be placed with an increased lot (the multiplication coefficient is set in the parameters). The

The library is dedicated to help manage your trades, calculate lot, trailing, partial close and other functions
Orders CloseallSell CloseallBuy CloseallOpen DeletePending DeleteAll: Close All Market Orders and delete all pending orders. CheckOpenBuyOrders: return the count of buy orders. CheckOpenSellOrders: return the count of sell orders. CheckOpenOrders: return the count of market orders. ModifyOrder DeleteOrder CloseOrder OpenOrder
Lot Calculation Mode 0: Fixed Lot. Mode 1: Martingale Lot
Automatic lot calculation per stop level: calculates the lot considering the risk. It is possible to enter a percentage of the deposit and set the line to the planned stop level. As a result, the lot for entry will be calculated. Also, the TakeProfit level will be calculated taking into account the profit/loss ratio, and their profit/loss in the deposit currency. Thus, the final result of the trade can be seen, which is an integral part of successful trading.
Features The indicator displays the
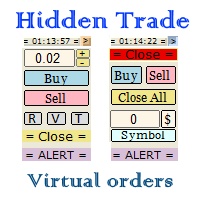
Small trading panel for managing orders and positions in 1 click for MetaTrader 4 Version for MetaTrader 5 here Set hidden TakeProfit, StopLoss and pending orders at lines placed on the chart Work on time on the news Backtesting manual strategies in the tester Placing virtual orders Playing a sound signal when the price reaches a level Automatic closing of all positions on the account or symbol by the total take profit in the deposit currency
Description Can be dragged to any part of the chart

Taranus is a multifunctional EA, a universal assistant to a trader, designed to work under the control of a trader. The EA has a large set of tools and can work: by indicators, by trading levels, by trend lines, by martingale strategy, trade on news. It has: several filters to determine the trend, a multi-level risk management system, money management, virtual stop loss, universal trailing stop, can work with any type of orders. Set files and a guide to the Taranus EA can be found in the "Commen

A simplistic indicator informing a user on RSI divergence by sending messages to mobile device and email. The indicator draws 2 vertical lines, marking two RSI extrema that formed the divergence. You get the alert, open the charts and make a decision. The indicator does not show past divergences, thus when you attach it to a chart for the first time you see nothing. Graphics and alerts will appear as soon as divergences do. Drop it in Tester to see how it works. Parameters: RSIPeriod - number of
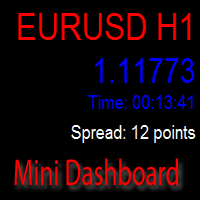
The indicator displays information about:
the name of the currency pair and timeframe. current price bid. time before the close of the candle. the current difference between the ask and bid (spread). Trading volume stats can also be displayed.
Displayed data
Name, account number, and account currency. A deposit in the account currency. Balance at the current time and a percentage of the balance. Current profit and its percentage. Current transaction and the percentage of the total deposit. Pr
FREE
Volume Levels is a very important indicator for exchange trading. Most of the trades were performed on those levels. This indicator displays the price level that had the most trade volumes over a certain period of time. Often, the price bounces from those levels in the future, and it can be successfully used in trading. This is a demo version that works only on the USD/JPY currency pair. To work on all currency pairs, install the full version: https://www.mql5.com/en/market/product/15888
Parame
FREE

The EA detects strong movements using the Parabolic indicator and opens a trade. The Commodity Channel Index (CCI) is used as an auxiliary indicator. The CCI levels may depend on the ADX indicator values, which allows for better trading with different volatility. Also, the trades are opened depending on the RSI indicator values on a certain timeframe. Recommended timeframes: M5, M15, M30. Make sure to optimize the parameters of the EA for your account before trading.
Input Parameters Lots - lot
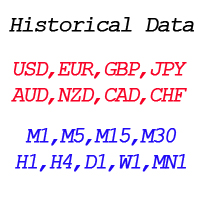
By applying this expert onto any char window, you are able to force download the historical data upon all time-frame (PERIOD_M1, PERIOD_M5, PERIOD_M15, PERIOD_M30, PERIOD_H1, PERIOD_H4, PERIOD_D1, PERIOD_W1, PERIOD_MN1) of 28 major pairs. The 28 major pairs are the combination of the 8 major currencies.
8 major currencies "USD", "EUR", "GBP", "JPY", "AUD", "NZD", "CAD", "CHF"
28 pairs "AUDCAD","AUDCHF","AUDJPY","AUDNZD","AUDUSD","CADCHF","CADJPY" "CHFJPY","EURAUD","EURCAD","EURCHF","EURGBP","E
FREE
通貨ペアの相関と発散の指標-同じ価格チャート上のすべてのペア。ターミナルで開いているすべてのペアを表示します。
MT5バージョン
利点 マルチ通貨取引戦略を使用しているトレーダーは、同じ価格チャートで選択したペアの価格変動を視覚的に観察して、変動のパラメーターを比較できます。これは、OverLayチャートインジケーターの高度な拡張バージョンです。
これは、多通貨取引のかなり効果的なアシスタントです。「ペア取引」と「ポートフォリオ取引」は、今後の動きを事前に判断するのに役立ちます。
この手法は2つの戦略に要約されます。最初の戦略は、重要なニュースリリース後またはトレーディングフロアの開設時に通貨ペア間の不一致を見つけるように設計されています。そのような作業の論理は非常に単純であり、市場の「嵐」が収まった後、商品の価格間のデルタが再び収束し始めるという仮定に基づいていますが、強力なサポートと強い抵抗の下で直接購入することを避けるための抵抗レベルと一番下の販売。
サポート/レジスタンスレベルの誤ったブレイクアウトを特定する。
可能性 チャート上の任意のペアを反転します い
Reanimator 半自動取引ロボット。ポジションを開閉するには、ボタンを使用します。ポジションのさらなる追跡は、仮想利益レベルに従って自動的に行われます。ロットを減らしたり増やしたりして不採算ポジションを平均化するシステムも使用されます。ストラテジーテスターのアドバイザのプッシュボタンコントロールは機能しません。アドバイザは、デモまたは実際のアカウントでのみ完全にテストできます。ストラテジーテスターでは、特別な設定OPEN_BUYおよびOPEN_SELLを使用してアドバイザをテストできます。
設定
colorBUY-購入方向の線の色 colorSELL-販売方向の線の色 _width-線幅 MagicNumber-アドバイザーの注文の識別子。ロボットは、そのような番号しかない注文でのみ機能します。 LOT-固定ロットサイズ。 0 MMで動作します(お金の管理) Choice_method-MMメソッド。 true-AccountBalance、false-AccountFreeMargin リスク-MMの金利リスク。 LOT = 0でのみ機能します drawdown_pip-
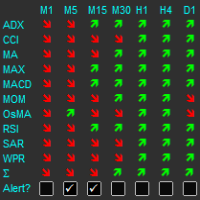
The indicator displays a matrix of indicators across multiple timeframes with a sum total and optional alert. Custom indicators can also be added to the matrix, in a highly configurable way. The alert threshold can be set to say what percentage of indicators need to be in agreement for an alert to happen. The alerts can turned on/off via on chart tick boxes and can be set to notify to mobile or sent to email, in addition to pop-up. The product offers a great way to create an alert when multiple

Free automatic Fibonacci is an indicator that automatically plots a Fibonacci retracement based on the number of bars you select on the BarsToScan setting in the indicator. The Fibonacci is automatically updated in real time as new highest and lowest values appears amongst the selected bars. You can select which level values to be displayed in the indicator settings. You can also select the color of the levels thus enabling the trader to be able to attach the indicator several times with differe
FREE
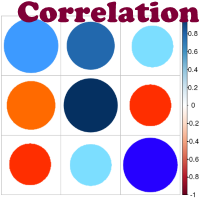
Advantage The analyzer provides an opportunity to examine correlation in history, for example, for the previous month excluding the current one, thus allowing you to evaluate symbol movement in history. It can be conveniently used in conjunction with LineSyncMirrorChart analyzer. Charts are synchronized by a market type: Forex, CFD, Futures, and Indices. The analyzer calculates the distance covered by the price on a specified period in points. The tool fits pairs and portfolio traders.
Descript

The EA Gideon is an Expert Advisor that trades ON NEWS and ON EVENTS that have a strong influence on the market, but do not occur regularly! That is the EA opens Sell Stop and Buy Stop pending orders in case of a sudden price change in any direction and closes them automatically with the profit that you wish. And we all know how often the price changes when a "successful" news appears, how far it can go up or down. Also, this robot protects your deposit by placing SL with customizable parameters

The CCI FIBO trend indicator displays the real sentiment of the market. Does not redraw. The CCI FIBO indicator is based on the processed values of the standard CCI indicator. The indicator is able to display the slowing\reversal of the price during the trend movement (for exiting the position, and with some experience to display the opening in the opposite direction, for example, to use in scalping). It shows spikes in a flat. The idea of the indicator was that there are indicators that are goo
如果产品有任何问题或者您需要在此产品上添加功能,请联系我 Contact/message me if you encounter any issue using the product or need extra feature to add on the base version.
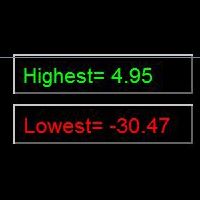
Indicator Floating Highest Lowest provides you an intuitive, and user-friendly method to monitor the floating highest (profit) and lowest (loss) that all your trades together ever arrive. For example, I opened 3 orders, which arrived at $4.71 floating profit when trade following trend. Later when the trend is against me, these 3 orders arrive $30 in loss
FREE
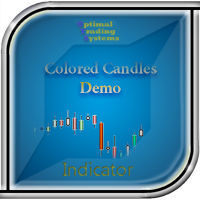
The demo version of the Colored Candles indicator - calculates the parameters of each candle, as well as its volume. After that, it paints the candles depending on their strength and direction. Bullish candles are colored green and bearish candles - red. The greater the power of the bulls or the bears, the brighter the color. You can change the colors if you want. The indicator helps to analyze the price movement, as well as market entry points. The more accurate signals are formed on the higher
FREE
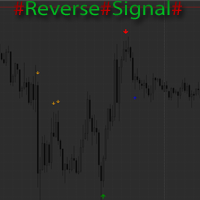
The indicator marks the estimated market reversals in the form of arrows. The indicator is able to detect 3 types of reversals. The primary reversal signal. It is a stronger and more important reversal. Denoted by the largest arrow. Alternative signal - additional signal without additional filters in contrast to the primary. Suitable for scalping on small timeframes. A mixture of the primary and alternate reversals, but with the addition of the trend filter. Also shows good results on small time
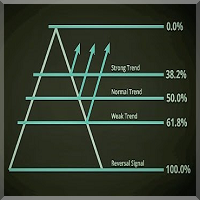
序章 フィボナッチレベルプロフェッショナルインディケータは、他のインディケータを補完するものとして毎日の取引に最適なツールであり、取引設定や市場が移動する傾向がある場所をよりよく確認できます。このインジケーターはセットアップが簡単で、すべての通貨ペアと時間枠で機能します。M15-W1をお勧めします。
この指標の目的は、チャート、日次、上線、下線にフィボナッチレベルを表示することです。追加機能として、このインジケーターはチャートにリトレースラインとエクスパンションラインを描画し、高値、安値、レンジ、スプレッドの日数を示します。フィボナッチレベルプロインジケーターは、前日の高値と安値を使用して、計算された線を描画します。これはすべてのトレーダーにとってなくてはならないツールです! 特徴 セットアップが簡単で、複雑な設定はありません きれいで滑らかなチャートラインと読みやすい すべての通貨ペアと時間枠で機能します フィボナッチラインの調整可能な色設定 調整可能なダッシュボードの色 アカウント情報を含むダッシュボード インジケーターパラメーター UpperFiboColor-上部フィボナッ

Elliott Wave Trend was designed for the scientific wave counting. This tool focuses to get rid of the vagueness of the classic Elliott Wave Counting using the guideline from the template and pattern approach. In doing so, firstly Elliott Wave Trend offers the template for your wave counting. Secondly, it offers Wave Structural Score to assist to identify accurate wave formation. It offers both impulse wave Structural Score and corrective wave Structure Score. Structural Score is the rating to sh

The Z-Compass is part of a suite of four indicators called the Z-Tools Black you can buy separately in the MetaTrader Market. The Z-Compass is one of the most important indicators, because it serves as a compass in the market and is composed of the following elements A histogram and zero line. The histogram is plotted with each candle and changes depending on the selected time frame. When the histogram is above the zero line, we say the trend or momentum is bullish and when it is below the zero
如果产品有任何问题或者您需要在此产品上添加功能,请联系我 Contact/message me if you encounter any issue using the product or need extra feature to add on the base version.
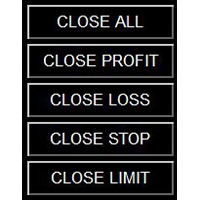
Close Button provides you an intuitive, effective, and handy way to close your orders based on their type. The utility provides seven close options: Close All: close all orders, including trading and pending ones. Close Profit: close all orders which are in profit. Close Loss: close all orders which are in loss. Close Stop: close all stop orders. Close L
FREE

The Z-Beat Zone is part of a suite of four indicators called the Z-Tools Black you can buy separately in the MetaTrader Market. The Z-Beat Zone is displayed as two lines. The main line is called SlowK. The second line, called SlowD. The SlowK line is a solid gross line and the SlowD line is a solid slim line. There are several ways to interpret a Z-Beat Zone. Three popular methods include: Buy when the Z-Beta Zone (The SlowK line) falls below of the level (e.g., -40) and then rises above that le

The Z-Zone is part of a suite of four indicators called the Z-Tools Black you can buy separately in the MetaTrader Market. The Z-Zone is based on the Market Profile and includes three dynamic lines: At the top is the resistance of zone (that we´ll identify as RoZ ) In the center we find the average distribution of the area (that we´ll identify as PoC ) At the bottom is the support of zone (that we´ll identify as SoZ ) Together they make up what we call the value zone, meaning that the market mo

Two Dragon is an advanced indicator for identifying trends, which uses complex mathematical algorithms. It works in any timeframe and symbol. Indicator is designed with the possibility to customize all the parameters according to your requirements. Any feature can be enabled or disabled. When a Buy / Sell trend changes the indicator will notify using notification: Alert, Sound signal, Email, Push. МetaТrader 5 version: https://www.mql5.com/en/market/product/14906 Parameters Max_Bars_History —
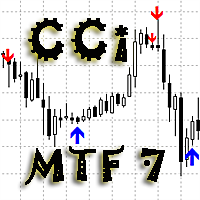
As the proper trading using CCI indicators requires the trader to monitor multiple timeframes and CCI indicators with different periods. For example - monitor the trend using CCI with the period of 100 or 200 ( slow CCI period ) on the H4 timeframe, and make entries based on the CCI with the period of 13 ( fast CCI period ) on the H1 timeframe. To facilitate this task, the Delta CCi MTF7 indicator was created, which implements monitoring the changes of the price movement trends as well as marks

This panel is a part of the SupDem-Pro trading system and is used to search for the best opportunities for any available instruments. Which can be selected manually in the Market Watch (open it with CTRL + M). Using this trading panel in combination with ShvedSupDem-Pro_Zone allows to analyze multiple currency pairs with a single click. The panel allows to load any instruments from the Market Watch, from 6 major currency pairs up to all instruments (480).
The indicator parameters Button Width -
FREE
The Five Minutes Tester indicator is a simple tester for the Five Minutes trading system and the Five Minutes Expert EA based on binary options. Its objective is constructing a balance line on history data and calculation of statistics during CALL and PUT transactions performed by Five Minutes trading system. The tester requires at least 100 bars in history for the EURUSD instrument on the five-minute interval. But, in order to receive reliable statistical data, it requires the bars to be downlo
FREE

Advanced and affordable momentum indicator that fade the fake move of market. It is smoothed because of special sophisticated exponential averaging calculation. It is also similar to special type of CCI with more tolerance to overbought or oversold conditions with built-in momentum indication. This indicator is able to empower your trading as a trend detector, CCI and market momentum scale measurement.
Features Smoothed to filter uncomfortable noises. Non-Lagging Exponential averaging. Line or
The Five Minutes indicator is a ready TRADING SYSTEM for binary options. The system is designed specifically for the EURUSD M5 currency market with at least 80% payout and for trades who operate on the web-terminals and the MetaTrader 4 platform. This is a counter-trend system, i.e. it expects the price of traded asset to reverse. Signals of the system are not redrawn, they appear once the formation of the previous bar is completed, and are equipped with a sound notification. For decision-making

This is a simple and free Expert Advisor that trades candlesticks. It compares several nearest bars and their volumes, and opens a trade based on that data. Unlike the professional version , it analyzes only 1 timeframe. The recommended timeframes for this EA are H1, H4, D1, it works with any currency pairs. The parameters always need to be optimized before trading, as well as after some period of trading.
Input Parameters Lots - lot size (if Lots=0, then the lot will be calculated based on the
FREE

CIS is designed for trading a basket of correlating currencies, as well as single instruments: indicators
VSA indicator which draws arrows (does not redraw). Its signals indicate the price reversal on a calm market or decrease of the rise or fall rate during strong movements. Works fine in the flats. As the indicator uses volumes in its calculations, be careful during evenings and night times, when there are very small volumes. It is recommended to be used only on multiple currencies or at lea
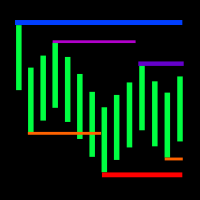
The indicator displays the fractal levels of one,two or three different higher timeframes starting with the current one. When a new fractal appears, a new level is plotted. The indicator can be used for visual analysis of the current chart and applied in an EA. If more levels are needed, start a new instance of the indicator.
Features Timeframes to choose from. For example: M1, M2, M3, M20, H2, H3, H12. If a timeframe smaller than the current one is selected in the settings, the level of the cu

It is good to know the presence of a trend on multiple timeframes at once. And even better - on multiple currency pairs at once. This indicator allows to quickly determine the presence of a trend or a flat on 8 timeframes and from 1 to 15 currency pairs at once. Multi Alligator Signals analyzes the signals of the Alligator indicator by Bill Williams on every timeframe (from M1 to W1) and multiple currency pairs (up to 15) simultaneously. If there is a buy signal, a green upward arrow is drawn, i

Bermaui Bands(BB)は、レンジとトレンドの価格変動をフィルタリングするのに役立つテクニカル分析ツールです。この指標の背後にある考え方は、次のステップで説明できます。 標準偏差を0〜100の間で移動するオシレーターとして計算します。これをBermaui偏差パーセント(BD%)と名付けます。 「BD%」がゼロに近い場合、ボラティリティは極端になります。さらに、「BD%」が100に近い場合、ボラティリティは非常に低くなります。 ボラティリティが高いということは、トレンド市場の可能性が高いことを意味し、ボラティリティが低いということは、横向きまたはレンジング市場を意味します。 標準偏差はSMAに基づいて計算されるため、中央の線は単純移動平均(SMA)です。 計算で同じバー数の単純移動平均に「BD%」を追加して、アッパーベルマウイバンドを取得します。 計算で同じ数のバーを使用した単純な移動平均から「BD%」を減算して、Lower BermauiBandsを取得します。 重要な情報
Bermaui Bandsユーザーズマニュアル: https://www.mql5.com/en/bl
Some candles have a strong tendency to continue the movement or to revert it. With the help of the Colored candles indicator such movements are clearly visible. This indicator calculates the parameters of each candle, as well as its volume, and after that it paints the candles depending on its strength and direction. Bullish candles are colored green and bearish candles - red. The greater the power of the bulls or the bears, the brighter the color. You can change the colors if you want. The indi

This is a script that is made to work in conjunction with the Objects Hide script Re-draw again the objects removed in the chart by the Objects Hide script Just drag and drop over the desired chart when you want to recall the objects deleted by Objects Hide Using this scripts system you can have the option to hide (remove) all graphical objects in the chart and recover them again later. Objects Hide is purchasable here in mql5.com find out more about this on this link. Please watch the demo tuto
FREE
This innovative technical indicator was created to detect quiet market period before the beginning of the high volatile market. Like many good technical indicators, this Market Activity Index is very stable and it is widely applicable to many financial and non financial instruments without too much restriction. The Market Activity Index can be used best to visualize the alternating form of low and high volatile market. It is very useful tool to pick up the quiet market but ironically this is the

Awesomo is a fully automated scalper Expert Advisor which uses the strategy of support and resistance lines breakthrough. Each order is always accompanied by a stop loss. The EA allows trading a fixed lot. Also, the trading robot features automatic lot calculation based on the preset risk per trade. I recommend that you use an ECN with low spread and fast execution.
Advantages Stop loss is always applied; Smart profit fixing step algorithm; Fixed and auto lots; No indicators; No hedging; No gri

Smart Advisor Calculation is designed for a very interesting method that is able finally to give the martingale a new positive way! At startup the Expert Advisor sets virtual orders and trades like the real deal. As soon as the drawdown of virtual orders reaches the set number, the robot immediately enters the market for real orders! Thus the price is going without setbacks such as 30-70 pips, with great probability will kick back at the entrance to the market! This is used by a robot! If the pr

Some experienced trades can tell where the price will go even without indicators, as the direction of the price can be found using the ordinary candlesticks. The EA compares several nearest bars and their volumes, and opens a trade based on that data. Also, it is able to analyze the candles on two timeframes at the same time to make the entry more accurate and less risky. In addition, the EA can automatically determine the take profit and stop loss size depending on the size of the previous cand

It is based on Surfing strategy. DOES NOT USE MARTINGALE. The EA catches the moments when the previous candle crosses the moving average indicator and eliminates the false breakouts using the RSI+MA indicator, and at the same time analyzes the trend direction. The EA trades pending orders, which also allows to avoid false movements. If the pending order was not triggered and the chart reversed, then the EA deletes the pending order. Also, according to the strategy, the EA uses the Trailing Stop,
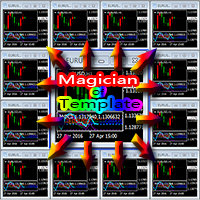
Everyone has their own style, for example, color of candle, color of chart blackground, used indicators, EAs, and script tools etc. If you often use a template to load your favorite style, you should already know that manual loading is cumbersome when using multiple charts. Now, you can use this tool to work better and faster. Magician Of Template (MOT) is a utility script tool for MetaTrader 4. After attaching the script to a chart, one template will auto load to all charts. The template should
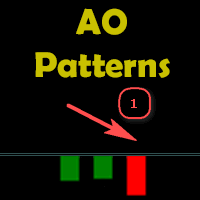
The indicator displays a formed pattern of the AO (Awesome Oscillator) indicator at the signal bar according to the "Profitunity" strategy by Bill Williams. The patterns differ in colors, location and number. The indicator can notify the user about the appearance of a new pattern. It is important to remember that you must not use the signals of the "АО" indicator until the appearance of the first buy/sell fractal outside the alligator mouth.
Types and designation of the patterns Buy 1 - "Saucer

Delta Pairs is an indicator for pair trading, it displays the divergence of two currency pairs. Does not redraw. A useful tool for the analysis of the behavior of two currency pairs relative to each other.
Purpose The Delta Pairs indicator is designed for determining the divergences in the movements of two currency pairs. This indicator is displayed as two line charts and the difference (delta) between these charts in the form of a histogram. The Delta Pairs indicator will be useful for those w

This EA implements the EMA 8/18 strategy, which is used by many traders. Brief description of the strategy: The Buy is determined when the EMA 8 indicator crosses the EMA 18 from below, with the price moving more than 50 points from the crossing. The buy position is opened when the price touches the EMA for the first time, after that, as the price rises, the trade is maintained by a trailing stop with a step of 30-35 points. The opposite is for opening a sell position. The parameters of the fast
MetaTraderマーケットは、開発者がトレーディングアプリを販売するシンプルで便利なサイトです。
プロダクトを投稿するのをお手伝いし、マーケットのためにプロダクト記載を準備する方法を説明します。マーケットのすべてのアプリは暗号化によって守られ、購入者のコンピュータでしか動作しません。違法なコピーは不可能です。

取引の機会を逃しています。
- 無料取引アプリ
- 8千を超えるシグナルをコピー
- 金融ニュースで金融マーケットを探索