YouTubeにあるマーケットチュートリアルビデオをご覧ください
ロボットや指標を購入する
仮想ホスティングで
EAを実行
EAを実行
ロボットや指標を購入前にテストする
マーケットで収入を得る
販売のためにプロダクトをプレゼンテーションする方法
MetaTrader 4のための新しいテクニカル指標 - 83

アプリケーションは、1枚のシートに数十ペアのデータを表示します。これにより、取引の有望なペアをすばやく特定できます。 数十のチャートを開いて分析する必要はありません。3-4-5のチャートと正確に分析する必要のあるチャートのみを開きます。 「コメント」のフルサイズの写真を参照してください。 メニューは1〜30記号で設定できます。これだけでは不十分な場合は、グラフィカルインターフェイスを介して無制限の数を追加できます。そこで不要なペアを削除することもできます。 GUIを使用すると、組み込みのインジケーターのトレンド設定を変更することもできます。 インジケーターは、日、週、月、年の最大値と最小値を検出します。表には、最大値/最小値が表示されます。 「最大-最小」振幅は、各期間のツールチップに表示されます。 価格が最大または最小に近づくと、対応するセルの色が変わります。最大値がライムの場合、最小値がオレンジの場合。 高値/安値は、表にも表示されている現在の価格と比較することもできます。 アプリケーションには、MA-Cross、MACD、RSIの3つのインジケーターが組み込まれて

RSI Divergence Full +10 other divergence indicators
Contact me after payment to send you the User-Manual PDF File. Download the MT5 version here. Also you can download the >>> Hybrid Trading EA <<< that is designed and implemented based on RSI Divergence Indicator. RSI is a pretty useful indicator in itself but it's even more effective when you trade divergence patterns with that. Because the divergence signal of the RSI indicator is one of the most powerful signals among the indicators. Di

Scalping trader full - full version of the scalping indicator for intraday trading. This indicator analyzes the state of the market and shows the trader with arrows when to open orders and in which direction. When the arrow appears, open an order in the direction of the arrow. We set take profit at the minimum distance (about 10 pips + spread). Stoploss is an indicator signal in the opposite direction.
Indicator advantages: shows signals on the chart when to open orders. shows in which directi

Scalping trader light is a simplified version of the scalping indicator for intraday trading. This indicator analyzes the state of the market and shows the trader with arrows when to open orders and in which direction. When the arrow appears, open an order in the direction of the arrow. We set take profit at the minimum distance (about 10 pips + spread). Stoploss is an indicator signal in the opposite direction.
The simplified version of the indicator works the same on all pairs and timeframes

Contact me after payment to send you the User-Manual PDF File. Divergence detection indicator with a special algorithm. Using divergences is very common in trading strategies. But finding opportunities for trading with the eyes is very difficult and sometimes we lose those opportunities. The indicator finds all the regular and hidden divergences. (RD & HD) It uses an advanced method to specify divergence. This indicator is very functional and can greatly improve the outcome of your trading. Thi

Prosecution is a Forex arrow indicator that tracks the market trend, ignoring sharp market fluctuations and noise around the average price. The indicator is created on the basis of a special algorithm, and based on the developed algorithm, signals are created that allow you to track the trend and see its beginning and end, especially when several timeframes are combined to refine the signal. The arrows show the direction of the deal, and are colored accordingly, which can be seen in the screensh

If you are not sure how to determine the trend reversal point and are concerned about how to draw trend lines then the Suspects indicator is for you. The Suspects indicator is plotted in the same window as the price chart. With the help of the Sherlock indicator algorithm indicator, you can quickly understand what kind of trend is currently developing in the market. It can be used along with oscillators as a filter.
Many newcomers who first enter the market are often more fortunate than a prof

Pianist - arrow indicator without redrawing shows potential market entry points in the form of arrows of the corresponding color. The tool reduces the number of missed entries, which is very important for an intraday strategy, where the mathematical expectation is quite low and the spread costs are high. Arrows will help a beginner trader to better understand the mechanism of formation of signals of a trading system during step-by-step testing. The icons with the entry direction that appear wil

Indicator Forex Indiana allows you to analyze historical data, and based on them, display instructions for the trader for further actions. Indiana implements indicator technical analysis and allows you to determine the state of the market in the current period and make a decision on a deal based on certain signals. This is the result of mathematical calculations based on data on prices and trading volumes. An attempt is made to describe the current state of affairs in the market, to understand

Elephant is a trend indicator, a technical analysis tool that helps to determine the exact direction of the trend: either the upward or downward movement of the price of a trading currency pair. Although these indicators are a little late, they are still the most reliable signal that a trader can safely rely on. Determining the market trend is an important task for traders.
Using the algorithm of this forex indicator, you can quickly understand what kind of trend is currently developing in the

The Fracture indicator uses many moving averages that are with a given Length step. As a result of the work, the resulting lines are formed, which are displayed on the price chart as blue and red lines. The simplest use case for the indicator is to open a trade in the direction of an existing trend. The best result is obtained by combining the indicator with fundamental news; it can act as a news filter, that is, show how the market reacts to this or that news. The indicator lines can also be in

Market Profile
Shows where the price has spent more time, highlighting important levels that can be used in trading.
It is a powerful tool which is designed to take the fundamental components which comprise every market; price/volume/time, and visually display their relationship in real-time as the market develops for a pre-determined time period. Very powerful tool!

VWAP Bands Metatrader 4 Forex Indicator
The VWAP Bands Metatrader 4 Forex indicator is a quite similar to the Bollinger bands, but it deploys volume weighted average as the core value of the bands. There is an option of using the tick volume or real volume for calculation when using the VWAP Bands Metatrader 5 custom forex indicator, especially when the forex broker displays symbol alongside real volume. Similarly, you can decide to have deviations calculated with the sample correction or not.
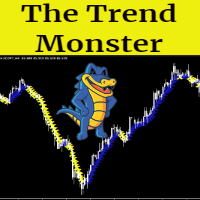
The Trend Monster is a trend following non repainting indicator based on moving averages. As traders we want to be careful not to trade against the trend. Therefore when you look at the chart as a trader you will have to ask yourself these kind of questions Is this market trending? Is this market ranging/trading sideways? Is this market bullish or bearish? What should I look for before I take a trade? Those are some critical questions that every trader should ask him/herself before taking any tr

NOTE-After the first 10 people to rent this product for 1 month then I will remove the 1 month renting option and leave the unlimited price only. Therefore don't rent it too late. Thanks for those who have rented yet. Don't miss out this offer! Few people remaining. Special offer from 2500usd to 200usd 24 hours offer! Introduction
Super bands Trend Indicator is an indicator designed to reveal the direction of the market Trend. The Indicator is based on moving averages, ichimoku, alligators, a

The QRSI indicator is one of the most important and well-known indicators used by traders around the world. It is also obvious that this indicator is capable of showing good entries in every local area. For which it usually needs to be optimized or just visually adjusted. This development is intended for automatic optimization of the indicator. Once placed on the chart, the indicator will automatically re-optimize itself with the specified period (PeriodReOptimization) and display the chart wit
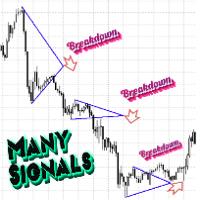
Индикатор уровней треугольник подскажет в какую сторону может двинуться цена при пробитии одной из них.
Если вы сомневаетесь в какую сторону торговать, то этот индикатор вы можете использовать как фильтр на любом инструменте и любом таймфрейме.
Индикатор разработан таким образом , чтобы помочь выявлять направление движения цены.
Стратегия построения прямоугольника работает по авторскому алгоритму нахождения определённых консолидаций.
Цена на индикатор минимальна для первых продаж.
Далее цена 99

Ichimoku Signals Dashboard To test the indicator please download demo version here. Find Ichimoku signals as easy as you can. Ichimoku is one of the most powerful trends recognition indicators. And it has valid signals for the trades. This indicator scans several symbols and time-frames by the Ichimoku to find all the signals that you want and show in a dashboard. It's easy to use, just drag it onto the chart. It's better to add Ichimoku indicator to chart before adding this indicator. Ichimo

Detect strength for uptrends and downtrends by tracking Buy Power and Sell Power. Stay on the right side of the market by being able to determine whether the market is in a bull or bear trend and how strong the trend is.
Free download for a limited time! We hope you enjoy, with our very best wishes during this pandemic!
Trend Trigger Factor aims to ride out sideways movement, while positioning the trader in the correct side of the market to capture big trends when they occur. It was origin
FREE

Description: This indicator draw ZigZag Line in multiple time frame also search for Harmonic patterns before completion of the pattern.
Features: Five instances of ZigZag indicators can be configured to any desired timeframe and inputs. Draw Harmonic pattern before pattern completion. Display Fibonacci retracement ratios. Configurable Fibonacci retracement ratios. Draw AB=CD based on Fibonacci retracement you define. You can define margin of error allowed in Harmonic or Fibonacci calculations
FREE

Displays the readings of the Moving Average indicator on the older timeframe. Wishes for other types of Moving Average are accepted (however, the possibility of implementation depends on the type of algorithm). It doesn't make sense to apply it to the current timeframe - there are free indicators for this. Does not redraw the readings starting from the first bar. It is very important to have and match the history of the timeframes on which it is installed and set in the settings. A simple built-

"Trend Guide" is an indicator showing the trend direction based on a fast and slow moving average. Everything is simple and most importantly convenient.
Indicator Parameters :
"_fast_moving_average_period" - The period of the fast moving average;
"_ Slow_Moving_Average_Period" - The period of the slow moving average; ;
"_MA_SHIFT " - Moving average shift;
"_MA_METHOD " - Averaging method;
"_APPLIED_PRICE " - Type of price calculation;
"_line_width " -

Индикатор Форекс LTT Range System показывает на графике средние диапазоны движения рыночной цены за периоды M 15, H 1, H 4, D 1, W 1, MN 1. Верхняя и нижняя границы диапазонов рассчитываются от цены открытия бара. Пивот – середина между ценой открытия бара и границей диапазона: если рыночная цена находится выше цены открытия бара – метка пивота располагается между ценой открытия бара и верхней меткой диапазона, если рыночная цена находится ниже цены открытия бара – метка пивота располагается ме

Looking for strong trend entrance and exit points of trends? This incorporates volume into price calculations for a fast entry/exit, showing how supply and demand factors are influencing price, and giving you more insights than the average trader uses. The Volume Accumulation Trend indicator is a cumulative indicator that uses both volume and price to investigate whether an asset is growing or falling. It identifies differences between the price and the volume flow, which lets us kno

Calculation of Lot Size for many traders is a big challenge.
A case that is very important in money management. What many traders ignore.
Choosing an appropriate Lot Size in trades can improve results and it will ultimately lead to success.
This indicator calculates the authorized Lot Size for your trades.
The indicator uses the following values to get the appropriate Lot Size for positioning:
The distance of Stop Loss.
The Pip Value.
The amount of Risk Allowed For Each Trade.
The amoun
FREE

RSI Signal Scanner The primary trend of the stock or asset is an important tool in making sure the indicator's readings are properly understood. For example, some of the technical analysts, have promoted the idea that an oversold reading on the RSI in an uptrend is likely much higher than 30%, and an overbought reading on the RSI during a downtrend is much lower than the 70% level. This indicator notifies you of RSI important levels breakouts (30% and 70%) by searching among the symbols and chec
FREE

Dear traders, here is my other tool called the "Market Makers Trend Index". The Market Makers Trend Index is created for the purpose of helping majority of traders to analyse the market direction in an easy way. This indicator is for serious traders who are eager to add edging tools to their trading arsenal. What are you waiting for just grab your copy today and amake a difference. WHY THIS TOOL This indicator help traders analyse the trend direction and trading signals with precision and eff

Sometimes a trader needs to know when a candle will close and a new one appears to make the right decisions, this indicator calculates and displays the remaining of current candle time . It is simple to use, just drag it on the chart. Please use and express your opinion, expressing your opinions will promote the products. To see other free products, please visit my page.
FREE
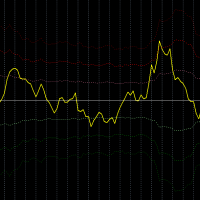
Description:
This indicator measures how far the price is away from Moving Average or multiple Moving Averages (from Lowest MA Period to Highest MA Period). also you can apply weighted factor that increase / decrease from lowest MA to highest MA period.
Inputs:
Lowest MA Period Highest MA Period Weighted factor for Lowest MA Period Weighted factor for Highest MA Period MAs method MAs applied price ATR Period 1st band factor 2nd band factor 3rd band factor indicator Applied price
FREE

Export Positions and Orders to JSON file On every tick the software checks if something is changed from the last export, and it rewrite the file only when necessary, optimizing CPU and disk writes You can choose: - to export only the current Symbol or all Symbols
- to export only positions, only orders or both
- the file name to export to The file will be saved on MQL4\Files folder with .json extension You can use the file how you want, to copy for example your MT4 positions on other platofms

Индикатор отображает динамические разворотные уровни по шкале Фибоначи. Основан на индикаторе ЗИГ-ЗАГ, который управляется периодом и минимальной глубиной для переключения тренда. Если указать глубину переключения равной 0, то она не будет участвовать в расчетах индикатора. Используется неперерисовывающий сформированные вершины индикатор - возможны несоответствия экстремумов со стандартным индикатором ЗИГ-ЗАГ. Расчитывается на закрытом баре, действие зоны отображается для текущего бара. Основные
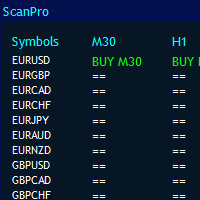
MT4 Universal Panel pro ex4ファイルを含むすべてのインジケーターとタイムフレーム用に設計されています。
それはあなたのコンピュータのパワーと最大10の時間枠に基づいて無制限のペアをスキャンすることができます。パネルのサイズは自動的に配置されます。
バッファによって任意のインジケータを呼び出すことができます。
これは、すべてのデフォルトおよびカスタムインジケーターで機能します。平観足、rsi、放物線、練行足、フラクタル、サポート抵抗、需給、発散、高値と安値の移動平均に簡単に使用できます。
すべての通貨に対して1つのウィンドウから操作できます。設定についてご不明な点がございましたらお問い合わせください。
これはmt4ダッシュボードであり、どのペアでも機能します。ペア名は以下のように入力するだけです。それは任意の外国為替インジケーターを呼び出し、そのシグナルバーをチェックします。
NS。パネル作業を行い、3ペアと複数の時間枠のみをスキャンする場合は、次のように入力します。
記号:EURUSD、GBPUSD、USDJPY
タイムフレーム:30、60、24

Gold ZigZag - ローソク足の開始時にシグナルを提供する、実際には再描画や遅延のないジグザグである矢印インジケーターです。このインジケーターは、XAUUSD ペア (ゴールド) 用に特別に設計されています。このインジケーターは他のペアでも使用できますが、元々このインジケーターはゴールドでのみ使用されることを意図していました。このインジケーターはどの時間枠でも使用できますが、H4 や D1 などのより高い時間枠をお勧めします。 このインジケーターは使いやすく、トレーダーの特別なスキルや知識は必要ありません。このインジケーターには、「長さ」と「感度」という 2 つのオープンパラメーターしかありません。これら 2 つのパラメータを操作することで、個人の取引の好みに応じてシグナルを調整できます。 PUSH通知を利用して外出先でも取引可能です。 取引のヒントと素晴らしいボーナスを入手するには、購入後にご連絡ください。 幸せで有益な取引をお祈りします。
インディケーター Simple ATR 市場のボラティリティをより明確に追跡するための簡略化されたツールで、デイトレードとスイングトレードの両方に最適です。 トレードを始めるため、または初心者に最適なインディケーターです。
視覚的なインディケーターの色: ATR Daily - 青 視覚的なインディケーターの色: ATR Weekly - 赤 視覚的なインディケーターの色: ATR Monthly - 黄色
Volatility Vision インディケーターと組み合わせることで、分析を強化できます。 市場状況の変動を正確に測定し、デイトレードとスイングトレードの意思決定に不可欠です。 14日間(設定可能)のシンプルな移動平均を使用して、真の範囲インディケーターの精度を確保します。 トレーディングシステムでの取引開始や終了戦略を実行するのに最適で。 ATRインディケーターが他のインディケーターより優れている理由: 使いやすさ:ATRインディケーターは設定と理解が簡単で、初心者のトレーダーでも使えます。 多用途性:デイトレードとスイングトレードの両方に適しており、さまざまなトレ
MyArrow インジケーター Nr:1 このインジケーターは、高値と安値の系列を調べることによって作成された移動平均と、グラフ上のこれらの移動平均から導出されたバンド値を超えることによって受信された信号によって作成されます。 簡単に理解できるように、下向きの矢印は有望な売りシグナルを示し、上向きの矢印は可能性のある買いシグナルを示します。 たくさんのお得... MyArrow インジケーター Nr:1 このインジケーターは、高値と安値の系列を調べることによって作成された移動平均と、グラフ上のこれらの移動平均から導出されたバンド値を超えることによって受信された信号によって作成されます。 簡単に理解できるように、下向きの矢印は有望な売りシグナルを示し、上向きの矢印は可能性のある買いシグナルを示します。 たくさんのお得...

The indicator draws potential levels that may become significant support and resistance levels in the future.
The longer the line, the higher the probability of a price reversal or an increase in price movement after the breakdown of this level. With a decrease in the probability of the formation of a level, the length of the line is reduced.
The indicator does not require adjustment.
In the settings, you can change the design of the indicator.
The "L ine_Length " button is placed on the ch

The Goodfellas indicator analyzes the price behavior and if there is a temporary weakness in the trend, you can notice it from the indicator readings, as in the case of a pronounced trend change. It is not difficult to enter the market, but it is much more difficult to stay in it. With the Goodfellas indicator it will be much easier to stay in trend! This indicator allows you to analyze historical data and, based on them, display instructions for further actions on the trader's screen.
Every r

v. 1.0 This indicator can show with maximum accuracy up to 1 bar the presence of a Maximum/minimum on the chart, regardless of the timeframe. It has a flexible configuration. You can use either one value on all TF, or you can use your own value on each TF individually.
This indicator is already being improved and those who purchase it receive all updates for free.
Next, it is planned to display an indication of the strength of the pivot point at each extremum (in % or in color drawing). It wi
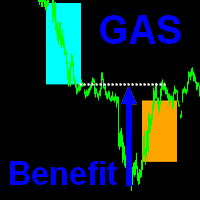
The indicator is based on the principle of closing the Gap of the American trading Session ( GAS ).
How is the Intersession Gap formed? A time interval is formed between the closing of a trading session and the opening of a new one (the next day) about 15 hours, during this time the price may deviate from the closing price in any direction. It is noticed that such deviations in 95% of cases are temporary and the price returns to the closing point of thesession. What does the indicator do? The

TrendScanner XTra scans market trends from Multi Symbols and Multi Timeframes with extra additional Entry Point Signals arrow on the current chart. Features:
-Entry Point SIgnals : This is additional feature in the indicator. No repaint arrows. The Trading system in the single indicator. MTF Trend informations and Entry Signals. In order to make it easier for trader to get trading moments from a single chart and deciding entry time. -Changeable Panel Display : Change the value of Max.Symbol

Idea: RSI ( Relative Strength Index) and CCI ( Commodity Channel Index ) are powerfull to solved the market. This indicator has Smoothed Algorithmic signal of RSI and CCI. So that, it separates the market into buy and sell zones, these areas are marked with arrows, red for downtrend, green for uptrend. This algorithm has the effect of predicting the next trend based on the historical trend, so users need to be cautious when the trend has gone many candles. Please visit screenshots

"Capture the sleeping and waking alligator." Detect trend entrance/exit conditions - this indicator can also be tuned according to your trading style. You can adjust a confidence parameter to reduce false positives (but capture less of the trend). This is based on a modification of the Alligator indicator by Bill Williams, an early pioneer of market psychology. 2 main strategies: either the " conservative" approach to more frequently make profitable trades (at a lower profit), or the " high r
FREE

The Extremum Average signal indicator works on all timeframes and any markets. Analyzes the smoothed data of extremums and gives signals to sell or buy.
The indicator has only two settings: Number of Bars - the number of last bars to search for an extremum Period Average - Period (number of last bars) for data smoothing For each timeframe and market, you need to select its own values. Additionally, in the indicator settings, you can set your own style of signal display: Size Arrow Code Arrow B

The QRSI indicator is one of the most important and well-known indicators used by traders around the world. All signals are generated at the opening of the bar. Any closing price or zero bar prices are replaced with the corresponding price of the previous bar in order to avoid false results. This indicator is suitable for those who are interested in the classic calculation method but with improved functionality. There is a version for both MT4 and MT5.
By its nature, the QRSI indicator is

The Dictator indicator is based on the process of detecting the rate of change in price growth and allows you to find points of entry and exit from the market. a fundamental technical indicator that allows you to assess the current market situation in order to enter the market of the selected currency pair in a trend and with minimal risk. It was created on the basis of the original indicators of the search for extremes, the indicator is well suited for detecting a reversal or a large sharp jer
Moving average cross over notification !
How to use Add NotifyMaCross indicator into the chart. Set Moving average line one and two. Wait the notification when moving average cross over Support for development : https://www.buymeacoffee.com/itwetrade
Check out all indicator and expert advisor here https://www.mql5.com/en/users/thanksmybot/seller ------------------------------------- Como usar
Adicione o indicador NotifyMaCross ao gráfico.
Defina a linha média móvel um e dois.
Agua
FREE

このインジケーターは、トレンドの方向とトレンドの転換を示します。 Ganesha Trend Viewerは、GOLD(XAUUSD)専用に設計されたトレンドフォローのインジケーターですが、その他のあらゆる金融商品で使用することもできます。 インジケーターは後で描画し直すようなことはしていません。 推奨する時間足(Timeframe)はH1です。 Ganesha Trend Viewer は、すべてのMeta Traderでサポートされるシンボルで使用できます。 (通貨、金属、暗号通貨、株式、インデックス..)
パラメタ設定
MA Short Period ----- 移動平均 短期間 MA Long Period ----- 移動平均 長期間 Alerts ON ----- アラートオン Mobile Notification On ----- モバイル通知オン
FREE

The indicator displays 4 current levels between which the price is located. The levels are calculated based on the range of the previous day. The number and value of levels is arbitrary and expressed as a percentage. The position of the levels is calculated from the minimum of the previous day (an example can be found in the description of the parameters). It is advisable to place the levels in the settings line in order, nevertheless, the indicator will sort them by itself and if levels are fou
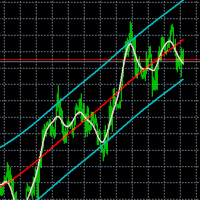
Flex channel - indicator plots channel using Hodrick-Prescott filter. Hodrick-Prescott filter is the method of avreaging time series to remove its cycling componets and shows trend. Settings HP Fast Period - number of bars to calculate fast moving average
HP Slow Period - number of bars to calculate slow moving average
Additional information in the indicator Channel width - channel width in pips at first bar MA position - fast moving average position in the channel in persentage
Close position -

Informative & optimized Zigzag, Accumulated volume, Price change A rewrite of the traditional zigzag tool with new additions. Features:- Optimized code Displays accumulated volume between peaks Displays price change between peaks Usage:- Identify trend swings Identify high volume swings Compare price changes between swings Drawing Fibonacci tool on strong price change or high volume swings
FREE

A forex pivot point strategy could very well be a trader’s best friend as far as identifying levels to develop a bias, place stops and identify potential profit targets for a trade. Pivot points have been a go-to for traders for decades. The basis of pivot points is such that price will often move relative to a previous limit, and unless an outside force causes the price to do so, price should stop near a prior extreme. Pivot point trading strategies vary which makes it a versatile tool for
FREE

Catch major price movements, early in the trend. Alerts you to enter at the likely beginning of a trend, and if it's incorrect, quickly alerts you to exit to limit any loss. Designed to capture large, profitable price movements, with early entrance to maximize your returns. As shown in screenshots, typical behavior is several quick entrance/exists with small loss , and then capture of a large trend with high profits . The Instantaneous Trend indicator is a lag-reduced method to detect pri

Artificial intelligence is a trend of the times and its power in decoding the market has been demonstrated in this indicator. Using a neural network to train the indicator to recognize trends and remove noise areas caused by price fluctuations, this indicator has obtained a reasonable smoothness for analyzing price trends. This indicator is none repaint. Suitable for day traders or longer traders *Non-Repainting (not redrawn) *For Metatrader4 Only *Great For Swing Trading *Histogram Up is Long,

Future prediction is something any trader would love to know, through this simple prediction algorithm can give a picture of the future. This algorithm is based on past data and the average prices of the data to simulate future candles. This is an indicator that will be redrawn. This indicator is completely free, can be used as a trend reference but absolutely do not use for trading.
FREE

Whether trading stocks, futures, options, or FX, traders confront the single most important question: to trade trend or range? This tool helps you identify ranges to either trade within, or, wait for breakouts signaling trend onset.
Free download for a limited time! We hope you enjoy, with our very best wishes during this pandemic!
The issue with identifying ranges is some ranges and patterns are easy to miss, and subject to human error when calculated on the fly. The Automatic Range Identifi
FREE

"Drivers Road Bands" indicator that is designed to be used in the 1H, 4H and 1D timeframes in the most ideal way. If we compare timeframes to roads and streets; main streets and highways with high traffic volume are similar to high-time timeframes in technical analysis. If you can interpret the curvilinear and linear lines drawn by this indicator on the graphic screen with your geometric perspective and develop your own buy and sell strategies; you may have the key to being a successful trader.
FREE

Indicator showing the breakout after at least X candles of the same sign, followed by an opposite candle. PARAMETERS: BARS TO SHOW = Story of Indicators (0 = all bars) Consecutive Bars for Breakout = How many Bars of the same direction and after a Bar with opposite direction Minimu Point between H/L = To consider a bar valid, she must have a Minimun Hi/Lw value Minimu Point between O/C = To consider a bar valid, she must have a Minimun Open/Close value Graphics are self-explanatory
FREE

The parabolic stop and reverse (PSAR) indicator was developed by J. Welles Wilder, Jr. as a tool to find price reversals which can be utilized as stop-loss levels as well as trade triggers. The notable difference about the PSAR indicator is the utilization of time decay. The PSAR indicator forms a parabola composed of small dots that are either above or below the trading price. When the parabola is below the stock price, it acts as a support and trail-stop area, while indicating bullish up t
FREE
Индикатор отображает 4 текущих уровня между, которыми находится цена. Уровни вычисляются на основе диапазона предыдущей недели. Количество и значение уровней произвольное и выражается в процентах . Положение уровней отсчитывается от минимума предыдущего дня (пример можно посмотреть в описании параметров). Целесообразно размещать уровни в строке настроек по порядку, тем не менее индикатор сам их отсортирует и если обнаружатся уровни отстоящие менее чем на 1% выдаст ошибку. Индикатор работает н

The breakout algorithm is a technique based on price, price features, to shape a breakout strategy. The strategy in this indicator will not be redrawn (none-repaint indicator), it is suitable for short or long term traders In the screenshot is the EURUSD pair, these currency pairs, commodities or stocks, it have similar strength *Non-Repainting (not redrawn) *For Metatrader4 Only *Great For Scalping *Great For Swing Trading *Arrow Entry, Green is Long, Red is Short *Works On Any Timeframe *Work

The resistance and support lines are the position where the price will have a change, be it a breakout to follow the trend or reverse. The price rule will go from support to resistance and Long's resistance can be Short's support and the opposite is true. Accurately identifying support and resistance lines is the key to being able to trade well and profitably. This indicator is based on the Fractals indicator, the indicator will be redrawn by 2 candles. *Great For Swing Trading *Blue is Support

Price breakouts, Levels, Multi-time frame Inside bars checks for price failure to break from the previous high/low and on breakout draws a breakout box on the chart. The choice of breakout price is given to the user i.e. close or high/low of bar. Alerts can be received on breakouts. Features:- Multi-time frame Alerts, notifications & emails Usage:- Breakout signals Check how price action is evolving with the help of boxes Get multi-time frame bias
Ferox Least Squares Regression is an algorithm that uses regression and is design by Ferox Quants-Labs to use method like typical quantitative algorithm, using statistics and use past data to predict the future. * None Repaint indicator * Quantitative algorithm *Great For Swing Trading * Histogram Up is Long, Down is Short *Works On ALL Timeframe *Works On Any MT4 Pair
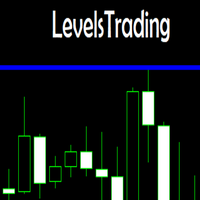
This indicator is a simple stripped down version of any advanced support and resistance indicator. All the support and resistance indicators work from a number of bars that have developed over time. Get rid of clutter and confusing levels. Find levels according to a number of bars. Look at days, session, numbers of hours, periods of consolidation. Watch levels develop and use as breakout points, or areas of buyers and sellers. Features and things to consider This indicator is for a frame of
volume MTF is the way to give you the Volume of currency and you will Know the trend and reflection when happen it used on scalping and entraday trading strategy with (M1....H4) Timeframe i always going take a look on higher timeframe then back to small timeframe and wait an indicator signals the setting of indicator i usually used the default just remove the arrows from setting this indicator recommended for scalping
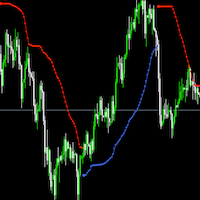
Bbandtrend 一款趋势指标,可以用来判断外汇、黄金等商品的趋势,用于辅助交易,提高交易的胜率。每个人都可以调整参数,适应不同的货币。 指标多空颜色可以自定义。 extern int Length=60; // Bollinger Bands Period extern int Deviation=1; // Deviation was 2 extern double MoneyRisk=1.00; // Offset Factor extern int Signal=1; // Display signals mode: 1-Signals & Stops; 0-only Stops; 2-only Signals; extern int Line=1; // Display line mode: 0-no,1-yes extern int Nbars=1000;
The sample on the right corner of the chart uses Font Size 20. The characters/numbers will start from the right side/corner of the chart, so that when increase the font size, the text will expand out to the left/top and won't goes to the right/bottom and get hidden. Able to change these Inputs. a. Other Symbol. Current chart symbol will always be displayed. b. Fonts. c. Font size. d. Text color (All the text label, local time, bid, ask, spread, lots, number of trades, Margin, Free Margin, Mar
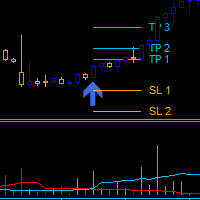
Dark Power is an Indicator for intraday trading. This Indicator is based on Trend Following strategy, also adopting the use of an histogram to determine the right power . We can enter in good price with this Indicator, in order to follow the strong trend on the current instrument. The histogram is calculated based on the size of the bars and two moving averages calculated on the histogram determine the direction of the signal
Key benefits
Easily visible take profit/stop loss lines Intui
正規化されたトレンド反転マルチタイムフレームインジケーター 正規化されたトレンド反転マルチタイムフレームインジケーターは、非常に信頼性の高いトレンド反転インジケーターとして開発されました。 正規化されたトレンド反転マルチタイムフレームインジケーターは、すべての外国為替通貨ペアと金属に適合し、あらゆる種類のタイムフレームチャートと一致する可能性があります。 正規化されたトレンド反転マルチタイムフレームインジケーターは、別のウィンドウで2つの修正された移動平均システムのクロスオーバーを使用して信号を生成します。 これらの平均レベルは、正規化トレンド反転マルチタイムフレームインジケーターと呼ばれます。 青の平均レベルは高速正規化トレンド反転マルチタイムフレームインジケーターと呼ばれ、低速の正規化トレンド反転マルチタイムフレームインジケーターは赤の平均レベルとしてプロットされます。 速い青の正規化されたトレンド反転マルチタイムフレームインジケーターが遅い赤い正規化されたトレンド反転マルチタイムフレームインジケーターの上を横切るときはいつでも、それは市場への買いエントリーを示す強気のクロス
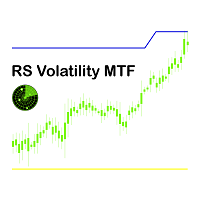
レーダー信号ボラティリティマルチタイムフレームインジケーターメタトレーダー 4 レーダー信号ボラティリティマルチタイムフレームインジケーター 非常に信頼性の高いトレンド指標として開発されました。 レーダー信号のボラティリティマルチタイムフレーム すべての外国為替通貨ペアに適合し、あらゆる種類の時間枠チャートと一致することができます。 レーダー信号ボラティリティマルチタイムフレームインジケーター 移動平均システムと価格の交差に基づいてトレンド信号を生成します。 平均真の範囲を考慮して、正確なエントリポイントが定義されました。 黄色の線は、この可能なエントリポイントを示しています。 価格が黄色の線を越えると、取引を開始できます。 青い線は可能性を示しています利益を得る。 価格が青い線を超えると、取引を終了できます。 2 本の緑色の線は、終値が緑色の線を点で割ったときにトレンドが変化する領域を示しています。 ドットの付いたこの緑色の線は、可能な SL 、可能な損益分岐点、または可能なトレーリングストップポイントとして使用できます。 ドットのない緑色の線は、価格がこの緑色に触れるとすぐに
MetaTraderマーケットはトレーダーのための自動売買ロボットやテクニカル指標を備えており、 ターミナルから直接利用することができます。
MQL5.community支払いシステムはMetaTraderサービス上のトランザクションのためにMQL5.comサイトに登録したすべてのユーザーに利用可能です。WebMoney、PayPal または銀行カードを使っての入金や出金が可能です。
取引の機会を逃しています。
- 無料取引アプリ
- 8千を超えるシグナルをコピー
- 金融ニュースで金融マーケットを探索
新規登録
ログイン