YouTubeにあるマーケットチュートリアルビデオをご覧ください
ロボットや指標を購入する
仮想ホスティングで
EAを実行
EAを実行
ロボットや指標を購入前にテストする
マーケットで収入を得る
販売のためにプロダクトをプレゼンテーションする方法
MetaTrader 4のための新しいテクニカル指標 - 71

Cyclical indicator for trading and predicting the direction of the market. Shows the cyclical behavior of the price in the form of an oscillator.
Gives signals for opening deals when rebounding from the upper and lower boundaries of the oscillator. In the form of a histogram, it shows the smoothed strength of the trend.
Will complement any trading strategy, from scalping to intraday. The indicator does not redraw. Suitable for use on all symbols/instruments. Suitable time frames for short-term t

" Scalping saham " is a unique, turnkey scalping trading system. It shows the trader when and where to open and close trades. Scalping trading is one of the most effective, but at the same time, the most complex trading systems. Therefore, if you don’t have your own strategy yet, you’d better take a ready-made scalping strategy and work with it. The scalping strategy of this indicator is to determine the direction of the trend with high accuracy, then determine the price reversal points and giv

Advanced Bollinger Bands Scanner is a multi symbol multi timeframe Bollinger bands dashboard that monitors and analyzes the Bollinger Bands indicator from one chart. This panel monitors the Bollinger bands indicator in up to 28 configurable instruments and 9 timeframes for price overbought/oversold, price consolidation (Bollinger bands squeeze), and consolidation breakout (squeeze break) with a deep scan feature to scan all market watch symbols (up to 1000 instruments!).
Download Demo here (
Great indicator for binary options!
Try what he can do!
Alert is arranged in it so that you are not late with the signal!
You can also customize the periods that suit you! (it is configured for currency pairs)
If you want more, you can always reconfigure and use more!
arrow indicator that works on several indicators, in the settings you can change the color of the arrows and the period! (repeat)
Test it and see it in action!

PROFITABLE TRADER is an interesting name for this indicator... And all because it is for a true trader who values his time. It has a built-in Alert and parameters that will make your work easier. Open settings will allow you to set the indicator to any cryptocurrency or just currency. It's better to test and then draw a conclusion .. screenshots will show everything.. good bidding my friend.

This indicator is named so for a reason, because it will show the reverse side of the market.
It has several math indicators built in that are tuned to show the best signals for currency pairs!
Ideally proved to be in work on the M5-M15 no more and no less!
Only at the same time it shows up to 86.5% of correct signals!
The settings include the colors of the arrows, the alert, and the same parameters so that you can reconfigure the indicator and trade on cryptocurrency and raw materials!
If

An excellent indicator for those who like fast binary options trading!
It works great on m1-m5 timeframes!
The periods are customizable, so you can even set up for cryptocurrency, and trade on weekends!
You can also customize the color of the arrows!
Works on all timeframes!
But as stated above, it's better on m1 - m5!
Whatever you forget about the signal, it has an alert!
Test and try this indicator! If I have questions write, I will gladly listen to suggestions and errors!

Moving Average Trend Scanner is a multi symbol multi timeframe triple MA crossover dashboard that helps traders to monitor, and identify potential market trends from one chart. This panel scans 3 moving averages in up to 28 configurable instruments and 9 timeframes for triple moving average alignment and moving average crossover with a deep scan feature to scan all market watch symbols (up to 1000 instruments!).
Download Demo here (Scans only M1 and W1) Settings description here MT5 version

It is a very simple and useful micro indicator. Shows the current ask price, and the maximum relative ask price up to the current moment, on the chart, in the first N candles. It facilitates quick decision making by offering a visual reference. Likewise, when we position ourselves with the cursor over it, it shows us the maximum spread since the indicator is applied, until the current moment. It is perfect for scalping . By default, the parameter N has the value 4.
Especially recommended indi
FREE

Pipsurfer Tide Meter is a Momentum Indicator that is designed to help trades know which way the "Tide" is turning. This indicator is a great supporting indicator to the pipsurfer main indicator that is listed in MQL5 under "Pipsurfer Indicator"
The Strategy Behind the Tide Meter is that youll see the blue bars and the red bars. Blue bars are for bullish momentum Red bars are for bearish momentum Use price action to find a trading zone then wait for the tide meter to change color then you ent
FREE

Overview: With so much noise and distraction in the markets I wanted to create clarity for traders to have a simple, efficient, and fun trading experience. This is why I created Pipsurfer. Pipsurfer is an trend following indicator that visually shows you important Institutional Smart Money levels in the market and helps you to trace Market Structure in the markets. Most traders find it difficult to visually see trading elements such as trend, structure and momentum which are key for understandin

Всем привет. Представляю Вашему вниманию Индикатор TRUE ATR для mt4 Так же есть данный индикатор для mt5 https://www.mql5.com/ru/market/product/82319 Данный индикатор работает на всех рынках. TRUE ATR высчитывает среднестатистическое движение инструмента за 1 день и показывает сколько в инструменте осталось энергии внутри дня. В отличие от классического индикатора АТР которые без разбора учитывает все бары(свечи), TRUE ATR при расчете среднестатистического движения инструмента исполь

Pipsurfer Dashboard is a multi-currency multi-timeframe dashboard designed to alert you to where the action is happening in the forex markets. The software trades a trend based price action and market structure strategy. Assets Supported: All Forex Metals Indices Major Crypto
Major Input Settings: Timeframe Filters - Choose which timeframe you want the Pipsurfer Dashboard to signal you on. Pair Selection - Choose To Follow All Major Pairs And Crosses or have a custom list of your choice Alert
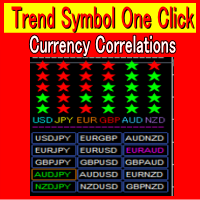
Currency Strength Meter 1:Correctly identifying trends in foreign exchange investments is critical. 2:TrendSymbolOneClick quickly detects and displays trends that have just begun and those that have already been in place for an extended period of time. 3:There is also a USD JPY EUR GBP AUD NZD strength function. 4:Volatility allows you to know exactly when there is a major market move. 5:You can save time in your market analysis by using Trend Symbol One Click. 6:Analysis available from 1 minut

インジケーターには、ピンバーの燭台パターンが表示されます。 影、ボディおよびサイズの比率は係数の設定を使用して容易に調節される。 トレンド(2つの移動平均)と反転(RSIとボリンジャーバンド)によるフィルタリングが可能です。 これは最も人気のある価格行動パターンです。 マルチ通貨ダッシュボードが利用可能です。 それを使用すると、簡単にチャートを切り替えることができます。
取引パターン: トレンド別再テスト 。 偽の内訳 。 その他 。
EURUSD, GBPUSD, XAUUSD, ... M15, M30, H1 。
入力パラメータ 。
メイン 。 Bars Count – インジケータが動作する履歴バーの数 。 Min Candles Shadows / Body Ratio – キャンドルの本体に対する影の最小比。 影が指定された値より小さい場合、そのようなろうそくは無視されます。 式(HL-OC)/OC 。 Min Shadows UP/DN Ratio – は、キャンドルの異なる側面からの影の最小比です。 両側の影の長さが同じ場合、その比率は1.0であり、設定には最
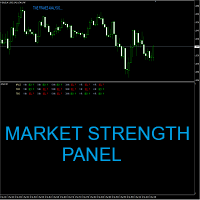
アポロマーケットストレングスパネルは、外国為替およびバイナリーオプショントレーダーに役立つマルチタイムフレームインジケーターです。パネルは、M1からH4までのいくつかの時間枠での市況を表しています。指標は、3つの重要な市場の側面に関する情報を提供します。それらはトレンド、フォース、インパルスです。これら3つのコンポーネントがすべて揃っている場合、インジケーターは市場の方向性に応じて買いまたは売りのシグナルを提供します。インジケーターはチャート上にシグナルをプロットします。信号を生成する時間枠を選択できます。 また、すべての時間枠が揃ったときに信号を送ることもできます。指標はあなたのために市場分析を行います。信号を適用する準備ができました。パネルは、スタンドアロンシステムとして、または既存の取引システムの一部として使用できます。 購入後、私に連絡して、個人的な取引アドバイスと素晴らしいボーナスインジケーターを入手してください!

A professional trading indicator with double-entry options. Valuable Smooth Channel Lines on the separated window, Trend Lines both on the main window, and separated window and entry arrows. Good for trading scalping in the lower timeframes. Even also it can work and provide signals in the higher timeframes for longer-term trading periods. INDICATOR SETTINGS: 1. Signal Mode. There are 2 options: Default and Compact. If Default, it will provide 3 different arrow codes on the main window. This o
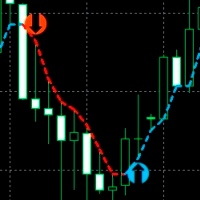
すべての時間枠とすべての通貨ペアの価格反転ポイントを正確に決定するための指標。市場の技術分析と数学的診断モデルの助けを借りて、この指標は価格の逆転点と現在の傾向の方向を非常に効率的に決定します。インジケーターは、この情報を矢印と線の形でチャートに表示します。矢印はトレンド反転ポイントを示し、線は現在のトレンド方向を示します。
この指標は、既存の取引戦略に統合することができ、スキャルピングまたは長期投資のための新しい取引戦略を構築するためにも使用できます。このインジケーターで頭皮を剥ぎ、日中に注文を開始する場合は、M5-M15の時間枠を使用し、インジケーターがチャートに矢印を描くときに取引を開始することをお勧めします。長期投資の場合は、H1、H4、D1の時間枠で取引することをお勧めします。この場合、インジケーターが引く線の方向にトレードする方が良いです。
インジケーターの利点: 値を再描画しません。 すべての時間枠で取引されます。 すべての通貨ペアで取引されます。 スキャルピングまたは長期取引に使用できます。 セットアップはとても簡単です。 インジケーター設定: Indicator_

価格ピボットポイントインジケーター。インジケーターは、チャート上のポイントで、価格が反対方向に変わる可能性のある場所を示します。インジケーターが赤い点を描くとき、それは価格がその動きを下げることができることを意味します。インジケーターが青い点を描くと、価格が上昇する可能性があります。このインジケーターは、ロボットに統合することにより、手動取引と自動取引の両方に使用できます。これを行うために、インジケーターにはデータ交換バッファーがあります。
推奨される通貨ペア: XAUUSD EURUSD GBPUSD AUDUSD USD JPY USDCAD USDCHF DTCUSD 推奨される時間枠: M1 M5 M15 M30 H1 H4 D1 このインジケーターとの取引方法: 購入する。インジケーターがチャートに青い点を描き、バイトレードを開始するのを待っています。デポジットの10%以内にロットサイズを設定しました。利益を15ポイント獲得します。 TakeProfitによって取引が成立しなかったが、赤い点が表示された場合は、現在の取引を成立させます。 販売のため。インジケーターがチ
The Breakeven levels indicator is an indicator that, according to its algorithm of work, determines the number of open orders on a certain instrument finds the level at which all orders go from loss to profit. Separately, for sell and buy orders, the general level of the beginning of profit is found. In the lower left or right corner, information is displayed on three buttons to choose from. When you press the button, a horizontal line of a certain level is displayed on the screen. On the right

50% off. Original price: $60 Support and Resistance zones indicator for MT4 is a multi-timeframe panel and alert that finds support and resistance zones and pivot points for all timeframes of MetaTrader 4 and gives alert when price has interaction with them. Download demo version (works on GBPUSD, EURJPY and NZDUSD symbols) Read the full description of scanner parameters in the blog page . Many unique features in one indicator:
Integrating support and resistance zones and pivot points in one i

Resistance and Support is an easy to use indicator to apply horizontal lines of resistance and support. There are two windows for adding levels. When you press the button, a line appears on the price chart. It is possible to double-click this line with the mouse to activate and move it, thereby changing the indicator readings. In the indicator menu there is a choice of possible alerts - no alert, alert on touching the level an alert for closing the candle after the level.
FREE
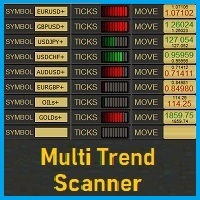
MultiTrend_Scanner is an indicator for the MT4 platform that is used to review trends on multiple symbols. We turn it on on any symbol, on any TF and we have a preview of the entire market. The current symbol is permanently assigned in the first segment of scanner. When adding another segment, you can manually enter any symbol. The quantity of added segments is unlimited. In each segment of a given symbol displayed are trends on different TFs. To calculate the strength of these trends are used
This indicator is based on the same famous fractal indicator with a slight difference:
MetaTrader version 5 click here
Advantages:
Works on all instruments and time series,
Does not redraw its results,
Comparison depth is adjustable,
Works well with any popular strategy,
Adjust the power of fractals
Input settings:
Number of comparisons - The number of candles that each side selects for comparison.
Marker distance from the candlestick
You can contact u
This indicator is based on ParabolicSAR. This indicator does not change the trend easily and does not change the trend until it receives a clause and approval. This indicator can be used for trail stop or trend detection.
MT5 Version
benefits:
Works on all instruments and time series,
Does not redraw its results,
Comparison depth is adjustable,
Works well with any popular strategy,
The power of the areas is adjustable,
We assure you that we welcome any
The Market Sessions Indicator for MT5 helps you predict market turnarounds by detecting major supply and demand areas. These pivot points tend to occur after a new session has started and the previous one is still open. It is also used to gauge how many points or pips the market moves on average during a session. This helps us to place better our take profits and stop losses. The indicator works on all forex pairs, gold, silver, commodities, stocks, indices and any other instrument that you

The Market Sessions Indicator for MT5 helps you predict market turnarounds by detecting major supply and demand areas. These pivot points tend to occur after a new session has started and the previous one is still open. It is also used to gauge how many points or pips the market moves on average during a session. This helps us to place better our take profits and stop losses. The indicator works on all forex pairs, gold, silver, commodities, stocks, indices and any other instrument that your
MT5 Version A versatile tool
You do not need any other tools with this tool.
You can enable or disable all indicators.
Their values are adjustable.
In the first line you will see a summary of your account status.
p: The amount of your profit or loss
BP: The amount of your daily profit based on the balance
EP: Equity daily earnings
WP: Your weekly profit
MP: Your monthly profit
The next line shows each of the time frames you selected.
Chikou: The Chikou process
KT: The trend of the K and T li

Indicator MT4 : DXMA(Direction index moving average)
Objective: To track price trends and price reversals.
How to set up Indicator DXMA : 1. The standard value is EMA 12 and EMA 26, you can set it as you like. 2. UTBx 14 is Universal Trend Boundary Index, standard value 14. 3. UTBx Method is a method for calculating the standard value is Exponential.
Meaning of symbols in indicators : 1. The line of the green group means the trend is up. 2. The line of the red group represents a down trend. 3
The Stochastic Dashboard is multi currencies and multi timeframes dashboards. It shows the Stochastic direction for the chosen pairs/timeframes. For the Stochastic lovers and manual trader this indicator is a most indicator which can be used to determine the market direction for the pair(s) you are trading. Set it to one chart only and monitor from one place all the charts you want.
PAX Simple Trend Signals for MT4
Самый простой и лёгкий в работе индикатор для торговли по сигналам разворота тренда. Зелёными и красными линиями на ценовом графике отображаются направления тренда — растущий и падающий соответственно. Стрелка вначале линии тренда сигнализирует о развороте тренда.
Если на трендовой линии появилась стрелка такого же цвета — это сигнал на открытие нового ордера. Если на трендовой линии появилась стрелка противоположного цвета — это сигнал на закрытия всех ордеро

NOTE!: The trend vote and the buy sell option shall match to the same direction before you put a trade!!
Indicator that uses Kalman filters (same as used on autonomous vehicles for data fusion between different sensors / technologies such as RADAR, LIDAR and Camera with Artificial Intelligence for object detection) by using the high and low price in order to identify buy and sell signals as indicated on the graph.
This indicator can be used on any timeframe with any currency or symbol.
This i
FREE
指標は、ボラティリティに基づいて自動的にチャート上の大きな影を検索して表示します。 影はさらに波のサイズによってフィルタリングされます。 このアルゴリズムは、指定された範囲の影によるフラクタル内訳を分析し、レベルを表示します。 設定では、複数通貨ダッシュボードを有効にすることができます。 アラートは、現在のスケジュールまたはダッシュボードシート全体の間で選択されます。 大きな影の信号とフラクタルレベルを突破した信号は、別々にオンにすることができます。 Blog-Link - Retest and Fake Breakout with UPD1 。
取引パターン: +トレンド別再テスト 。 +偽の内訳 。 +その他 。
EURUSD, GBPUSD, XAUUSD, ... M15, M30, H1 。
入力パラメータ 。
メイン 。 Bars Count – 表示するバーの数 。 ATR Period - ボラティリティを計算するローソク足の数 。 ATR Coeff Shadow (0 - Off) – シャドウサイズ係数(平均ボラティリティに対する) 。 ATR Co
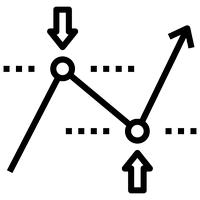
このインジケーターは、最適なテイクプロフィットとストップロスのレベルを表示します。これらのレベルは、履歴データに基づいて計算されます。最初の開始時に、インジケーターは履歴についてトレーニングされます。その後、彼は価格が将来このレベルまたはそのレベルを超える可能性を評価し、ストップオーダーを出すための最適なオプションを選択します。たとえば、利益が最大になり、価格がそのレベルに達する確率が可能な限り高くなるように、利益値を選択します。ストップロスレベルは最小限である必要がありますが、それに達する可能性は最小限である必要があります。これにより、勝つための数学的な期待値が可能な限り高いレベルになります。 また、このインジケーターは、サポートレベルとレジスタンスレベルの形で使用できます。これを行うには、さまざまな予測の長さとオフセットを組み合わせることができます。 インジケーターパラメーター: 長さ-予測の長さ。このパラメータは、バーの将来の取引の予想期間を示します。 Shift-バーをシフトします。このパラメーターのおかげで、過去のインジケーターの読み取り値を確認できます。 幅-線幅。 Cl
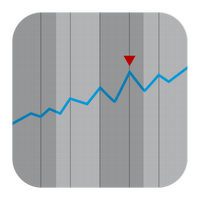
ハイパージオメトリックシリーズは、このフィルターの重み係数を計算するために使用されます。このアプローチにより、時系列のかなり興味深い平滑化を得ることができます。 超幾何フィルターの重みは、指数関数的および線形加重移動平均ほど速く減衰しませんが、平滑化された移動平均よりも速く減衰します。このため、このフィルターの動作は、移動平均の動作と多くの点で似ています。ただし、いくつかの利点があります。その遅れは移動平均のそれよりはるかに小さいです。しかし同時に、指数移動平均よりもはるかに多くの情報を保持します。このため、超幾何フィルターは、財務時系列の傾向と周期的コンポーネントをより適切に強調できます。したがって、この指標は、さまざまなタイプの移動平均を使用する取引戦略で使用できます。 インジケーターの動作は、単一のパラメーターに依存します。 iPeriod -このパラメータの有効な値は2-149です。 このパラメーターの値が小さいほど、インジケーターは最新の価格変動に強く反応します。このパラメータの値を大きくすると、長期的な傾向を強調することができます。さまざまなiPeriod値を使用したイン
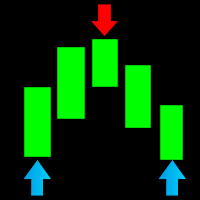
チャート上で価格反転ポイントを示すインジケーター。 RSIおよびその他の標準インジケーターを使用して、インジケーターは価格反転ポイントを決定し、矢印でチャートに表示します。インジケーターはその値を再描画せず、95%の場合に正確な信号を示します。このインジケーターは、すべての通貨ペアとすべての時間枠で機能します。
このインジケーターとの取引方法(推奨): 表示される矢印の方向に取引を開始することをお勧めします。青い矢印が表示されたら、購入注文を開きます。赤い矢印が表示された場合は、売り注文を開きます。 TakeProfitは、GBPUSD通貨ペアに平均15〜25ポイントを設定することをお勧めします。他のペアは個別に調べる必要があります。 StopLossはTakeProfitの2倍に設定されています。または、シグナルが反対方向に表示されたときに注文を閉じます。重要なニュースがリリースされる前に取引しないことをお勧めします。市場が予測不可能になるため、インジケーターが誤ったシグナルを出すことがあるのはこの期間中です。また、このインジケーターを既存のトレーディングシステムと組み合わせて

Multi-timeframe signal trend indicator.
Detects the trend direction and is colored in the corresponding color.
It has three different sensitivity options
Can show trend direction on other timeframes
Has embedded audible and visual alerts on trend reversals.
Can send notifications to your phone or email.
Allows trend and counter-trend trading.
Works on all timeframes, all currency pairs, metals, indices and cryptocurrency.
It can be used for binary options.
Distinctive features No re-d

RSI divergence indicator finds divergences between price chart and RSI indicator and informs you with alerts (popup, mobile notification or email). Its main use is to find trend reversals in the chart. Always use the divergence indicators with other technical assets like support resistance zones, candlestick patterns and price action to have a higher possibility to find trend reversals. Three confirmation type for RSI divergences: RSI line cross 50 level (doesn't repaint) Price returns to
FREE

RSI Signals is a simple dashboard type indicator that displays the values of the RSI (Relative Strength Index) oscillator on various instruments and time frames chosen by the user. In addition, it can be configured by the trader to show signals when the RSI is in an overbought/oversold condition, when it crosses these levels or when it crosses the 50 level, which is important in some strategies. It is simple and easy to set up. By itself, it should not be used as a trading system since RSI signa

Developed methods for trading collected in one indicator. In the form of arrows, it defines entries in the direction of the trend.
It has 2 types of arrows - trend and signal guides, informing about the potential movement in the direction of the trend.
Works without redrawing, ready for use on all symbols/tools.
The most suitable time frames to use are M15, M30, H1, H4.
How to use
The indicator finds the direction of the trend in the form of a signal arrow, a graphic rectangle stretches along

. Simple Trading System Update !!! Follow this link to see our Strategy !!! (With auto trade indicator)
Description This is an indicator Free Version and showing only history signals, Not real time. Binary Deal Trading Indicator is an indicator on MT4 for Binary Option Trading. It forecasts the overbought / oversold level, Reversal and Fractal point. This indicator will help you to decide a reversal price on any time frame (Recommend M1, M5 and M15). The expiry time is 5-15 minutes after rec
FREE
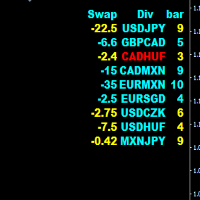
Divergence HiLo scaner is a good tool for market analysis. The indicator looks through all currency pairs and finds those that meet the selection conditions, where corrections or reversals to the main movements are supposed to begin. The indicator values are entered in the final table. 1 value is swap 2 Currency pair. 3 The number of bars after finding the selection conditions. The bar color blue is used for the buy signal. The bar color yellow is used for the sell signal. The color of the

Would you like to learn a technical system refined by centuries of use, but virtually unknown here? A system so versatile that it can be fused with any other indicator/technical tool? A system as pleasurable to use as it is powerful? If so, this indicator which scans candlestick charting techniques is for you. You should find it valuable no matter what your background in technical analysis. This trading system has been designed after years of hard work and back testing. Indicator will find stro
MTF Update will be soon
Price Increase Soon, It just Off price only for first 10 copies. ZigZag Breakout Arrow Very high accurate buy and sell signals provide , you can also use as market reverse signal or Trend change alert Features. ZigZag Parameters changeable. Alerts. Buy and Sell Signal. ZigZag Breakout on candle close or candle high price. and MTF Update will coming soon.

This is a multi time frame demand and supply indicator for MT4 platform. You can use multi time frame demand and supply levels on smaller time frames. Additionally you can choose to kill every level has has been tested. you have narrow bands that is you can select the whole demand and supply level or just a narrow section Finally, you also get price range for the zones. Awesome
FREE

Fibonacci retracements are trend lines drawn between two significant points, usually between absolute lows and absolute highs, plotted on a chart. Intersecting horizontal lines are placed at the Fibonacci levels. Fibonacci retracements are useful tools that help traders identify support and resistance levels. With the information gathered, they can place orders, identify stop-loss levels, and set price targets. Although useful, traders often use other indicators to make more accurate assessments

Scalping Code is for trend scalping. It is simple to use and is profitable. It can work on any time frame and any asset. This indicator can be used on it's own or together with another system. The arrow does not repaint or recalculate.
The rules are as follows: A blue arrow above the moving average is a buy. An exit for the buy above the moving average is a red arrow or target. A red arrow below the moving average is a sell. An exit for the red below the moving average is a blue arrow

取引を強化し、新しいRSIスキャナーのバージョンでさらなる興奮を追加しましょう! 自動的なインストゥルメントのグループ化 : スキャナーは、マーケットウォッチからすべてのインストゥルメントを自動的に収集し、主要(Majors)、副次(Minors)、エキゾチック(Exotics)、その他(Others)の4つのカテゴリに整理します。 カスタマイズ可能な信号選択 : 設定ページで、信号をスキャンしたいインストゥルメントを選択できます。 柔軟な時間枠の選択 : 信号を監視したい時間枠を指定することもできます。 RSIパラメータの設定 : RSIパラメータ(期間と適用価格)を簡単に設定し、売買レベルを定義できます。現在のキャンドルデータを使用するか、キャンドルが閉じるのを待ってから信号を処理するかを選択できます。 個別のカラーカスタマイズ : 前景、背景、買い矢印、売り矢印の色をカスタマイズできます。スキャナーは、各要素の色を自動的に調整して、視覚的に魅力的なインターフェースを作成します。 矢印タイプの選択 : 好みに合わせてさまざまな矢印タイプを選択できます。 リアルタイムアラート : 選
FREE
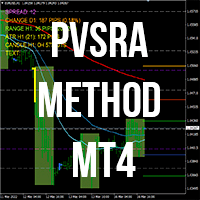
PVSRA取引方法。このシステムは、大規模なプレーヤーの位置の方向を計算することに基づいており、そこで彼らは位置を獲得します。
PVSRAは略語です:P-価格(価格)、V-ボリューム(ボリューム)、S-サポート(サポート)、R-抵抗(抵抗)、A-分析(分析)。
PVSRAメソッドは、ラウンド価格レベル(たとえば、1.2000)と中間レベル(たとえば、1.2250、1.2750)を使用します。ラウンドレベルより下の統合はロングポジションの準備であり、レベルより上の統合はショートポジションの準備です。
インジケーターは次のもので構成されます。 3つの移動平均-トレンドの方向とホバーの角度を示します ボリューム-黄色は、キャンドルのボリュームが現在のTFの前の10個のキャンドルの平均ボリュームの150%以上である状況を示します。青色は音量が300%未満になったときであり、ポジションを終了することを検討する価値があります ラウンド、中級、ピボットレベル-両方を使用することも、一方を無効にすることもできます 取引セッションインジケーター-取引時間は設定可能
エントリールール:

この指標を使用すると、完全な自由を感じることができ、何時間も取引で水を探したり、ストップロスを推測したり、利益レベルを取得したりする必要がなくなります。今ではすべてがシンプルになりました。このシステムは、当時人気のあった2つの戦略であるタートルシステムとPVRSAに触発されています。私は両方の長所を生かして、この素晴らしい指標を作成しました。
取引ルール: 赤いバーはボリュームの増加を意味し、市場に参入する機会を探す必要があります 明確な信号がある場合は、矢印が表示されます-その方向に位置を開くことができます 黄色のチャネルラインのすぐ上に初期ストップロスを設定しました 白いバーは取引を成立させる時が来たことを意味し、チャネルの赤い線は出口点として機能することができます

スキャルピングインジケーター。ポイントはチャート上の価格反転場所を示します。再描画されません。最小遅延。 M1、M5、M30、H1、H4の時間枠で動作します。すべての通貨ペアで作業できます。インジケーターは、金、銀、暗号通貨でも機能します。このインジケーターは、バイナリーオプションにも使用できます。
取引方法(GBPUSDの戦略の例)? 青い点が表示されたら購入します。 赤い点が表示されたら、売ります。 TakeProfitは25ポイントに設定されています。 StopLossは35ポイントを設定しました。 TrelingStopは15ピップに設定されています。 インジケーターの利点: M1の時間枠で取引 すべての通貨ペアで機能します 暗号通貨で動作することができます 金属に取り組むことができます 再描画されません 結果に影響を与えない遅延はほとんどありません 非常に使いやすい インジケーター設定: period-反転ポイントを計算するための決済期間を指定します。 bars-インジケーターを表示するチャート上のバーの数を指定します。

Ready trading system. The indicator arrow shows when and in what direction you need to open an order. At the end of the blue rectangle we put TakeProfit, and at the end of the red rectangle we put StopLoss. The indicator calculates the size of TakeProfit and StopLoss automatically, depending on the market volatility and the probability of price direction. Therefore, the indicator does all the work instead of the trader. He analyzes the market himself, determines the distance for TakeProfit and

The "Spread Monitor" indicator allows you to analyze the spread change during the day, control the expansion of the spread by your broker and has a number of interesting additional features Choosing a broker with a minimum spread value is very important for the work of night advisors, scalping and intraday trading.
However, the MT4 terminal does not store spread data, so the multifunctional "Spread Monitor" indicator will be useful for any intraday trader. Features:
The indicator shows the curr

Trend indicator Trend Esay MTF is an indicator that draws arrows directly on the price chart. Like every trend indicator, it works well with good price movement and worse in a flat. A feature of this indicator is the ability to send alerts both in the terminal and on a smartphone. The indicator menu contains the number of bars in the history of the indicator and period value for determining the trend. The "trend" function has been added to the indicator menu, which filters the indicator signals
FREE

Target Striking - One of the best binary options trading tools!
It is set up so powerfully that you can trade not only on currency pairs, but also on raw gold oil!
You can also try on cryptocurrency!
Ideal for trading on currency pairs, the percentage of reliable transactions is more than + 75%
The trading tool is already set for the best profit!
Only Target Striking can unlock the potential of the trading market for you!
With it, the signals are even and accurate without redrawing, a sig

CHART OBJECTS: Blue box : Bullish Order Blocks (OB) Red box : Bearish OB Orange box : Mitigated OB. Price bounce from this area the made a new high/low Light gray box : Price bounced from this area but did not made a new high/low Dark gray box : Broken OB. Filled boxes : TimeFrame 1 Order Blocks
Unfilled boxes : TimeFrame 2 Order Blocks
INDICATOR SETTINGS: Order Block Required Length: Required number of subsequent candles in the same direction to identify Order Block. Default value: 5 Imba

About Scanner:
Detailed blog post is here: https://www.mql5.com/en/blogs/post/749119
BB Squeeze Scanner uses bbsqueeze.ex4 in background to calculate when BB Squeeze (Bollinger Bands Squeeze) happens and when BBands expand. It is attached with the above blog post.
What is Bollinger Bands Squeeze:
The Bollinger bands squeeze is a special pattern when the volatility of a market decreases after trending periods. It is generally observed the price is ranging during this period until a new t

The ' Renko Brick Arrows ' indicator was developed to showcase the traditional renko brick grid pricing on chart. An alternative to using an offline chart generator for renko grid prices, and a unique charting style to strategize.
Key Features Renko bricks are drawn over the chart without having to generate a new chart. Optional horizontal lines shows where the next arrows are supposed to appear. Both one and two step reversals are available to draw arrows for buy and sell.
Input Parameters Gr

IMPORTANT; Price is subject to rise at any time from now! Do not miss this offer! Dear trader I am glad to introduce my new tool called Trend Analyser Dashboard to you. The design, style, and settings of this indicator have been made simple to make its users not take too much time in understanding the indicator itself. The purpose is to help traders in analysing the direction of the major trend and the status of the trend whether in weak trend or its strong trend. The indicator will also prov

Improve trading with this indicator. Find areas of buys or sells in Fibonacci retracement areas. Fulltrend is for scalping and making swing trades. Fib levels are added for take profits and stop losses. This works on any time frame and can be used by itself or together with other systems and indicators for filters. The indicator doesn't repaint. Alerts are added and can be true or false. No need to sit glued to the computer, just set on charts and listen or the alerts to come. Take a posi
このフィルターはベッセル多項式に基づいています。その主な利点は、わずかな時間遅延です。このフィルターのもう1つの機能は、財務時系列の最新の値に対する感度が高いことです。このため、インジケーターは、ノイズの偏差を滑らかにしながら、アクティブな価格変動を強調表示します。 古典的な変形に加えて、ベッセル係数の対数が重み関数としてインジケーターに追加されました。この場合、インジケーターはより滑らかになりますが、同時に価格が活発に動くと遅れる可能性があります。 ベッセル多項式を計算するときは、階乗が使用されます。このため、インジケーターの期間は上下から制限されます。通常のベッセルフィルターを使用する場合は、インジケーターの短い周期に注意することをお勧めします。期間が長くなると、インジケーターの動作がますます安定し、違いが目立たなくなります。 図は、両方のフィルタータイプの動作を示しています。 インジケーターパラメーター: TypeFilter-通常/対数フィルタータイプの選択 iPeriod-インジケーター期間、有効な値3-85。

高度なトレンドフィルタリングとアラート表示を備えたMACDオシレーター。トレンドを決定し、弱いトレンドを除外し、トレンドの新しい強さを示します。 MACDオシレーターは、任意の時間枠とすべてのシンボル(通貨、インデックス、石油、金属、株式、オプション、オフライン練行足チャート)で動作します 1.ユーザーはMACD値を変更できます。 2.最小MACDレベルフィルター、 3.除算値は、チャートでトレンド変化の表示が必要な電力比を除外します。 4.バッファ値には、トレンドが変更された後にアラートを通知するための追加のMacd値の移動を提供する追加のフィルターがあります。 5.アラートは、追加のメッセージポップアップに対してTrueまたはFalseを選択できます。 このバージョンはトレードエントリーシグナル用であり、どのチャートでもMACDのさまざまなレベルチェックを使用してトレンドが変化します トレードを終了する場合、ユーザーはトレードの終了に必要な独自のトレーリングストップロスを使用できます。 推奨されるチャートの時間枠は、練行足の価格枠でH1、H4、D1および同等のチャートです。 あな
D1 Free Fibo Channels with support and resistences...
Become a constantly profitable 5-star forex trader!
We offer a few indicators to support you understand and analyse the market! With our strategies you will improve your trading system and bacome an expert...
We have indicators for trend direction, market direction and others.. for multi-time frames and that covers all majors or your favorite trading symbols! Some of them offer a customizable calculation parameters... or Graph features!
FREE
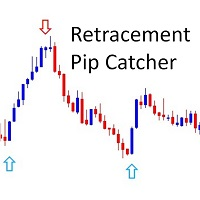
!! FLASH SALE !! Over 80% off !! For ONE week only. Now only $47 - normally $297! >>> Ends on 30 June 2023 - Don't miss it!
Buy and Sell Arrows when price is about to retrace. It Also Sends Alerts – On MT4 To Your Phone To Your Email
Does not repaint.
Works ony any pair, any timeframe.
10 Activations allowed so you are free from limitations
See an example of alerts from today (23 May 2020) using this and 2 more of my indicators here . MT5 Version here . Spreads from 0.1pip RAW
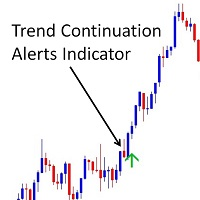
!! FLASH SALE !! Over 80% off !! Now only $47 - normally $297!
Buy and sell arrows on the chart when the trend is about to continue. Aslo Sends Alerts – On MT4 To Your Phone To Your Email.
Does not repaint.
Works on any pair, any timeframe. (Just ajust the settings for your pair and timeframe.)
10 Activations allowed so you are free from limitations
See an example of alerts from today (23 May 2020) using this and 2 other indicators here . MT5 version here .
Spreads from 0.1pip RAW/
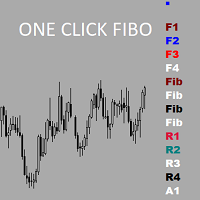
Утилита предназначена для упрощения графического анализа.Настроив один раз , можно сохранить в шаблон,все настройки сохранятся.В настройках меняются уровни фибоначчи , цвета,стили и толщина линий также текстовые метки на кнопках.Есть возможность расширить функционал , добавить временные зоны Фибоначчи ,Фибо арки ,линии по углу ,продление прямоугольных зон до текущей цены.Присылайте рекомендации,все можно осуществить в рамках бесплатной утилиты.
FREE

The indicator helps to determine the potential for price movement within the day and on a trend. For calculations, the average price movement on the instrument is used. If you have a problem setting TP, the indicator allows you not to overestimate your expectations. For volatile instruments, the SL position can also be taken into account. If the entry was in the right place, the risk / reward ratio will prompt a profitable level for profit taking. There is a reset button at the bottom of the sc
FREE
MT4に表示している同一通貨ペアのチャート上で、水平線や垂直線、トレンドラインなどのオブジェクトを同期します。 このインジケーターを使うと、1つの時間足で作成した水平線などのオブジェクトが、同一通貨ペアの他のチャートにも同じオブジェクトが作成されるようになります。また、作成後の移動、プロパティ変更、削除なども同期することができます。
チャートオブジェクトが同期されるケース
・チャートオブジェクトの作成 ・チャートオブジェクトのスタイル変更(色、太さなど) ・チャートオブジェクトの移動 ・チャートオブジェクトの削除
対応しているチャートオブジェクト
以下24のオブジェクトに対応しています。 ・水平線
・垂直線
・トレンドライン
・平行チャネル
・フィボナッチリトレースメント
・フィボナッチ・エクスパンション
・フィボナッチ・チャネル
・フィボナッチ・タイムゾーン
・フィボナッチ・ファン
・フィボナッチ・アーク
・角度によるトレンドライン
・アンドリューズ・ピットフォーク
・標準偏差チャネル
・線形回帰チャネル
・サイクルライン
・三角形
・長方形
・楕円
・ギャン・ライン
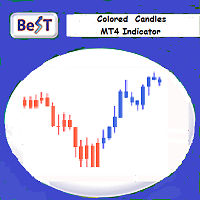
BeST_Colored Candles is an MT4 FREE indicator that can change the color of the Candlesticks based on the MACD, SAR or RSI values and levels. It is a Composite indicator that by selection uses the values each one of these 3 indicators and their critical levels in order to create numerical relationships that when satisfied cause their corresponding candlesticks coloration.
Input parameters
== Basic Settings
-- Please Select Indicator - for selecting which one of the above 3 indicators
FREE

[ MT5 Version ] Ultimate Alpha Trend MT4
Ultimate Alpha Trend is the first trend indicator, which combines volatility, volume, average price and momentum. The results is a highly versatile representation of trendy and sideways market conditions, highlighting, at the same time, significant supply and demand levels. The Ultimate Alpha Trend indicator can be used to find entry oportunities and to set SLs taking into consideration current market volatility, volume and momentum. Besides that, the ind
MetaTraderマーケットは、履歴データを使ったテストと最適化のための無料のデモ自動売買ロボットをダウンロードできる唯一のストアです。
アプリ概要と他のカスタマーからのレビューをご覧になり、ターミナルにダウンロードし、購入する前に自動売買ロボットをテストしてください。完全に無料でアプリをテストできるのはMetaTraderマーケットだけです。
取引の機会を逃しています。
- 無料取引アプリ
- 8千を超えるシグナルをコピー
- 金融ニュースで金融マーケットを探索
新規登録
ログイン