Big Figure Indicator MT5
- Indicatori
-
Vonjinirina Alfred Randrianiaina
 Hi, i am Randrianiaina Vonjinirina Alfred
- MQL4 Developer
- MQL5 Developer
- Independent Trader
Email : vonjydev@gmail.com
vonjyalfred02@gmail.com
Visit my store to check all my products : - Versione: 1.2
- Aggiornato: 10 aprile 2023
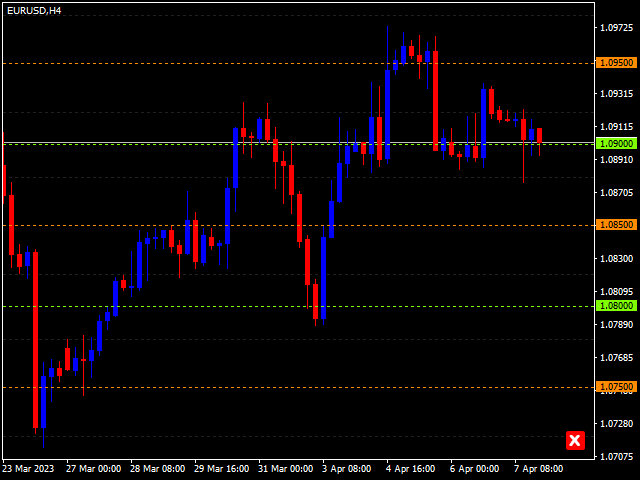
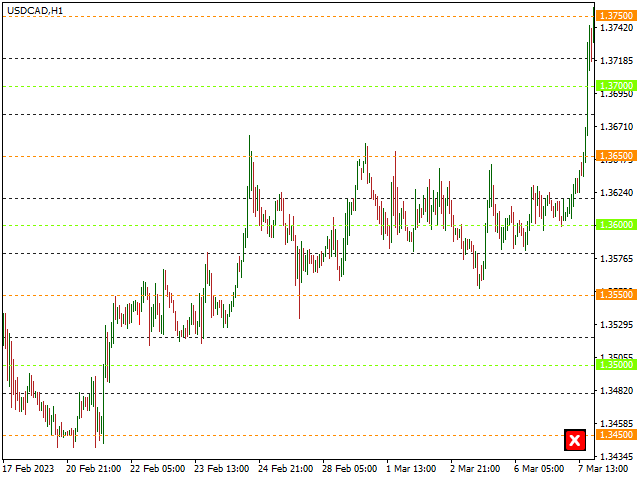
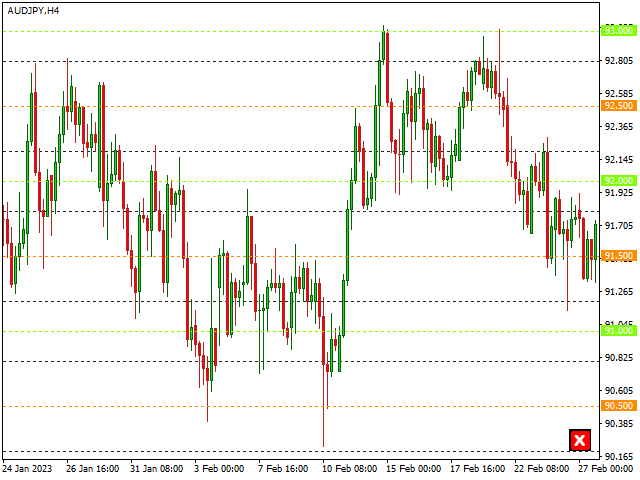
Il "BIG FIGURE INDICATOR" identifica automaticamente e traccia linee orizzontali sui grafici di prezzo a livelli specifici, come numeri interi o numeri decimali (ad esempio 1.0000 o 1.5000 nel trading di valute). Questi livelli sono considerati psicologicamente significativi perché rappresentano numeri rotondi su cui i grandi trader e gli investitori possono concentrarsi, portando a potenziali livelli di supporto o resistenza. L'indicatore della grande cifra può aiutare i trader a identificare importanti livelli di prezzo e a prendere decisioni di trading basate su questi livelli.
-
Le linee sono visibili solo tra il grafico TIMEFRAME M1 e H8
-
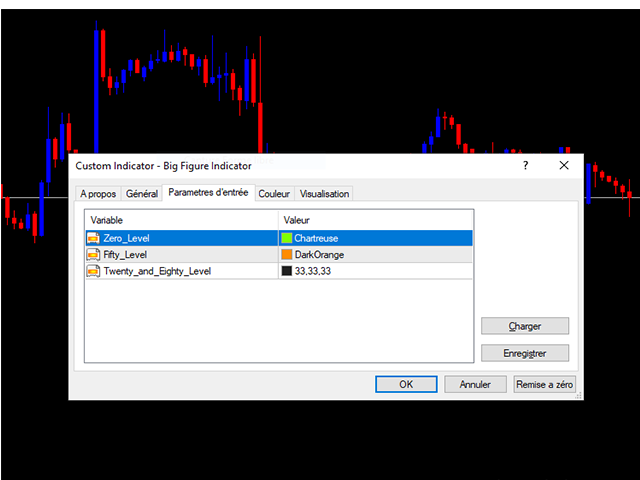
Il colore delle linee può essere cambiato nella scheda dei parametri di input
-
Può essere utilizzato con tutte le coppie di valute
Versione MT4: https://www.mql5.com/fr/market/product/96747
NOTA: È necessario caricare prima il grafico Daily (D1) per il miglior funzionamento del nostro indicatore.


Отличный