MACD by MK

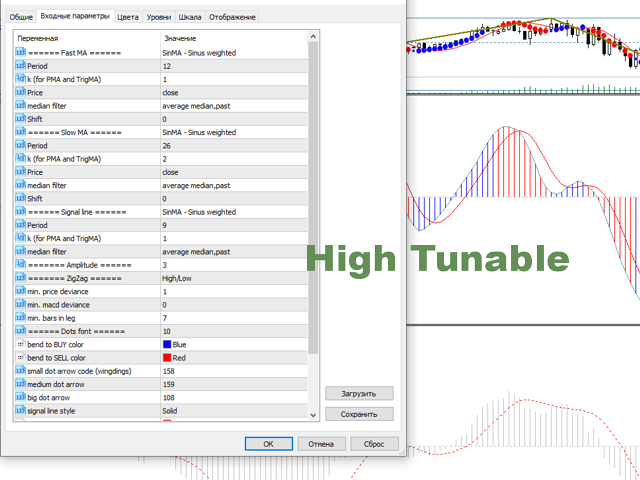
Use the opportunities of the MACD with maximum efficiency. Choose the price, filters and averaging method, all possible parameters. A unique feature of "MACD by MK"is the amplified signal line. The bends of the indicator have color designations and are additionally reflected on the main chart. By correlating them and the initial price, make your trading more qualitative. For ease of use, a neat ZigZag has been added

A remarkable property of "MACD by MK" is the detection of motion attenuation. As soon as the sales are completed, it is worth considering the possibility of buying. And vice versa. The indicator highlights these points very well.

Like the classic MACD, this indicator is based on a comparison of two averages. You can choose the average from a wide number of options:

  • the usual SMA,LWMA, EMA
  • indicators FraMA,DEMA, TMA
  • weighted Parabolic (weight~n^k), Sinus Weighted (weight~sin (n)^k)
  • Volume weighted(weight~volume (n)^k)
  • weighted by exponential coefficients (weight~exp(n))

As the source data, you can choose the prices of the usual candles or Heiken-Ashi candles, set the filtering method:
  • the average of the last values of the
  • median filter
  • and their combinations
Additionally, you can specify the signal amplitude:
  • at an amplitude of 1, the MACD on the main chart coincides with the fast MA
  • at large values has a larger scope.
  • accordingly, at the amplitude of 0, everything will coincide with the slow MA on the main chart

By default, the amplitude is 2.

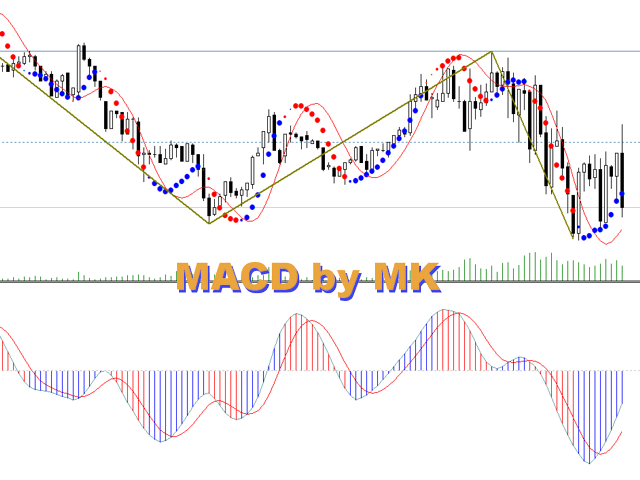
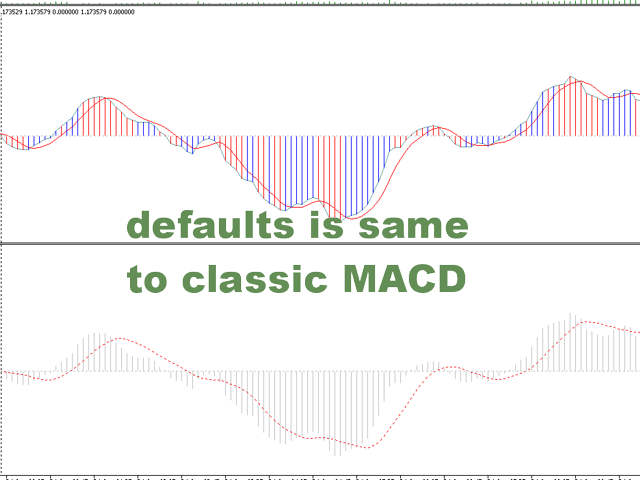
The "MACD by MK" indicator looks generally similar to the MACD and displays the difference between the two averages and its smoothed value (signal line).

The colors of the histogram indicate the direction of the signal line bend. Blue means that purchases are accelerating and sales are slowing down. That is, the signal line has an upward bend. Red on the contrary-in favor of sales

The main chart displays :

  • dots are the strengthened values of the MACD. The color and size show the bending directions and stability
  • line - enhanced signal line MACD
  • zigzag - trend zigzag at prices, based on the indicator readings

Trading recommendations

Use the ZigZag as the trend direction

You enter the trend based on the color of the points and the position of the price relative to the signal line

Take into account the volatility of the symbol and the trading schedule

Good luck !


Prodotti consigliati
MACDivergence MTF MT5
Pavel Zamoshnikov
4 (5)
Advanced ideas of the popular MACD indicator: It detects and displays classic and reverse divergences (two methods of detecting divergences). It uses different color to highlight an uptrend and a downtrend. Two methods of determining a trend: а) MACD crosses the 0 level (classic signal); б) MACD crosses its own average (early signal). This is a multi-timeframe indicator: it can display MACD data from other timeframes. Two methods of drawing: classic histogram and line. It generates sound and vis
Cvd Divergence
Thalles Nascimento De Carvalho
CVD Divergence – Analisi Professionale del Flusso Ordini e delle Divergenze CVD Divergence è un indicatore tecnico progettato per rilevare divergenze affidabili tra il prezzo e il Cumulative Delta Volume (CVD). Identifica con precisione i momenti in cui il flusso reale degli ordini non conferma il movimento del prezzo, rivelando possibili inversioni, esaurimento del momentum e manipolazioni istituzionali. L’indicatore combina la lettura del volume aggressivo con l’analisi strutturale del prezzo,
TRI Visualizer
Yoshimi Mon 三 Ura
TRI Visualizer MT5 – Thermodynamic Market Analysis Overview The TRI (Thermal Range Indicator) Visualizer Enhanced is a rare market analysis indicator that goes beyond conventional technical analysis, applying principles of thermodynamics from physics. It interprets market price fluctuations as “thermodynamic energy,” enabling the highly accurate detection of subtle market changes that are often overlooked. Innovative Mechanisms 1. Dual Calculation Engines Classic TRI Mode Formula: |Close
Gekko MACD Plus
Rodrigo Galeote
3 (3)
Type: Oscillator This is Gekko's Cutomized Moving Average Convergence/Divergence (MACD), a customized version of the famous MACD indicator. Use the regular MACD and take advantage of several entry signals calculations and different ways of being alerted whenever there is potential entry point. Inputs Fast MA Period: Period for the MACD's Fast Moving Average (default 12); Slow MA Period: Period for the MACD's Slow Moving Average (default 26); Signal Average Offset Period: Period for the Signal A
FXC iMACD-DivergencE MT5 Indicator This is an advanced MACD indicator that finds trend-turn divergences on the current symbol. The indicator detects divergence between the MACD and the price movements as a strong trend-turn pattern. Main features: Advanced divergence settings Price based on Close, Open or High/Low prices Give Buy/Sell open signals PUSH notifications E-mail sending Pop-up alert Customizeable Information panel Input parameters: MACD Fast-EMA: The Fast-EMA variable of the MACD indi
The "MR Volume Profile Rectangles 5" indicator is a charting tool that displays trading volume at different price levels rather than time intervals. A key concept in volume profile is the point of control (POC) —the price level with the highest volume traded during the session or time range. While tools like VWAP or OBV provide volume trends, the "MR Volume Profile Rectangles 5" indicator offers granular detail about where the most market activity occurs at specific price levels. This makes it a
The Trend Duration Forecast MT5 indicator is designed to estimate the probable lifespan of a bullish or bearish trend. Using a Hull Moving Average (HMA) to detect directional shifts, it tracks the duration of each historical trend and calculates an average to forecast how long the current trend is statistically likely to continue. This allows traders to visualize both real-time trend strength and potential exhaustion zones with exceptional clarity. KEY FEATURES Dynamic Trend Detection:   Utiliz
Owl Smart Levels MT5
Sergey Ermolov
4.03 (32)
Versione MT4  |  FAQ L' indicatore Owl Smart Levels è un sistema di trading completo all'interno dell'unico indicatore che include strumenti di analisi di mercato popolari come i frattali avanzati di Bill Williams , Valable ZigZag che costruisce la corretta struttura a onde del mercato, e i livelli di Fibonacci che segnano i livelli esatti di entrata nel mercato e luoghi per prendere profitti. Descrizione dettagliata della strategia Istruzioni per lavorare con l'indicatore Consulente-assistente
The Optimized MACD Divergence indicator is a powerful tool designed to identify potential trading opportunities by detecting divergences between price action and the MACD indicator. It combines classic divergence analysis with candlestick pattern recognition and volume filtering to provide more accurate and reliable signals. How it Works The indicator operates on the following principles: MACD Calculation:   It calculates the MACD indicator using user-defined parameters for fast EMA, slow EMA,
Indicatore Crypto_Forex "WPR con 2 Medie Mobili" per MT5, senza ridisegno. - WPR è uno dei migliori oscillatori per lo scalping. - L'indicatore "WPR e 2 Medie Mobili" consente di visualizzare le medie mobili veloci e lente dell'oscillatore WPR. - L'indicatore offre l'opportunità di visualizzare le correzioni di prezzo molto presto. - È molto facile impostare questo indicatore tramite parametri e può essere utilizzato su qualsiasi timeframe. - È possibile visualizzare le condizioni di ingresso
Rainbow EA MT5
Jamal El Alama
Description : Rainbow EA MT5 is a simple Expert advisor based on   Rainbow MT5 indicator witch is based on Moving average with period 34. The indicator is incorporated in the EA, therefore, it is not required for the EA to operate, but if you wish, you can download it from   my product page . The Expert Advisor settings are as follows : Suitable for Timeframes up to H1 The parameters below can be set according to your trading rules. StopLoss ( Stop Loss in pips) TakeProfit ( Take Profit in pips
MetaCOT 2 is a set of indicators and specialized utilities for the analysis of the U.S. Commodity Futures Trading Commission reports. Thanks to the reports issued by the Commission, it is possible to analyze the size and direction of the positions of the major market participants, which brings the long-term price prediction accuracy to a new higher-quality level, inaccessible to most traders. These indicators, related to the fundamental analysis, can also be used as an effective long-term filter
Price Magnet — Price Density and Attraction Levels Indicator Price Magnet is a professional analytical tool designed to identify key support and resistance levels based on statistical Price Density. The indicator analyzes a specified historical period and detects price levels where the market spent the most time. These zones act as “magnets,” attracting price action or forming a structural base for potential reversals. Unlike traditional Volume Profile tools, Price Magnet focuses on price-time d
FXC iDeM-DivergencE MT5 Indicator This is an advanced DeMarker indicator that finds trend-turn divergences on the current symbol. The indicator detects divergence between the DeMarker and the price movements as a strong trend-turn pattern. Main features: Advanced divergence settings Price based on Close, Open or High/Low prices Give Buy/Sell open signals PUSH notifications E-mail sending Pop-up alert Customizeable Information panel Input parameters: DeM Period: The Period size of the DeMarker in
RSI MultiTF
Mael Francois Claude Deman
RSI-MULTI – Multi-Timeframe Trend & Volatility Indicator Description: RSI-MULTI is a powerful monitoring tool based on the Money Flow Index (MFI), specifically designed for   swing traders . It allows you to analyze   trend direction and volatility across multiple timeframes simultaneously , without switching between charts. Thanks to a clear and intuitive visual interface (built-in HUD), MFI-MULTI displays: The trend direction per timeframe , calculated from the   average angle of the
The RSI Divergence + FVG Signal indicator combines Relative Strength Index (RSI) Divergence with Fair Value Gap (FVG) detection to generate high-probability buy and sell signals based on both momentum shifts and institutional imbalance zones. Core Features: RSI Divergence Detection : Identifies both regular and hidden bullish/bearish divergences between price and RSI. Divergences indicate potential trend reversals or continuation. FVG Zone Recognition : Detects Fair Value Gaps (imbalances caused
The Gann Box (or Gann Square) is a market analysis method based on the "Mathematical formula for market predictions" article by W.D. Gann. This indicator can plot three models of Squares: 90, 52(104), 144. There are six variants of grids and two variants of arcs. You can plot multiple squares on one chart simultaneously Parameters Square — selection of a Gann square model: 90 — square of 90 (or square of nine); 52 (104) — square of 52 (or 104); 144 — universal square of 144; 144 (full) — "full
MACD Pro Master
Itumeleng Mohlouwa Kgotso Tladi
MACD Pro Master The MACD Pro Master is your ultimate trading companion, designed to revolutionize your financial journey and unlock the doors to wealth. Here's why it's the next best thing since sliced bread: Advantages Precision Trading : The MACD Pro Master leverages the powerful Moving Average Convergence Divergence (MACD) indicator to provide accurate buy and sell trades,  ensuring you capitalize on every market opportunity. Customizable Settings : Tailor the trading strategy to your unique
STRICTLY FOR BOOM INDEX ONLY!!!!! Here I bring the Maximum Trend Arrows OT1.0 MT5 indicator. This indicator is made up of a combination of different trend indicators for entries and exits, for entries an orange arrow will paint on the chart below the current market and a red flag for closing of trades and it produces buy arrows only. When the orange arrow appears, it will appear along with it's sound to notify you. The 1H timeframe is recommended, don't use it anywhere else than on the 1H timefr
Pattern DejaVu
Andriy Konovalov
This indicator predicts the nearest bars of the chart based on the search of up to three best coincided patterns (a sequence of bars of a given length) in the history of the current instrument of the current timeframe. The found patterns are aligned with the current pattern at the   opening price   of the current (last) bar. The predicted bars are bars following immediately for patterns found in history. Pattern search is performed once every time a new bar of the current timeframe opens. The i
Unlock profitable buy setups with the DC Dynamic Scalping Indicator for Crash , purpose-built for consistent scalping and small account growth. This expertly crafted, non-repainting indicator detects optimal buy signals on Crash indices , ensuring you're in sync with the trend thanks to the built-in Dynamic Trend Filter . A clean blue background template is also included for seamless charting and visual clarity. Key Features: Trend-Based Signal Logic – The Dynamic Trend Filter ensures all b
Innanzitutto, vale la pena sottolineare che questo Strumento di Trading è un Indicatore Non-Ridipingente, Non-Ridisegnante e Non-Laggante, il che lo rende ideale per il trading professionale. Corso online, manuale utente e demo. L'Indicatore Smart Price Action Concepts è uno strumento molto potente sia per i nuovi che per i trader esperti. Racchiude più di 20 utili indicatori in uno solo, combinando idee di trading avanzate come l'Analisi del Trader del Circolo Interno e le Strategie di Tradin
Terra Infinity is a flat indicator. This improved version of the CalcFlat indicator has three additional lines that significantly increase its effectiveness. Unlike its predecessor with two static levels, Terra Infinity adds three dynamic lines above the main histogram, which are interpreted as follows: base signal line, minimum signal line, maximum signal line. These lines are formed using the additional parameter Avg, which is the average value of the histogram. Averaging produces a line cl
Vict Channel
Tatiana Savkevych
Victory Channel is a forex trend arrow indicator for identifying potential entry points. I like it, first of all, because it has a simple mechanism of work, adaptation to all time periods and trading tactics. Created on the basis of a regression channel with filters. We display the signals of the Victory Channel indicator on the chart of the price function using a mathematical approach. How it works - when the price breaks through the overbought/oversold zone (channel levels), a buy or sell si
Noize Absorption Index - is the manual trading system that measures the difference of pressure between bears forces and bulls forces. Green line - is a noize free index that showing curent situation. Zero value of index shows totally choppy/flat market.Values above zero level shows how powerfull bullish wave is and values below zero measures bearish forces.Up arrow appears on bearish market when it's ready to reverse, dn arrow appears on weak bullish market, as a result of reverse expectation.
Monster Harmonics Indicator is a harmonic pattern indicator. It recognizes Gartley, Bat, Crab, Butterfly, Cypher, White Swan, Black Swan, Shark and AB=CD patterns. Projected patterns that are not yet completed are recognized, too. Monster even shows the PRZ (Potential Reversal Zone). Users can add their own user defined patterns to Monster. Besides the current pattern, Monster also shows all patterns in the symbols history. Monster will provide alerts for developing patterns. Introduced by H.M.
Max Min Delta Indicator - Market Volume Imbalance Analysis Gain Deeper Insights into Market Volume Imbalance with Delta Analysis What is the Max Min Delta Indicator? The Max Min Delta Indicator is a powerful market volume analysis tool that visually represents maximum and minimum delta values using a histogram. It helps traders identify market strength, weakness, absorption, and aggressive buying/selling activity with precision. Key Features Histogram Visualization: Displays Max Delta (Green) an
L'indicatore costruisce le quotazioni attuali, che possono essere confrontate con quelle storiche e su questa base fanno una previsione del movimento dei prezzi. L'indicatore ha un campo di testo per una rapida navigazione fino alla data desiderata. Opzioni: Simbolo - selezione del simbolo che visualizzerà l'indicatore; SymbolPeriod - selezione del periodo da cui l'indicatore prenderà i dati; IndicatorColor - colore dell'indicatore; HorisontalShift - spostamento delle virgolette disegnate d
Il livello Premium è un indicatore unico con una precisione superiore all'80% delle previsioni corrette! Questo indicatore è stato testato dai migliori Specialisti di Trading per più di due mesi! L'indicatore dell'autore che non troverai da nessun'altra parte! Dagli screenshot puoi vedere di persona la precisione di questo strumento! 1 è ottimo per il trading di opzioni binarie con un tempo di scadenza di 1 candela. 2 funziona su tutte le coppie di valute, azioni, materie prime, criptovalu
GEN Fibo Nova
Gede Egi Narditya
https://www.mql5.com/en/users/gedeegi/seller FIBO NOVA is an indicator based on EMA + ATR/StdDev , forming Fibonacci volatility bands (0.618 – 2.618) to detect trend direction (uptrend/downtrend) , Entry signals , Take Profit (Rejection) , and Bounce (trend continuation) . It comes with pop-up alerts & push notifications , and a clean visual display with trend-colored zones. Quick Usage Guide Identify Trend Only Lower Bands active (green) → uptrend, focus on buy setups. Only Upper Bands active
Gli utenti di questo prodotto hanno anche acquistato
Se acquisti questo indicatore, riceverai il mio Trade Manager Professionale + EA  GRATUITAMENTE. Innanzitutto è importante sottolineare che questo sistema di trading è un indicatore Non-Repainting, Non-Redrawing e Non-Lagging, il che lo rende ideale sia per il trading manuale che per quello automatico. Corso online, manuale e download di preset. Il "Sistema di Trading Smart Trend MT5" è una soluzione completa pensata sia per i trader principianti che per quelli esperti. Combina oltre 10 indicat
Divergence Bomber
Ihor Otkydach
4.89 (83)
Ogni acquirente dell’indicatore riceverà inoltre gratuitamente: L’utilità esclusiva “Bomber Utility”, che gestisce automaticamente ogni operazione, imposta i livelli di Stop Loss e Take Profit e chiude le posizioni secondo le regole della strategia I file di configurazione (set file) per adattare l’indicatore a diversi asset I set file per configurare il Bomber Utility in tre modalità: “Rischio Minimo”, “Rischio Bilanciato” e “Strategia di Attesa” Una guida video passo-passo per installare, conf
FX Trend MT5 NG
Daniel Stein
5 (4)
FX Trend NG: La Nuova Generazione di Intelligenza di Trend Multi-Mercato Panoramica FX Trend NG è uno strumento professionale di analisi del trend multi-timeframe e monitoraggio dei mercati. Ti consente di comprendere la struttura completa del mercato in pochi secondi. Invece di passare tra numerosi grafici, puoi identificare immediatamente quali strumenti sono in trend, dove il momentum sta diminuendo e dove esiste un forte allineamento tra i timeframe. Offerta di Lancio – Ottieni FX Trend NG
Market Flow Pro
Gabriele Sabatino
4 (1)
Market Flow Pro Market Flow Pro is an intelligent trading advisor for the MetaTrader 5 platform, designed for automatic trading on financial markets using algorithmic analysis and strict risk management. -Key features: - Fully automatic trading 24/5 - Adaptive trend and momentum entry algorithm -  Built-in risk management - Flexible lot settings (fixed/auto-calculation) - Support for major currency pairs and indices - Optimised for operation on various timeframes  How it works Market
Entry In The Zone and SMC Multi Timeframe is a real-time market analysis tool developed based on Smart Money Concepts (SMC). It is designed to analyze market structure, price direction, reversal points, and key zones across multiple timeframes in a systematic way. The system displays Points of Interest (POI) and real-time No Repaint signals, with instant alerts when price reaches key zones or when signals occur within those zones. It functions as both an Indicator and a Signal System (2-in-1), c
Grabber System MT5
Ihor Otkydach
4.82 (22)
Ti presento un eccellente indicatore tecnico: Grabber, che funziona come una strategia di trading "tutto incluso", pronta all’uso. In un solo codice sono integrati strumenti potenti per l’analisi tecnica del mercato, segnali di trading (frecce), funzioni di allerta e notifiche push. Ogni acquirente di questo indicatore riceve anche gratuitamente: L’utility Grabber: per la gestione automatica degli ordini aperti Video tutorial passo dopo passo: per imparare a installare, configurare e utilizzare
ARICoins
Temirlan Kdyrkhan
ARICoin is a powerful trading companion designed to generate high-probability entry signals with dynamic TP/SL/DP levels based on volatility. Built-in performance tracking shows win/loss stats, PP1/PP2 hits, and success rates all updated live. Key Features: Buy/Sell signals with adaptive volatility bands Real-time TP/SL/DP levels based on ATR Built-in MA Filter with optional ATR/StdDev volatility Performance stats panel (Success, Profit/Loss, PP1/PP2) Alerts via popup, sound, push, or email Cust
Quantum TrendPulse
Bogdan Ion Puscasu
5 (22)
Ecco   Quantum TrendPulse   , lo strumento di trading definitivo che combina la potenza di   SuperTrend   ,   RSI   e   Stocastico   in un unico indicatore completo per massimizzare il tuo potenziale di trading. Progettato per i trader che cercano precisione ed efficienza, questo indicatore ti aiuta a identificare con sicurezza le tendenze di mercato, i cambiamenti di momentum e i punti di entrata e uscita ottimali. Caratteristiche principali: Integrazione SuperTrend:   segui facilmente l'andame
AriX
Temirlan Kdyrkhan
1 (4)
AriX Indicator for MT5 A powerful trend-following and signal-evaluation tool AriX is a custom MT5 indicator that combines Moving Averages and ATR-based risk/reward logic to generate clear buy/sell signals. It visualizes dynamic SL/TP levels, evaluates past trade outcomes, and displays win/loss statistics in a clean on-chart panel. Key features include: Buy/Sell signals based on MA crossovers ATR-based SL/TP1/TP2/TP3 levels with visual lines and labels Signal outcome tracking with real-time stat
Atomic Analyst MT5
Issam Kassas
4.1 (29)
Innanzitutto, vale la pena sottolineare che questo indicatore di trading non è repaint, non è ridisegno e non presenta ritardi, il che lo rende ideale sia per il trading manuale che per quello automatico. Manuale utente: impostazioni, input e strategia. L'Analista Atomico è un indicatore di azione del prezzo PA che utilizza la forza e il momentum del prezzo per trovare un miglior vantaggio sul mercato. Dotato di filtri avanzati che aiutano a rimuovere rumori e segnali falsi, e aumentare il pote
Top indicator for MT5   providing accurate signals to enter a trade without repainting! It can be applied to any financial assets:   forex, cryptocurrencies, metals, stocks, indices .  Watch  the video  (6:22) with an example of processing only one signal that paid off the indicator! MT4 version is here It will provide pretty accurate trading signals and tell you when it's best to open a trade and close it. Most traders improve their trading results during the first trading week with the help of
RFI levels PRO MT5
Roman Podpora
3.67 (3)
L'indicatore mostra accuratamente i punti di inversione e le zone di ritorno dei prezzi in cui il       Principali attori   . Vedi dove si formano le nuove tendenze e prendi decisioni con la massima precisione, mantenendo il controllo su ogni operazione. VERSION MT4     -    Rivela il suo massimo potenziale se combinato con l'indicatore   TREND LINES PRO Cosa mostra l'indicatore: Strutture di inversione e livelli di inversione con attivazione all'inizio di un nuovo trend. Visualizzazione dei li
Trend Lines PRO MT5
Roman Podpora
5 (1)
LINEE DI TENDENZA PRO  Aiuta a capire dove il mercato sta realmente cambiando direzione. L'indicatore mostra reali inversioni di tendenza e punti in cui i principali operatori rientrano. Vedi   Linee BOS   Cambiamenti di tendenza e livelli chiave su timeframe più ampi, senza impostazioni complesse o rumore inutile. I segnali non vengono ridisegnati e rimangono sul grafico dopo la chiusura della barra. VERSIONE MT4   -   Svela il suo massimo potenziale se abbinato all'indicatore   RFI LEVELS PRO
Order Block Pro MT5
N'da Lemissa Kouame
Order Block Pro (MQL5) – Versione 1.0 Autore: KOUAME N'DA LEMISSA Piattaforma: MetaTrader 5 Descrizione: Order Block Pro è un indicatore avanzato progettato per rilevare automaticamente Order Block rialzisti e ribassisti sul tuo grafico. Analizzando candele di consolidamento seguite da candele impulsive forti, l’indicatore evidenzia le aree chiave dove il prezzo è destinato a muoversi rapidamente. Ideale per trader che vogliono: Identificare punti di ingresso e uscita precisi. Rilevare zone din
FX Power MT5 NG
Daniel Stein
5 (31)
FX Power: Analizza la Forza delle Valute per Decisioni di Trading Più Intelligenti Panoramica FX Power è lo strumento essenziale per comprendere la reale forza delle principali valute e dell'oro in qualsiasi condizione di mercato. Identificando le valute forti da comprare e quelle deboli da vendere, FX Power semplifica le decisioni di trading e rivela opportunità ad alta probabilità. Che tu segua le tendenze o anticipi inversioni utilizzando valori estremi di Delta, questo strumento si adatta
ARIPoint
Temirlan Kdyrkhan
ARIPoint is a powerful trading companion designed to generate high-probability entry signals with dynamic TP/SL/DP levels based on volatility. Built-in performance tracking shows win/loss stats, PP1/PP2 hits, and success rates all updated live. Key Features: Buy/Sell signals with adaptive volatility bands Real-time TP/SL/DP levels based on ATR Built-in MA Filter with optional ATR/StdDev volatility Performance stats panel (Success, Profit/Loss, PP1/PP2) Alerts via popup, sound, push, or email Cu
Azimuth Pro
Ottaviano De Cicco
5 (4)
LAUNCH PROMO Azimuth Pro price is initially set at 299$ for the first 100 buyers. Final price will be 499$ . THE DIFFERENCE BETWEEN RETAIL AND INSTITUTIONAL ENTRIES ISN'T THE INDICATOR — IT'S THE LOCATION. Most traders enter at arbitrary price levels, chasing momentum or reacting to lagging signals. Institutions wait for price to reach structured levels where supply and demand actually shift. Azimuth Pro maps these levels automatically: swing-anchored VWAP, multi-timeframe structure lines, an
Presentazione       Quantum Breakout PRO   , l'innovativo indicatore MQL5 che sta trasformando il modo in cui scambi le zone di breakout! Sviluppato da un team di trader esperti con un'esperienza di trading di oltre 13 anni,       Quantum Breakout PRO       è progettato per spingere il tuo viaggio di trading a nuovi livelli con la sua strategia innovativa e dinamica della zona di breakout. Quantum Breakout Indicator ti fornirà frecce di segnalazione sulle zone di breakout con 5 zone target di
RelicusRoad Pro: Sistema Operativo Quantitativo di Mercato 70% DI SCONTO ACCESSO A VITA (TEMPO LIMITATO) - UNISCITI A 2.000+ TRADER Perché la maggior parte dei trader fallisce anche con indicatori "perfetti"? Perché operano su Singoli Concetti isolati. Un segnale senza contesto è una scommessa. Per vincere serve CONFLUENZA . RelicusRoad Pro non è un semplice indicatore. È un Ecosistema Quantitativo completo . Mappa la "Fair Value Road", distinguendo tra rumore e rotture strutturali. Smetti di in
Trend indicator AI mt5
Ramil Minniakhmetov
5 (15)
Trend Ai indicator è un ottimo strumento che migliorerà l'analisi di mercato di un trader combinando l'identificazione della tendenza con punti di ingresso utilizzabili e avvisi di inversione. Questo indicatore consente agli utenti di navigare nelle complessità del mercato forex con fiducia e precisione Oltre ai segnali primari, l'indicatore Ai di tendenza identifica i punti di ingresso secondari che si presentano durante i pullback o i ritracciamenti, consentendo ai trader di capitalizzare le
Trend Hunter MT5
Andrey Tatarinov
5 (3)
Trend Hunter è un indicatore di tendenza per lavorare nei mercati Forex, criptovaluta e CFD. Una caratteristica speciale dell'indicatore è che segue con sicurezza la tendenza, senza cambiare il segnale quando il prezzo supera leggermente la linea di tendenza. L'indicatore non viene ridisegnato; un segnale per entrare nel mercato appare dopo la chiusura della barra. Quando ci si sposta lungo un trend, l'indicatore mostra ulteriori punti di ingresso nella direzione del trend. Sulla base di quest
Ultimate SMC Indicator
Hicham Mahmoud Almoustafa
1 (1)
Ultimate SMC PRO – Smart Money Concepts Indicator (Order Blocks, FVG, Liquidity, BOS) for MetaTrader 5 Ultimate SMC PRO is a professional trading indicator designed to visualize Smart Money Concepts directly on the chart. The indicator combines several institutional trading tools in one system to help traders identify potential high-probability trading zones. The indicator analyzes market structure, liquidity behavior and price imbalance to highlight areas where institutional activity may occu
Bill Williams Advanced
Siarhei Vashchylka
5 (10)
Bill Williams Advanced is designed for automatic chart analysis using Bill Williams' "Profitunity" system. The indicator analyzes four timeframes at once. Manual (Be sure to read before purchasing) Advantages 1. Analyzes the chart using Bill Williams' "Profitunity" system. Signals are displayed in a table in the corner of the screen and on the price chart. 2. Finds all known AO and AC signals, as well as zone signals. Equipped with a trend filter based on the Alligator. 3. Finds "Divergence Bar
Candle Smart Range
Gianny Alexander Lugo Sanchez
Candle Smart Range (CSR) per MetaTrader 5 Candle Smart Range è un indicatore tecnico progettato per l'identificazione automatica dei range di prezzo su più timeframe. Questo strumento analizza la struttura del mercato basandosi sulle formazioni delle candele e sull'interazione del prezzo con i massimi e i minimi precedenti. Caratteristiche principali: Rilevamento Range: Identifica le zone di consolidamento prima dei movimenti impulsivi. Identificazione Falsi Breakout: Segnala quando il prezzo su
La soluzione migliore per ogni principiante o trader esperto! Questo indicatore è uno strumento di trading unico, di alta qualità e conveniente perché abbiamo incorporato una serie di caratteristiche proprietarie e una nuova formula. Con un solo grafico è possibile leggere la forza delle valute per 28 coppie Forex! Immaginate come migliorerà il vostro trading perché sarete in grado di individuare l'esatto punto di innesco di una nuova tendenza o di un'opportunità di scalping? Manuale d'uso:  
TPSproTREND PrO MT5
Roman Podpora
4.74 (19)
TPSproTrend PRO identifica il momento in cui il mercato cambia effettivamente direzione e forma un punto di ingresso all'inizio del movimento. Si entra nel mercato quando il prezzo sta appena iniziando a muoversi, e non dopo che il movimento si è già verificato.   Indicatore       Non ridisegna i segnali e visualizza automaticamente i punti di ingresso, lo Stop Loss e il Take Profit, rendendo il trading chiaro, visivo e strutturato. ISTRUZIONI RUS   -   VERSIONE MT4 Vantaggi principali Segnali
Btmm state engine pro
Garry James Goodchild
5 (2)
BTMM State Engine Pro — the   all-in-one Banks   & Institutions Market Maker indicator for Meta Trader 5. Built for   BTMM traders who follow the Asian   session breakout methodology with Kill Zone timing , level stacking, peak formation detection , and multi-pair scanning — all   from a single chart. Combines   a full BTMM State Engine   with a built-in multi-pair Scanner dashboard, eliminating the need to flip between charts or run multiple indicators. WHAT IT DOES Automatically detec
MetaBands M5
Vahidreza Heidar Gholami
4.5 (2)
MetaBands uses powerful and unique algorithms to draw channels and detect trends so that it can provide traders with potential points for entering and exiting trades. It’s a channel indicator plus a powerful trend indicator. It includes different types of channels which can be merged to create new channels simply by using the input parameters. MetaBands uses all types of alerts to notify users about market events. Features Supports most of the channel algorithms Powerful trend detection algorith
CGE Trading Suite
Carl Gustav Johan Ekstrom
5 (1)
CGE Trading Suite delivers the analytical edge typically reserved for professional trading desks. The platform integrates a full suite of analytical tools into one seamless workflow: dynamic grid mapping, liquidity behavior analysis, ECM, trend lines, MIDAS, trade cycles, and directional channel projections. Together, these provide a unified view of market structure and momentum. Directional clarity is further enhanced by the capital flow index, which measures currency basket strength to identif
Easy SMC Trading
Israr Hussain Shah
Structure Trend con Auto RR e Scanner BOS Versione: 1.0 Panoramica Structure Trend con Auto RR è un sistema di trading completo progettato per i trader che si affidano all'azione del prezzo e alla struttura del mercato. Combina un filtro di tendenza levigato con il rilevamento dei punti swing e i segnali di rottura della struttura (BOS) per generare configurazioni di trading ad alta probabilità. La caratteristica distintiva di questo strumento è la gestione automatica del rischio. Al rilevame
Altri dall’autore
The indicator highlights the points that a professional trader sees in ordinary indicators. VisualVol visually displays different volatility indicators on a single scale and a common align. Highlights the excess of volume indicators in color. At the same time, Tick and Real Volume, Actual range, ATR, candle size and return (open-close difference) can be displayed. Thanks to VisualVol, you will see the market periods and the right time for different trading operations. This version is intended f
FREE
XFlow CHF
Maxim Kuznetsov
XFlow shows an expanding price channel that helps determine the trend and the moments of its reversal. It is also used when accompanying transactions to set take profit/stop loss and averages. It has practically no parameters and is very easy to use - just specify an important moment in the history for you and the indicator will calculate the price channel. This is a demo version limited to CHF currency pairs. Designed to familiarize you with the interactive use of XFlow DISPLAYED LINES ROTATE
FREE
SyncHistorySQL
Maxim Kuznetsov
Script for quick updates (synchronization) trade history in the SQLite database. Saves closed positions and orders, symbols data. Take advantage of SQLite's capabilities for intermediate data storage, analytics, and integrations of the MetaTrader platform. Keep all your data in one place. Use the saved data in SQL analytical queries, from Python and other languages, to build dashboards Parameters useDefaults   true - use default parameters. Save data to the COMMON hierarchy, to the db/ram/{s
FREE
IntradayMagicGBP
Maxim Kuznetsov
4 (1)
IntradayMagic прогнозирует характер ATR и тиковых объёмов на 1 сутки вперёд. Индикатор не перерисовывается и не отстаёт. Используя Intraday Magic вы можете значительно повысить качество торговли и избежать излишних рисков. По его показаниям можно детектировать кризисные состояния рынка и моменты разворота тренда, уточнять моменты и направления входов. Это бесплатная ознакомительная версия ограничена символами (парами) включающими GBP. Никаких иных ограничений нет. Для других пар вы можете исполь
FREE
DayRate EURUSD
Maxim Kuznetsov
The script calculates the rate of price change and its deviation. Displays a typical price movement channel. Transfer the script to the chart and it will automatically mark up the channels through which the price can move in the near future. Place orders according to the channel boundaries. The script uses statistical methods to determine the rate and amplitude of the price. It calculates and displays channels and limits of further movement based on them.  This   version   is   intended   for
FREE
SyncTradeSQL
Maxim Kuznetsov
Script for quick updates (synchronization) up-to-date data in the SQLite database. Saves open positions and orders, current quotes. Take advantage of SQLite's capabilities for intermediate data storage, analytics, and integrations of the MetaTrader platform. Keep all your data in one place. Use the saved data in SQL analytical queries, from Python and other languages, to build dashboards Parameters useDefaults true - use default parameters. Save data to the COMMON hierarchy, to the db/ram/{s
FREE
SyncDB LT
Maxim Kuznetsov
A   service   to   keep   the   SQLite   database up   to   date .   Fast   real -t ime   operation .   Saves   open   positions   and   orders ,   current   quotes ,   and   trading   history .   Take   advantage   of   SQLite 's   capabilities   for   intermediate   data   storage ,   analytics ,   and   integration   of the   MetaTrader   platform .   Save   all   your   data   in   one   place .   Use   the   saved   data   in   SQL   analytical   queries ,   from   Python   and   other   la
FREE
Maltese cross GBP   Универсальный инструмент для определения трендов, флетов и торговли по графическим паттернам. Объединяет техники Гана, Эллиота, Мюррея. Просто разместите его на графике и он покажет направление и скорость движения цены, выделит разворотные моменты. Maltese cross поможет точно определять узловые моменты в истории, планировать торговые действия и сопровождать открытые сделки.  Эта бесплатная демонстрационная версия MalteseCross ограничена GBPUSD и кроссами GBP. Никаких прочих о
FREE
Another Relation displays the relative movement of the other symbols (up to 5) in a separate chart window. The indicator works currency pairs, indices and other quotes. Another Relation allows to visually estimate the symbol correlation and their relative amplitude. Thus, the trader is able to compare the movement of the current instrument to others, identify correlations, delays and make decisions based on their general movement. Indicator usage The window displays the data on all the symbols
SMArrows
Maxim Kuznetsov
Reliable SMA reversal signals. No repainting. Simple settings. Suitable for binary options. Made for maximum traders' convenience. The indicator performs a complex analysis of a price movement relative to SMA and displays the array which is to be most probably followed by a price impulse and SMA reversal. Internal sorting mechanisms sort out definitely late, unreliable or inefficient entries. Options SMA_PERIOD - considered SMA period should be no less than 24, the default is 44 SMA_APPLIED - S
SpeedChan
Maxim Kuznetsov
SpeedChan Leading indicator. Marks in the future two price channels - if the price comes into the channel, then the quote changes with the speed specified in the parameters. In these areas, price reversals are most likely. Two price channels are displayed - one on top, showing the growth rate; the second one - below, shows the speed of the fall. Channels are displayed as a solid center line and two borders drawn with a dotted line. In many cases, the area between the channels is not important fo
IntradayMagic predicts the nature of ATR and tick volumes for 1 day ahead. The indicator does not redraw and does not lag behind. Using Intraday Magic, you can significantly improve the quality of trading and avoid unnecessary risks. According to its indications, you can detect the crisis state of the market and the moments of trend reversal, specify the moments and directions of entries. How the indicator works Periodic events, exchange schedules, Bank schedules, expirations, and other similar
Maltese cross
Maxim Kuznetsov
A universal tool for determining trends, flats and trading on graphical patterns. Combines the techniques of Gan, Elliot, and Murray. Just place it on the chart and it will show the direction and speed of the price movement, highlight the turning points. Maltese cross will help you accurately determine the key points in the history, plan trading actions and accompany open transactions. Basic principles Maltese Cross displays the Trend, Flat and Impulse lines before and after the selected momen
Inguz 4
Maxim Kuznetsov
Ing (inguz,ingwar) - the 23rd rune of the elder Futhark ᛝ, Unicode+16DD. Add some runic magic to your trading strategies. The correct marking of the daily chart will indicate to you the successful moments for counter-trend trading. Simple to use, has high efficiency in volatile areas. Be careful in lateral movements. Signals ᛝ are generated when the main lines of construction intersect. Red arrow down - recommended sales Blue up arrow - recommended purchases rare purple arrows indicate exce
XFlow4
Maxim Kuznetsov
XFlow shows an expanding price channel that helps determine the trend and the moments of its reversal. It is also used when accompanying transactions to set take profit/stop loss and averages. It has practically no parameters and is very easy to use - just specify an important moment in the history for you and the indicator will calculate the price channel. DISPLAYED LINES ROTATE - a thick solid line. The center of the general price rotation. The price makes wide cyclical movements around the
The indicator shows the direction and sustainability of the trend, as well as its reversals. Use the indicator to search for successful entries, the performance bottlenecks to minimize risk and time to exit deals. The indicator is never redrawn . It is an easy-to-setup visual tool for both novice and experienced traders It fits any trading style. The indicator is displayed immediately at a candlestick open as two lines: ROAD - smoothed movement. It is drawn as a solid orange line BRIGHT - trend
AnotherSymbol displays the relative movement of another symbol on the current chart as candlesticks, High/Low or Close lines. The plotted chart is aligned to the selected Moving Average and scaled by the standard deviation. When sing this data representation the trader should focus not on the absolute values, but on the behavior of the price relative to the Bollinger bands. Another Symbol provides additional opportunities in the pair strategies and cross rates trading. Main Parameters SYMBOL -
Prima MT5
Maxim Kuznetsov
Price Reversion Indicator based on MA shows trend reversals. The indicator algorithm provides highly reliable entry points, and its simple settings allow using it for any symbol and trading style. Signals are generated at the opening of a bar and are not redrawn. Prima analyzes the relative movement of two moving averages (fast and slow) with respect to the price, and determines the moments when the next movement will cause the reversal of the two MAs with a high probability. These points are ma
IntradayMagic predicts the nature of ATR and tick volumes for 1 day ahead. The indicator does not redraw and does not lag behind. Using Intraday Magic, you can significantly improve the quality of trading and avoid unnecessary risks. According to its indications, you can detect the crisis state of the market and the moments of trend reversal, specify the moments and directions of entries. How the indicator works Periodic events, exchange schedules, Bank schedules, expirations, and other similar
MartinGame 5
Maxim Kuznetsov
Trading can be fun and exciting! The MartinGame Expert Advisor game will help you get acquainted with money management while having fun, understand the value of correct forecasts and just pass the time usefully. You will act as an analyst predicting the direction and strength of the trend, and the wayward "Martin" will listen to your advice and try to follow them. Rules of the game All transactions are made by your ward "Martin". He has absolutely no knowledge of analysis, always uses fixed ta
Variativity
Maxim Kuznetsov
The indicator evaluates the degree of price variability and identifies the components leading to growth and fall. Using Variability, you can determine the places where the movement changes, successful moments for trading on the trend or against the trend. Accompany open transactions. DISPLAY The indicator displays 3 lines: VARIABILITY - a thin gray line. Total price variability. The growth of the line indicates an increase in market activity. The decline shows the possibility of counter-trend tr
AutoGan
Maxim Kuznetsov
The script statistically reveals the main rate of movement (Gan angle) for the selected instrument. Using mathematical methods, it determines the speed of following the candles of the current timeframe against the background of the older one. Just place AutoGan on the graph and it will perform the required calculations and correctly draw the Gan grid. The script is very easy to use, only the colors of the grid lines are set in the parameters. Parameters: GRID_COLORING : How many colors to us
AutoLevels
Maxim Kuznetsov
Automatic calculation and marking of resistance and price reversal levels. The script will perform statistical calculations and plot a regular grid on which the quote moves on the graph. These levels are very stable. Use them in trading planning and for placing pending orders. Just select a timeframe and AutoLevels will indicate the important places of the chart in the form of horizontal lines. Solid lines indicate more "dense" areas - areas of price reversal, where the quote happens more oft
Inguz
Maxim Kuznetsov
Ing (inguz,ingwar) - the 23rd rune of the elder Futhark ᛝ, Unicode+16DD. Add some runic magic to your trading strategies. The correct marking of the daily chart will indicate to you the successful moments for counter-trend trading. Simple to use, has high efficiency in volatile areas. Be careful in lateral movements. Signals ᛝ are generated when the main lines of construction intersect. Red arrow down - recommended sales Blue up arrow - recommended purchases rare purple arrows indicate exce
Ing
Maxim Kuznetsov
Intraday diagonal grid trading, development of Gan and Murray trading techniques. Relying on cyclical volatility, the Expert Advisor makes optimal inputs. Very easy to use - the main parameter is the minimum daily range. Additionally, you can set the parameters of averaging and profit taking. Every day, the ADVISER displays a diagonal network of lines forming a semblance of the Ing rune The BUY trading signal is the price crossing of the descending construction lines The SELL trading signal
SessionAlert
Maxim Kuznetsov
Taking into account the difference in trading sessions, the indicator shows the trend direction and the resistance level. All events are marked on the chart and alerts are sent. Using SessionAlert, you can trade calmly, steadily. You just need to specify the start and end time of the sessions. The indicator displays the resistance level, the arrow indicates the trend change event and additionally marks the price touching the resistance level. The principle of operation of the indicator is very s
XFlow
Maxim Kuznetsov
XFlow shows an expanding price channel that helps determine the trend and the moments of its reversal. It is also used when accompanying transactions to set take profit/stop loss and averages. It has practically no parameters and is very easy to use - just specify an important moment in the history for you and the indicator will calculate the price channel. DISPLAYED LINES ROTATE - a thick solid line. The center of the general price rotation. The price makes wide cyclical movements around the
DayRate
Maxim Kuznetsov
The script calculates the rate of price change and its deviation. Displays a typical price movement channel. Transfer the script to the chart and it will automatically mark up the channels through which the price can move in the near future. Place orders according to the channel boundaries. The script uses statistical methods to determine the rate and amplitude of the price. It calculates and displays channels and limits of further movement based on them.  Parameters PLACEMENT - channel place
MyChart
Maxim Kuznetsov
The beautiful design of the trading chart makes trading more convenient and enjoyable. MyChart neatly marks out the time and price grid. Marks up the visual labels of the graph. Displays candlesticks of the older period, spread and stop-level levels. Flexible options allow you to customize the appearance to your taste. It looks good in any color theme of the terminal.  Settings TIME & PRICE grid - the appearance of the time and price grid. You can turn the grids on/off separately. Set fonts and
SyncDB
Maxim Kuznetsov
A service to keep the SQLite database up to date . Fast real - time operation . Saves open positions and orders , current quotes , and trading history . Take advantage of SQLite 's capabilities for intermediate data storage , analytics , and integration of the MetaTrader platform . Save all your data in one place . Use the saved data in SQL analytical queries , from Python and other languages , to build dashboards and integrate MetaTrader Parameters SyncDB creates and maintains 2 databases at th
Filtro:
Nessuna recensione
Rispondi alla recensione