FXC iMACD DivergencE MT5
- Indicatori
- Versione: 1.1
- Aggiornato: 16 gennaio 2023
- Attivazioni: 20

FXC iMACD-DivergencE MT5 Indicator
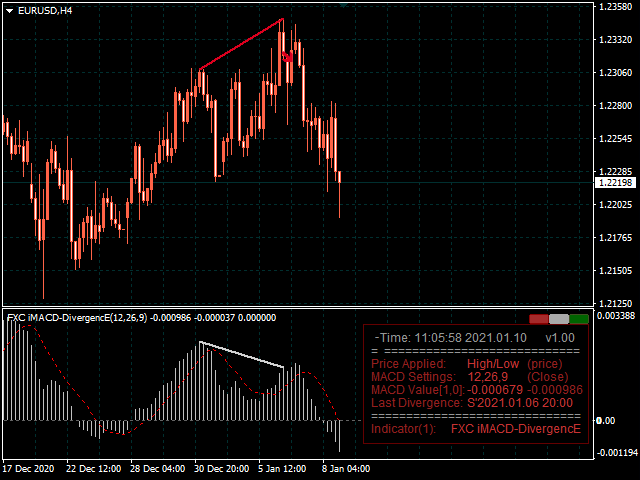
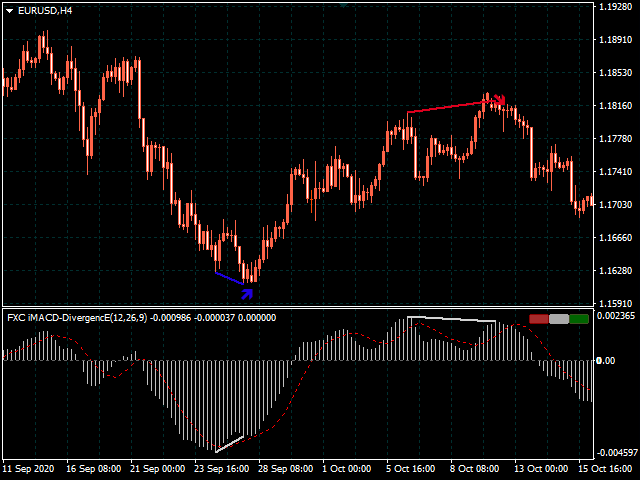
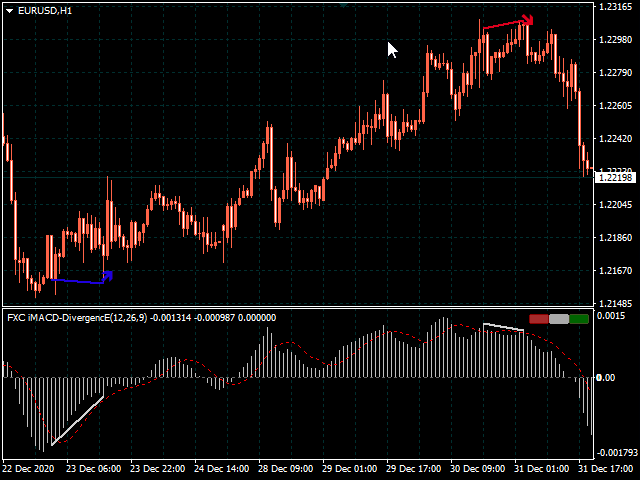
This is an advanced MACD indicator that finds trend-turn divergences on the current symbol. The indicator detects divergence between the MACD and the price movements as a strong trend-turn pattern.
Main features:
- Advanced divergence settings
- Price based on Close, Open or High/Low prices
- Give Buy/Sell open signals
- PUSH notifications
- E-mail sending
- Pop-up alert
- Customizeable Information panel
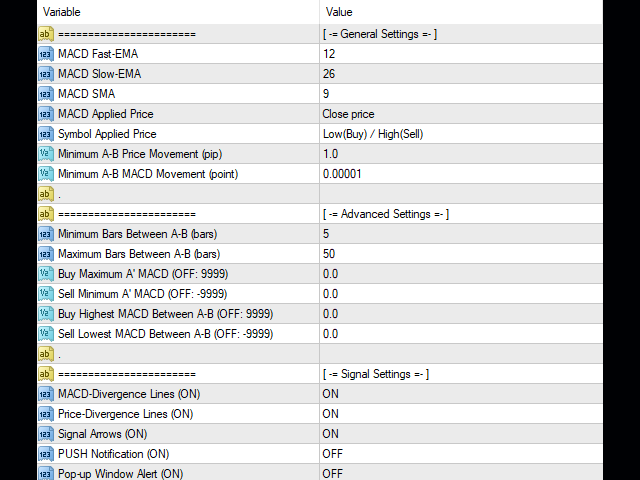
- MACD Fast-EMA: The Fast-EMA variable of the MACD indicator.
- MACD Slow-EMA: The Slow-EMA variable of the MACD indicator.
- MACD SMA: The SMA variable of the MACD indicator.
- Symbol Applied Price: Applied price of the current symbol. It can be: Close, Open, Low(Buy)/High(Sell).
- Minimum A-B Price Movement (pip): Determines the minimum price movements between the A' and B' points of the divergence.
- Minimum A-B MACD Movement (point): Determines the minimum MACD value movements between the A' and B' points of the divergence.
- Minimum Bars Between A-B (bars): The number of minimum bars allowed between the A' and B' points.
- Maximum Bars Between A-B (bars): The number of maximum bars allowed between the A' and B' points.
- Buy Maximum A' MACD (OFF: 1): The maximum MACD value of the A' point of the Buy divergence.
- Sell Minimum A' MACD (OFF: 0): The minimum MACD value of the A' point of the Sell divergence.
- Buy Highest MACD Between A-B (OFF: 1): The highest MACD value allowed between A' and B' points for Buy divergence.
- Sell Lowest MACD Between A-B (OFF: 0): The minimum lowest MACD value allowed between A' and B' points for Sell divergence.
- MACD-Divergence Lines (ON): Draws divergence lines to the indicator window at signals.
- Price-Divergence Lines (ON): Draws divergence lines to the price chart at signals.
- Signal Arrow (ON): Draws arrows to the chart at signals.
- PUSH Notification (ON): Sends PUSH notifications at signals.
- Pop-up Window Alert (ON): Sends pop-up alerts at signals.
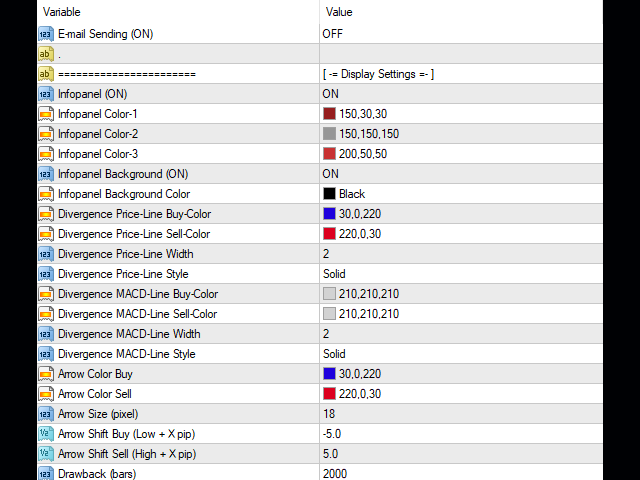
- E-mail Sending (ON): Sends e-mails at signals.
- Infopanel (ON): Switch Turns the information panel on or off.
- Infopanel Color-1: Color-1 of the information panel.
- Infopanel Color-2: Color-2 of the information panel.
- Infopanel Color-3: Color-3 of the information panel.
- Infopanel Background (ON): Turns the background of the information panel on or off.
- Infopanel Background Color: Sets the background color of the information panel.
- Divergence Price-Line Buy-Color: Divergence Price-Line color of the Buy signs.
- Divergence Price-Line Sell-Color: Divergence Price-Line color of the Sell signs.
- Divergence Price-Line Width: Width of the Price-Line.
- Divergence Price-Line Style: Style of the Price-Line.
- Divergence MACD-Line Buy-Color: Divergence MACD-Line color of the Buy signs.
- Divergence MACD-Line Sell-Color: Divergence MACD-Line color of the Sell signs.
- Divergence MACD-Line Width: Width of the MACD-Line.
- Divergence MACD-Line Style: Style of the MACD-Line.
- Arrow Color Buy: Arrows color for Buy signals.
- Arrow Color Sell: Arrows color for Sell signals.
- Arrow Size: Size of the Arrows.
- Arrow Shift Buy (Low + X pip): With this parameter, you can shift the price of the Buy arrows relative to the Low price.
- Arrow Shift Sell (High + X pip): With this parameter, you can shift the price of the Sell arrows relative to the High price.
- Drawback (bars): Number of bars drawn divergence signs back in the past.
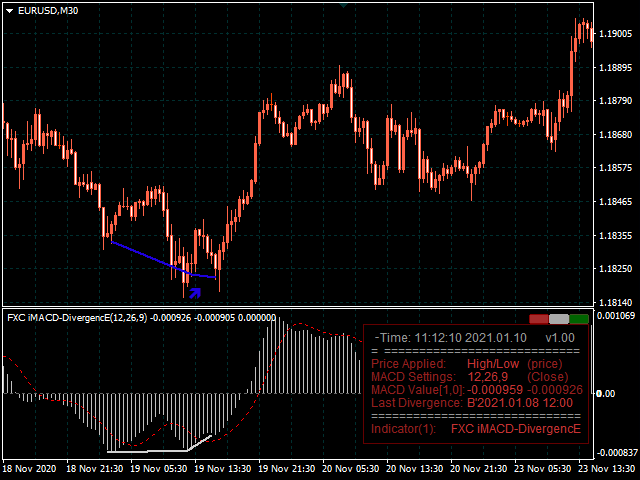
- Price Applied: Applied price of the current symbol.
- MACD Settings: Settings of the MACD indicator.
- MACD Value[0,1]: MACD values at the last two bars.
- Last Divergence: Shows the time of the last divergence sign. The B' or S' represents the direction: Buy or Sell.
- Indicator(1): Shows the name of the indicator. The number in the parentheses represents the subwindow of the indicator.
Buttons:
- There are three little buttons at the right-upper corner of the information panel.
- RED button: It removes the indicator from the chart.
- WHITE button: Do nothing.
- GREEN button: It turns on or off the information panel.