Ribbon Trend for MT5
- Indicatori
- Versione: 1.70
- Aggiornato: 29 marzo 2021

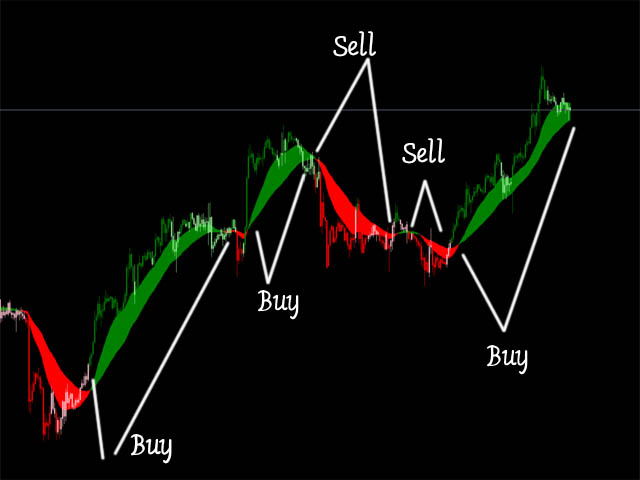
This indicator is a simple tool to spot a possible trend.
When the ribbon below the price bars, It will turn to Green color and the trend is seen to be bullish
When the ribbon above the price bars, it will turn to Red color and the trend is seen to be bearish.
It can be used a either Entry Signal
Exit Signal or trailing stop, so it is very versatile.
By default color : Green is UP trend and Red is Down trend
and this work perfect with Bar4Colors.ex5


Отличный индикатоо