Vantage Bands
- Indicatori
- Versione: 1.0
- Attivazioni: 5

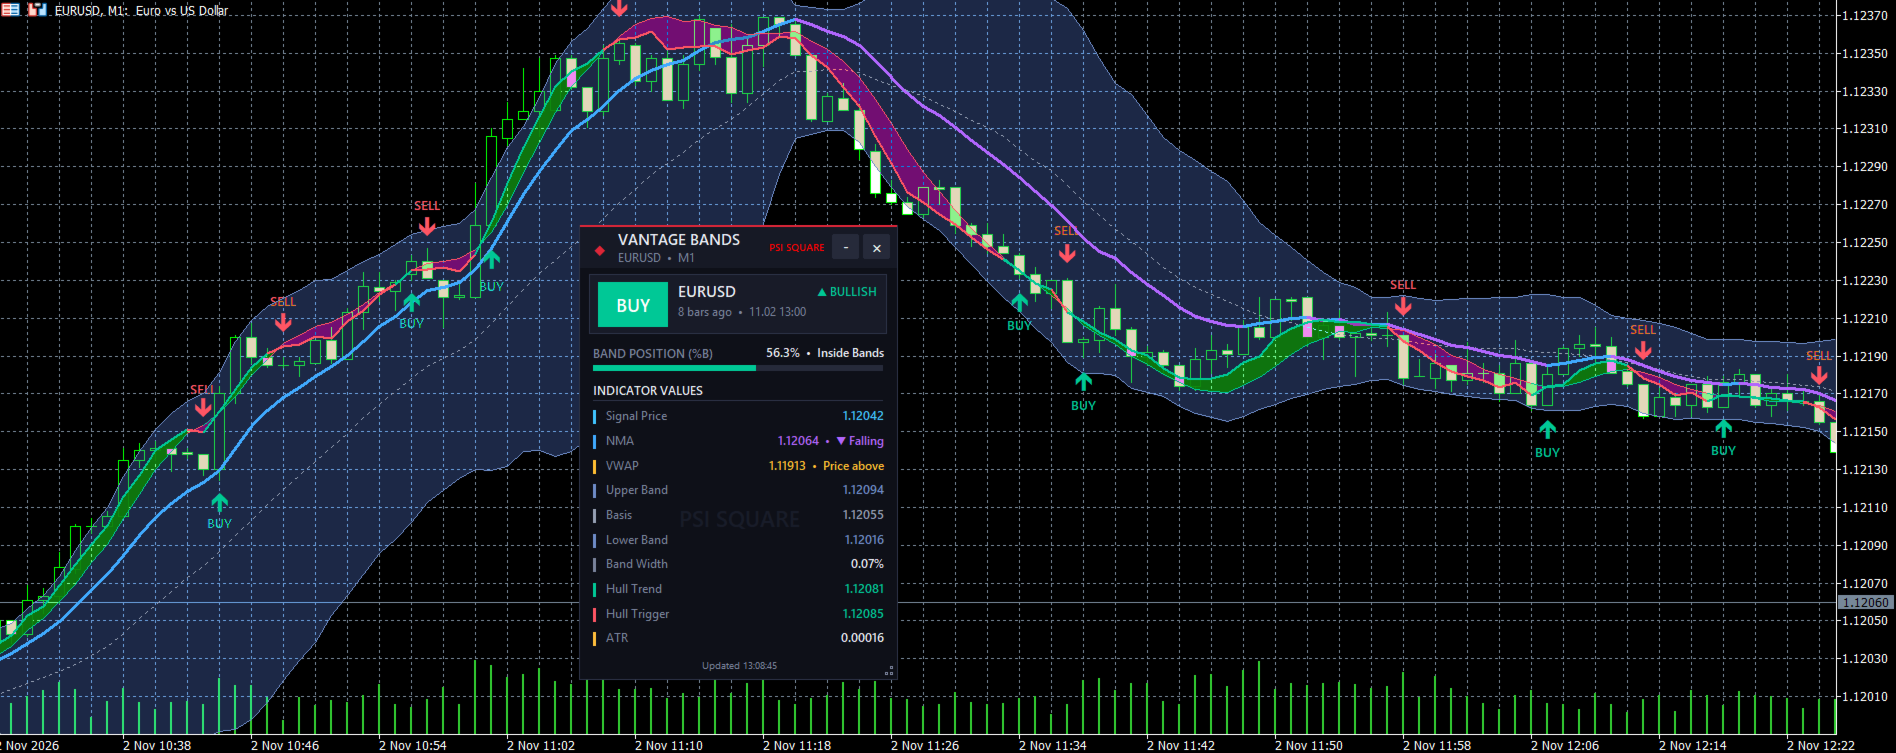
Introducing Vantage Bands, a multi-layer trend indicator that combines a Natural Moving Average, an anchored VWAP, a Bollinger cloud and a Kalman-smoothed Hull crossover into one clean chart overlay.
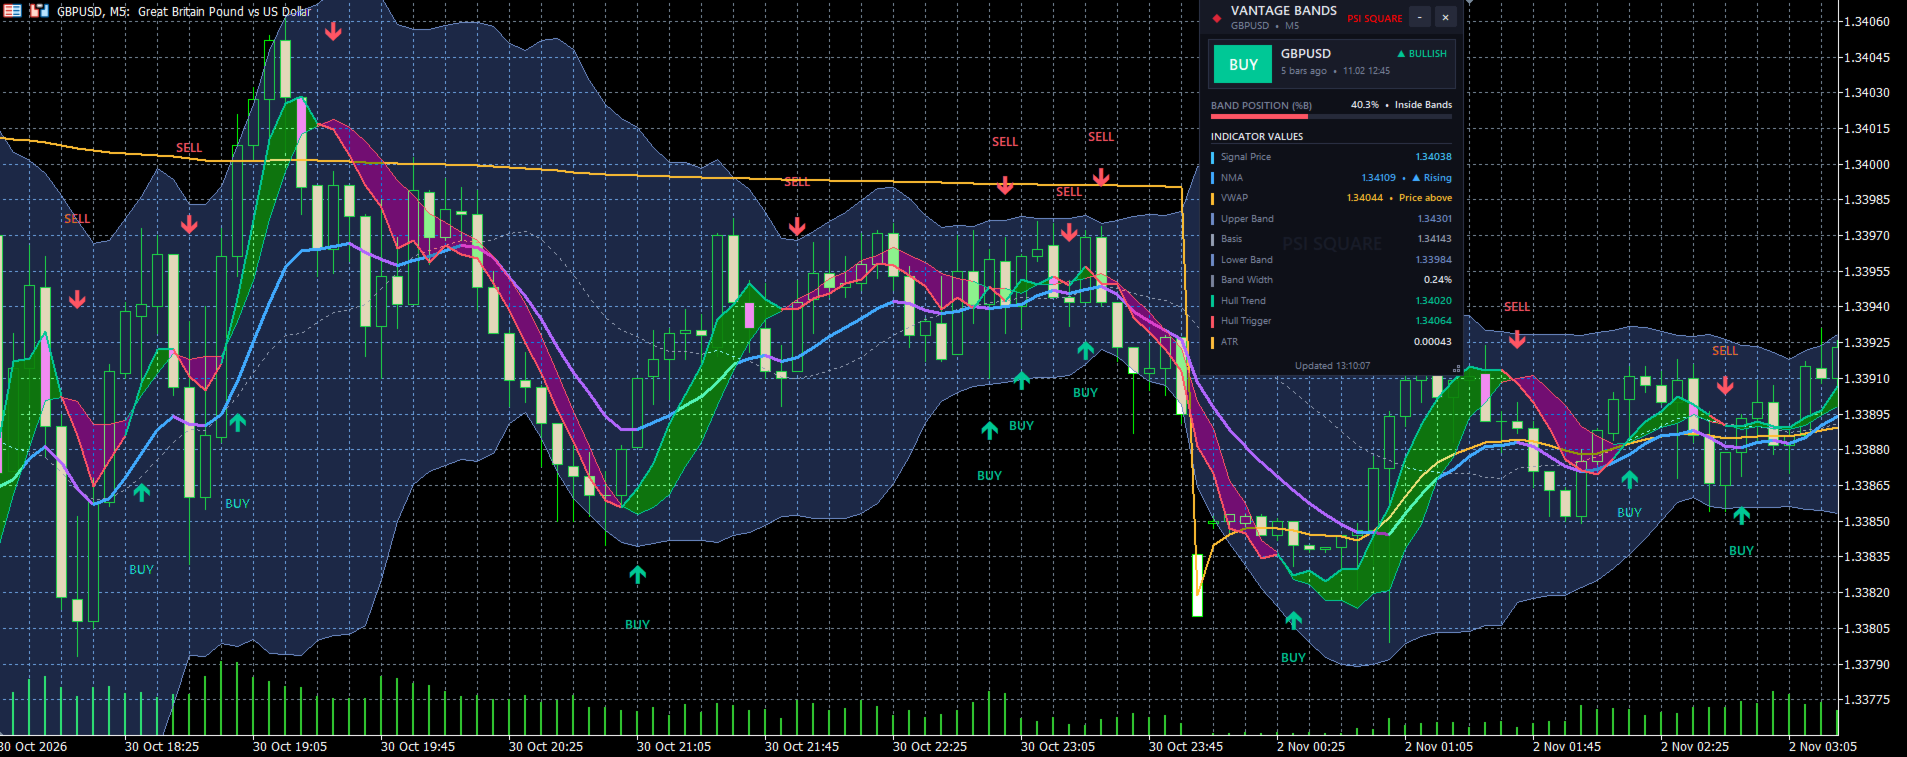
Vantage reads the market in layers. The Natural Moving Average (NMA) shows the main trend and changes color with its slope. The anchored VWAP shows where the session's volume-weighted price sits. The Bollinger cloud shows how stretched price is. Two Kalman-filtered Hull lines, a Hull Trend line and a faster Hull Trigger line, create the signals: when the Trigger crosses the Trend line, Vantage marks the new move with an arrow and a BUY/SELL label. You see direction, location and turning points in one glance.
Key Features:
- Clear Buy/Sell Signals: Arrows and BUY/SELL labels appear at the bar where the Hull Trigger crosses the Hull Trend line. The label can also show the price at that bar.
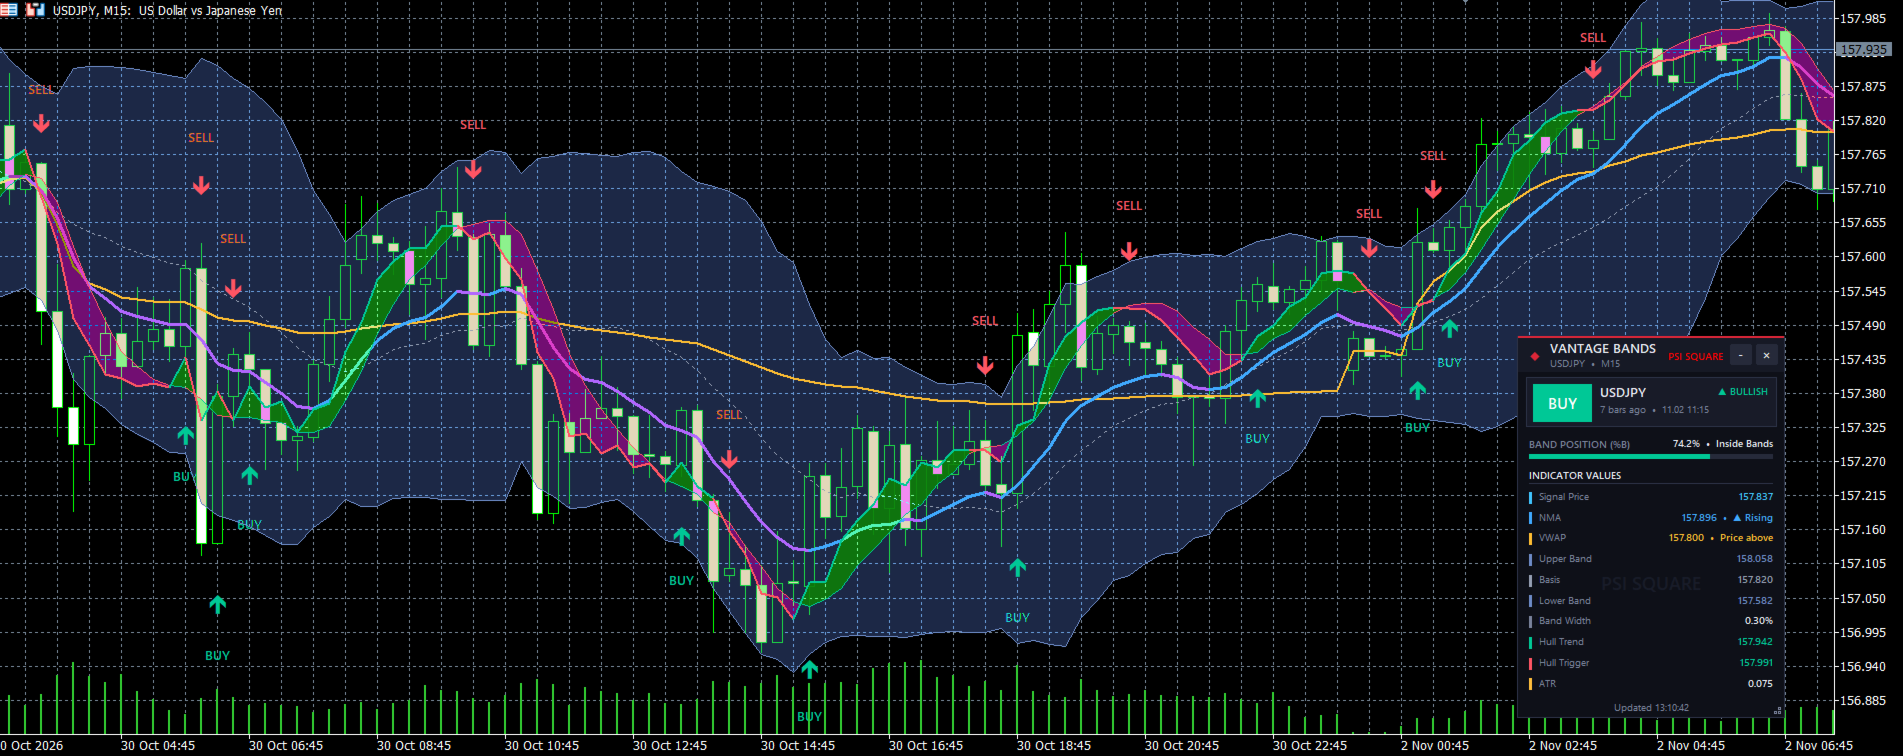
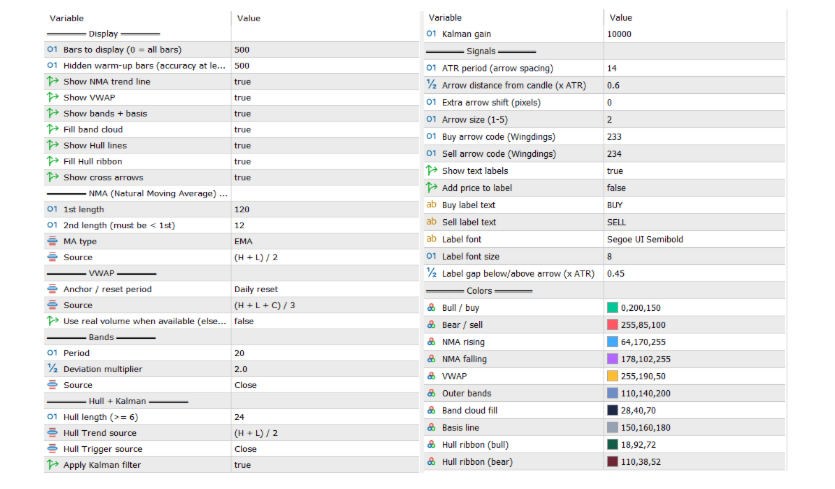
- Natural Moving Average (NMA): A smooth, low-lag trend line that changes color when its slope turns up or down. Choose the two lengths, the average type (EMA, SMA, VWMA or WMA) and the price source.
- Anchored VWAP: A VWAP that resets daily, weekly or monthly. Choose the price source, and use real volume when your broker provides it (tick volume otherwise).
- Bollinger Cloud: Upper and lower bands with a dotted basis line and a soft filled cloud between them. Period, deviation and source are adjustable.
- Kalman-Hull Ribbon: The Hull Trend and Hull Trigger lines are drawn with a shaded ribbon between them that follows the trend color. The Kalman filter can be switched on or off, and its gain is adjustable.
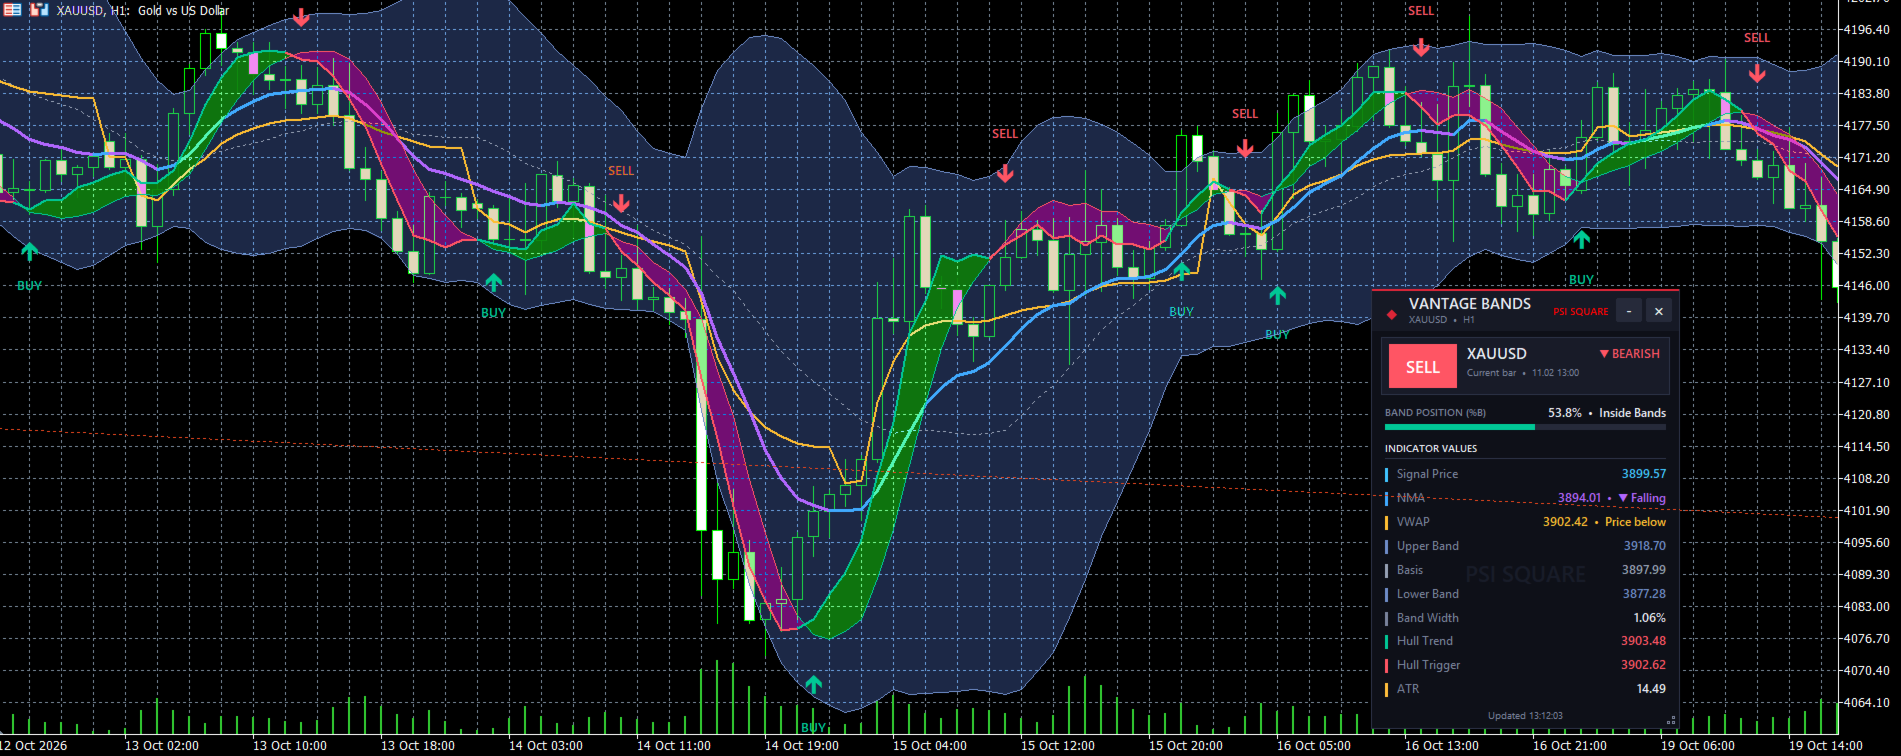
- Customizable Display: Switch the NMA, VWAP, bands, band fill, Hull lines, ribbon and signals on or off individually. Set every color, and choose how many bars to display, with a hidden warm-up period so the left edge of the chart stays accurate.
- Live Dashboard Panel: Shows the current Hull trend, the latest signal with how many bars ago it appeared and its time, the signal price, and the price position inside the Bollinger bands (%B). It also shows the NMA value and slope, the VWAP and whether price is above or below it, the upper, basis and lower bands, the band width, both Hull values and the ATR. The panel scales automatically to your screen size and can be dragged, resized and minimized. It keeps its position when you change timeframe.
- Works on any symbol and timeframe: Forex, gold, indices and crypto, from scalping to swing trading.
Whether you're a beginner who wants clear, simple signals or an experienced trader who wants a layered trend, VWAP and volatility view to build your own strategy on, Vantage Bands helps you trade with direction instead of a guess.
Specifications:
- Trend-change signals from a Hull Trigger / Hull Trend crossover, with arrows and labels on the chart
- Signals are calculated on every tick. A signal on the live bar can appear or disappear until the bar closes, and closed-bar signals do not change.
- The indicator has a trend-state buffer (+1 bullish, −1 bearish) that an EA can read.
- Trading involves risk. Always test on a demo account first.
Contact
If you have any questions or need help, contact me via Private Message.