Lumen Trend

Introducing Lumen Trend, a multi-component trend analysis indicator that combines MACD momentum, RSI conditions, Wave Trend confirmation, and moving-average trend detection to identify potential BUY and SELL opportunities.

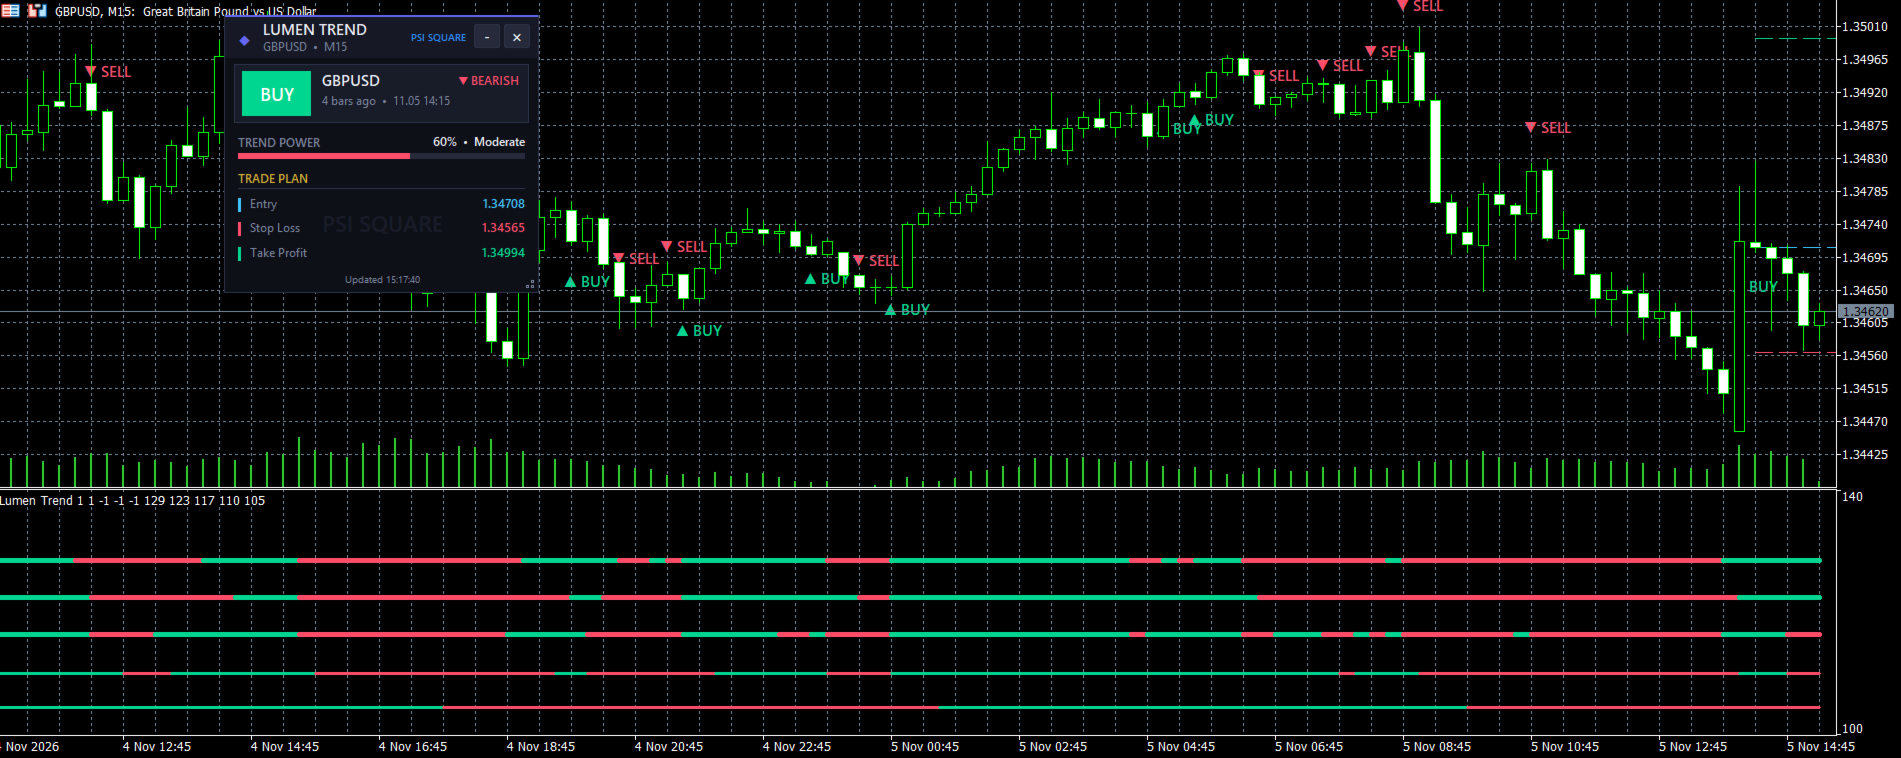
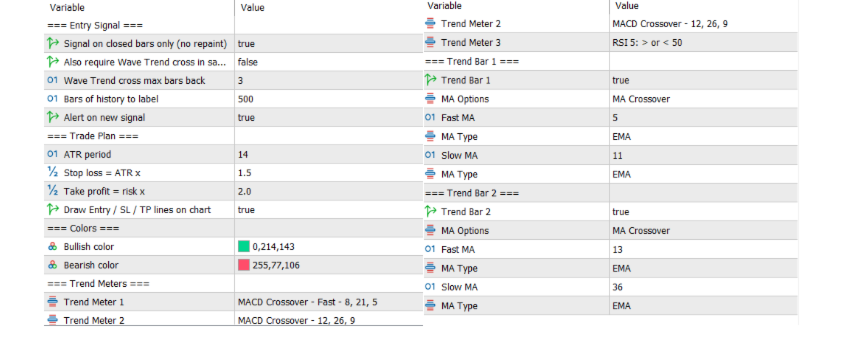
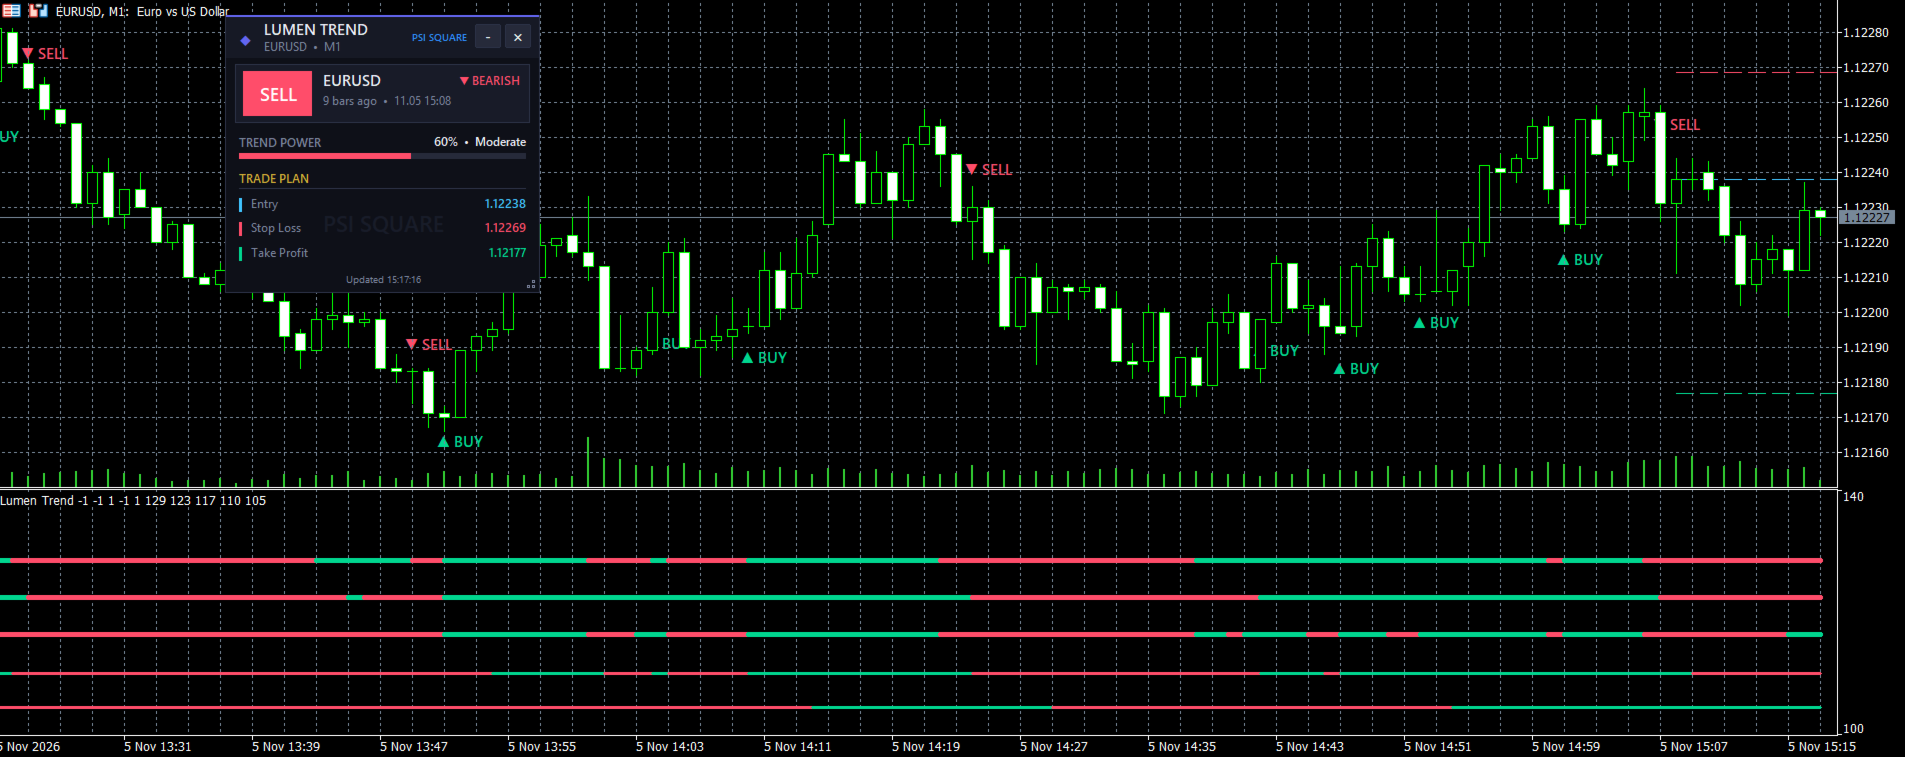
Lumen Trend uses three configurable trend meters alongside two additional moving-average trend bars to assess market direction. When all three primary meters align, the indicator generates a potential BUY or SELL signal, with optional Wave Trend crossover confirmation to refine entries.

Key Features:

  • Three Configurable Trend Meters: Choose from seven detection methods, including MACD, Fast MACD, Mom Dad, RSI crossovers, RSI levels, and trend candles.
  • Dual Moving Average System: Two additional trend bars with customizable EMA/SMA types, periods, and detection methods.
  • BUY/SELL Signals: Identifies opportunities when all three primary trend meters establish fresh bullish or bearish alignment.
  • Wave Trend Confirmation: Optional crossover confirmation within a configurable number of bars.
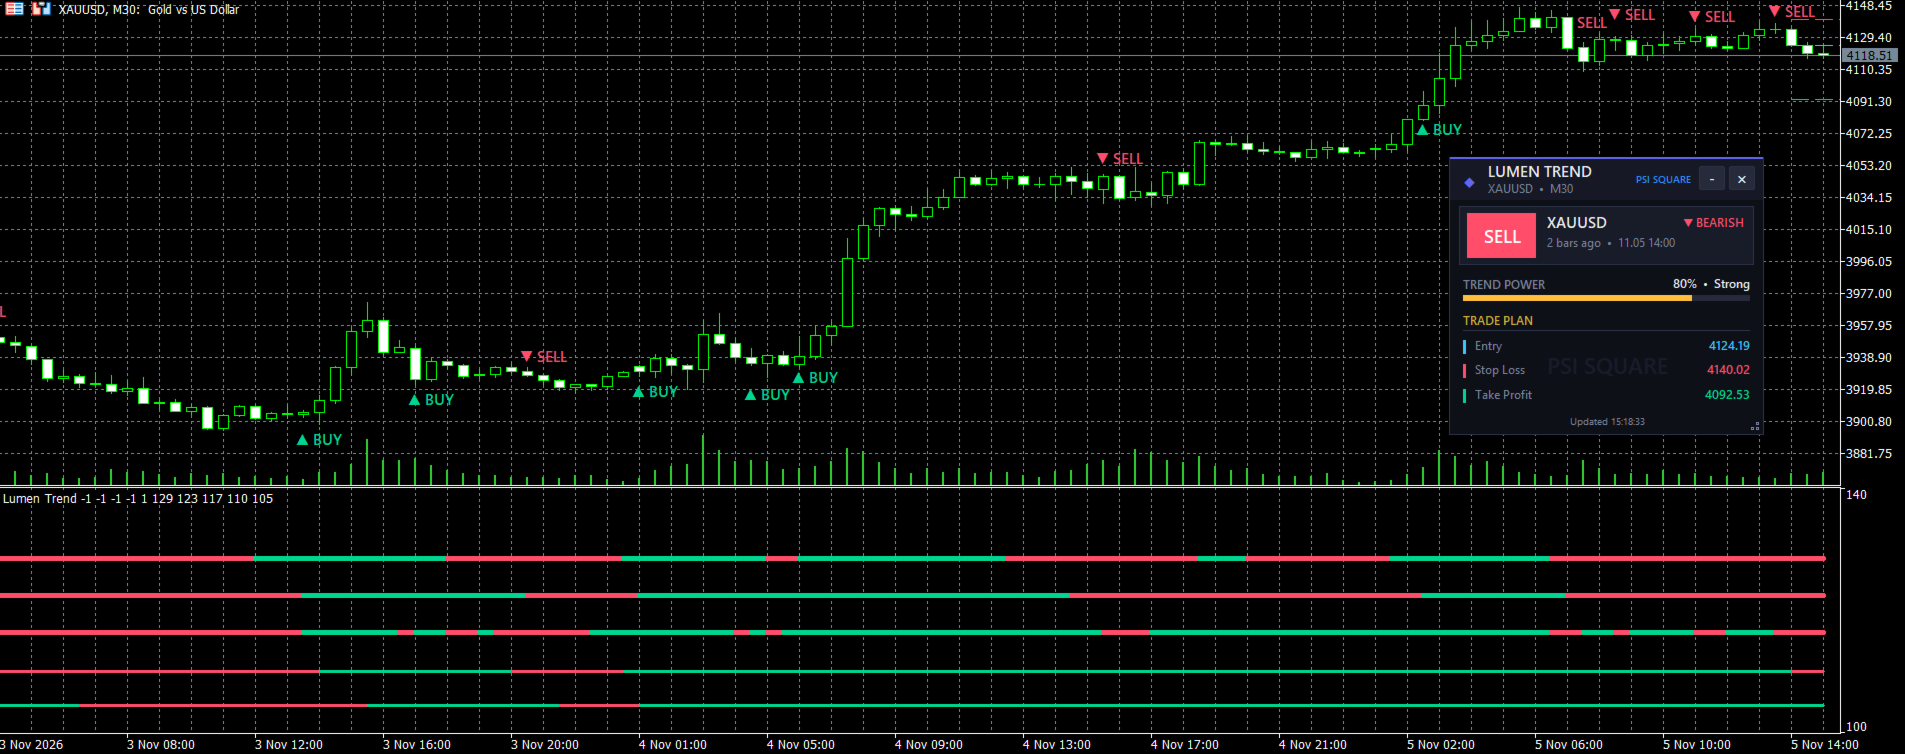
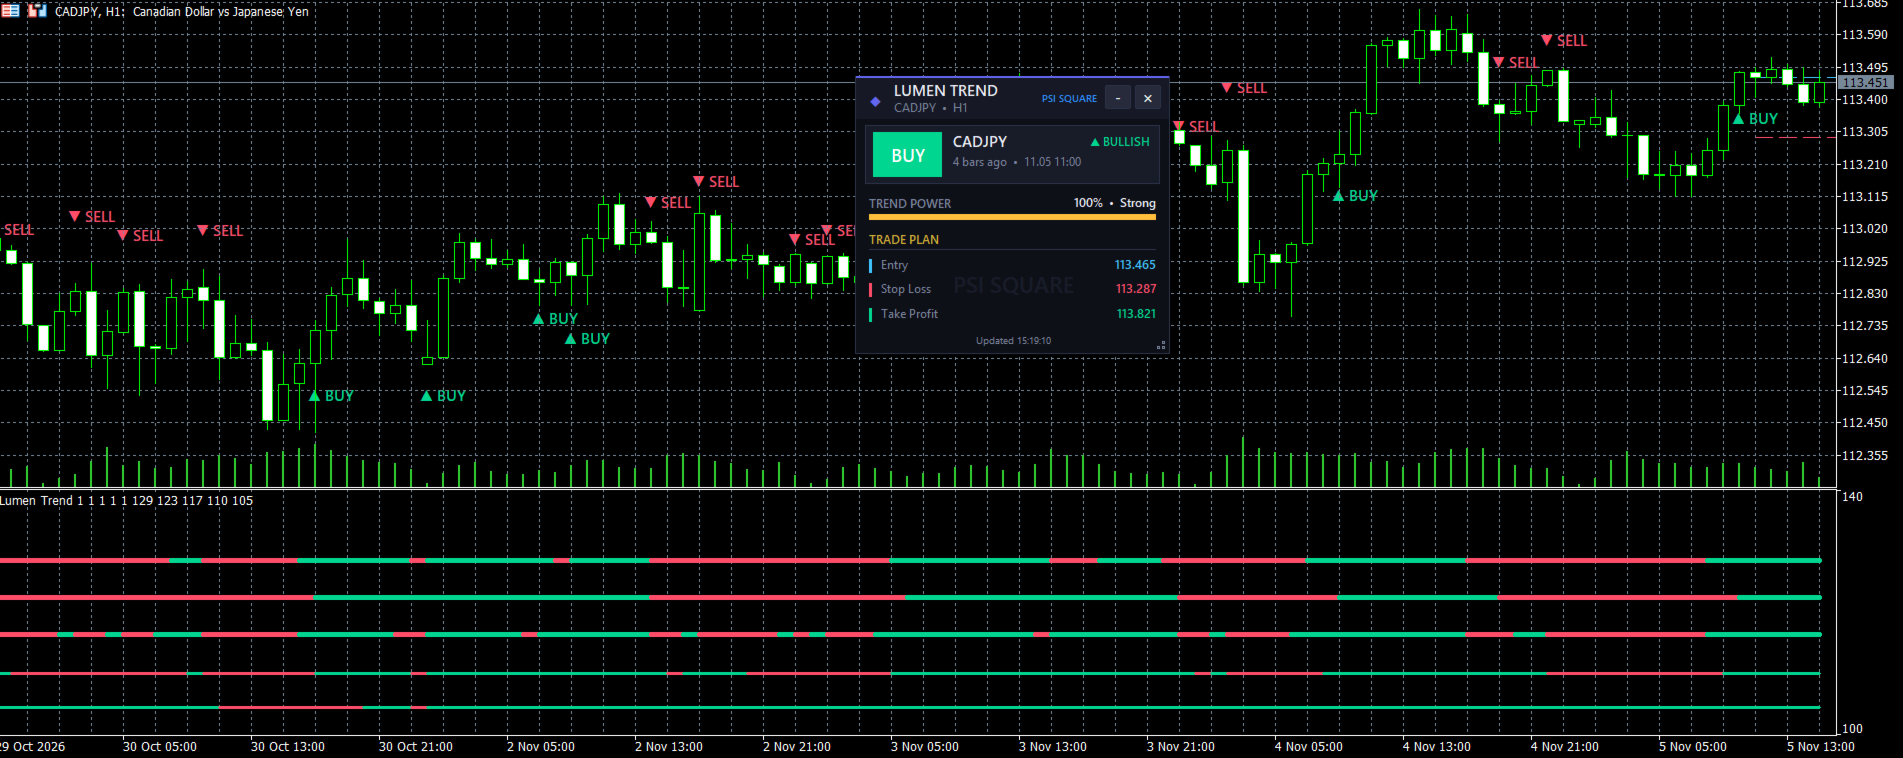
  • Trend Strength Analysis: Classifies market conditions as Weak, Moderate, or Strong based on five trend bars.
  • ATR-Based Trade Plan: Automatically calculates Entry, Stop Loss, and Take Profit using configurable ATR and Risk-to-Reward settings.
  • Interactive Dashboard: Displays signals, market direction, trend strength, signal age, and trade-plan levels. The dashboard can be moved, resized, and minimized.
  • Chart Visualization: Displays BUY/SELL markers and configurable Entry, Stop Loss, and Take Profit lines.
  • Customizable Alerts: Provides popup notifications for new BUY and SELL signals.
  • Signal Confirmation: Supports closed-candle signals by default, with an option to evaluate the currently forming candle.
  • Lumen Trend brings multiple trend and momentum analysis methods together in one indicator, helping traders evaluate market alignment and identify potential entry opportunities across different trading instruments and timeframes.

Specifications:

  • Designed for MetaTrader 5 (.ex5).
  • Features three primary trend meters with seven detection methods.
  • Includes two additional moving-average trend bars.
  • Supports both EMA and SMA calculation methods.
  • Offers optional Wave Trend confirmation.
  • Generates BUY/SELL signals based on fresh trend alignment.
  • Provides five-bar trend strength analysis.
  • Calculates Entry, Stop Loss, and Take Profit levels using ATR.
  • Features an interactive dashboard that can be dragged, resized, and minimized.
  • Offers customizable chart markers, trade levels, and popup alerts.
  • Supports multiple markets, including Forex, metals, indices, stocks, and cryptocurrencies.

Disclaimer: Trading involves risk. Always test the indicator on a demo account before using it in live trading.

Contact

If you have any questions or need assistance, contact me via Private Message.


Prodotti consigliati
Passband Filter Pro Passband Filter Pro is a trend and cycle oscillator for MetaTrader 5. It is built on the Ehlers Super Passband Filter, a band pass filter that removes long term trend drift and short term noise so that only the dominant market cycle remains. The result is a clean oscillator with a color cloud that shows overbought and oversold conditions, cycle turns, and momentum on forex, gold, indices, stocks and crypto. Most traders enter too early or too late. Simple moving averages la
CvdDeltaVolumes
Parasbhai N Patel
Delta + CVD & CVD Candles Order-flow indicator combining Delta (Ask–Bid), Cumulative Volume Delta (CVD), and a unique CVD-based synthetic candle system. Shows buy/sell pressure, volume aggressiveness, and momentum shifts with optional Delta histogram, CVD line, and CVD+Delta combined candles. Useful for scalping, intraday trading, divergence detection, and understanding buyer/seller dominance. Overview The Delta + CVD & CVD Candles Indicator combines multiple order-flow tools into one clean
Wapv Price and volume
Eduardo Da Costa Custodio Santos
L'indicatore di prezzo e volume WAPV per MT5 fa parte del set di strumenti (Wyckoff Academy Wave Market) e (Wyckoff Academy Price and Volume). L'indicatore di prezzo e volume WAPV per MT5 è stato creato per semplificare la visualizzazione del movimento del volume sul grafico in modo intuitivo. Con esso puoi osservare i momenti di picco del volume e i momenti in cui il mercato non ha interesse professionale Identifica i momenti in cui il mercato si muove per inerzia e non per movimento di "denaro
Was: $249  Now: $99   Market Profile defines a number of day types that can help the trader to determine market behaviour. A key feature is the Value Area, representing the range of price action where 70% of trading took place. Understanding the Value Area can give traders valuable insight into market direction and establish the higher odds trade. It is an excellent addition to any system you may be using. Inspired by Jim Dalton’s book “Mind Over Markets”, this indicator is designed to suit the
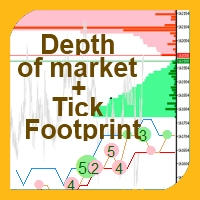
This indicator allows you to enjoy the two most popular products for analyzing request volumes and market deals at a favorable price: Actual Depth of Market Chart Actual Tick Footprint Volume Chart This product combines the power of both indicators and is provided as a single file. The functionality of Actual COMBO Depth of Market AND Tick Volume Chart is fully identical to the original indicators. You will enjoy the power of these two products combined into the single super-indicator! Below is
- All of my indicators are just 30$ !! Limited offer. Contact me for extra bonus   indicator, instruction or any questions! - Lifetime update free - Non-repaint - Plus Free Filtering Indicator  - Related product: Gann Gold EA - I just sell my products in Elif Kaya Profile, any other websites are stolen old versions, So no any new updates or support. Advantages of  M1 Scalper Pro  Profitability: M1 Scalper Pro is highly profitable with a strict exit strategy. Frequent Opportunities: M1 Scalper
Volume Delta Candle
Muhammad Muzaffar Hussan
Volume Delta Candles: A Comprehensive Tool for In-Depth Trading Analysis Unlock a seamless way to interpret trading experience within each candle. With Volume Delta Candles, there's no need for additional volume indicators—everything you need is built in. This advanced tool utilizes lower timeframes or live market data to present the percentage of buying versus selling volume within each candle as an intuitive color-coded bar. Before diving in, ensure you’re familiar with Volume and Volume Delta
This indicator presents an alternative approach to identify Market Structure. The logic used is derived from learning material created by   DaveTeaches (on X) Upgrade v1.10: + add option to put protected high/low value to buffer (figure 11, 12) + add  Retracements  value to buffer when Show Retracements When quantifying Market Structure, it is common to use fractal highs and lows to identify "significant" swing pivots. When price closes through these pivots, we may identify a Market Structure S
Cumulative delta indicator As most traders believe, the price moves under the pressure of market buying or selling. When someone redeems an offer standing in the cup, the deal is a "buy". If someone pours into the bid standing in the cup - the deal goes with the direction of "sale". The delta is the difference between purchases and sales. A cumulative delta - the difference between the cumulative sum of purchases and sales for a certain period of time. It allows you to see who is currently contr
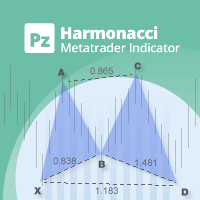
Trade smarter, not harder: Empower your trading with Harmonacci Patterns This is arguably the most complete harmonic price formation auto-recognition indicator you can find for the MetaTrader Platform. It detects 19 different patterns, takes fibonacci projections as seriously as you do, displays the Potential Reversal Zone (PRZ) and finds suitable stop-loss and take-profit levels. [ Installation Guide | Update Guide | Troubleshooting | FAQ | All Products  ] It detects 19 different harmonic pric
Max Min Delta Indicator - Market Volume Imbalance Analysis Gain Deeper Insights into Market Volume Imbalance with Delta Analysis What is the Max Min Delta Indicator? The Max Min Delta Indicator is a powerful market volume analysis tool that visually represents maximum and minimum delta values using a histogram. It helps traders identify market strength, weakness, absorption, and aggressive buying/selling activity with precision. Key Features Histogram Visualization: Displays Max Delta (Green) an
Time and Sales Tick
Pablo Filipe Soares De Almeida
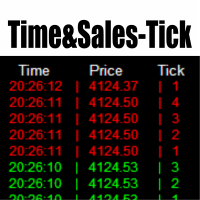
Time & Sales Tick Indicator è un indicatore per MetaTrader 5 che mostra i dati dei tick in tempo reale. Visualizza prezzo, volume dei tick e orario direttamente sul grafico. Funzionalità Mostra i dati dei tick, inclusi prezzo, volume e tempo, in un pannello sul grafico. Raggruppa i tick in intervalli definiti dall’utente, con colori distinti (verde per rialzo, rosso per ribasso). Il pannello può essere posizionato in qualsiasi angolo del grafico.
Harmonic Pattern Structure Harmonic Pattern Structure is a professional MetaTrader 5 indicator that automatically detects classic harmonic patterns using strict Fibonacci ratio validation and XABCD price structure. Designed for traders who value precision, clean visuals, and structured analysis, the indicator highlights potential reversal zones based on price geometry, supporting consistent and objective decision-making. SUPPORTED HARMONIC PATTERNS Gartley (222) Butterfly Bat Crab Shark Cy
Il WaveTrend Oscillator MT5 è un potente indicatore di trading progettato per migliorare la tua analisi di mercato identificando cambiamenti di momentum e potenziali inversioni di tendenza. Ideale per trader di tutti i livelli, questo strumento offre preziose informazioni su condizioni di ipercomprato e ipervenduto in vari mercati, tra cui forex, criptovalute e materie prime. Con la sua capacità di generare segnali di acquisto e vendita accurati, il WaveTrend Oscillator MT5 consente ai trader di
Smart ATR Grid Pro
Syamsurizal Dimjati
SMART ATR GRID PRO++ – Adaptive Grid Intelligence Suite is a next-generation, institutional-grade grid trading indicator engineered for traders who demand precision, adaptability, and comprehensive market structure analysis. By seamlessly integrating   Adaptive Volatility Grid System ,   KAMA Candle Trend Filtering ,   Multi-Factor Trend Detection (ADX + EMA20/50) ,   Dynamic Heatmap Zone Engine , and   Real-Time Market Regime Classification , this indicator delivers a complete decision-making
Noize Absorption Index - is the manual trading system that measures the difference of pressure between bears forces and bulls forces. Green line - is a noize free index that showing curent situation. Zero value of index shows totally choppy/flat market.Values above zero level shows how powerfull bullish wave is and values below zero measures bearish forces.Up arrow appears on bearish market when it's ready to reverse, dn arrow appears on weak bullish market, as a result of reverse expectation.
TRI Visualizer
Yoshimi Mon 三 Ura
TRI Visualizer MT5 – Thermodynamic Market Analysis Overview The TRI (Thermal Range Indicator) Visualizer Enhanced is a rare market analysis indicator that goes beyond conventional technical analysis, applying principles of thermodynamics from physics. It interprets market price fluctuations as “thermodynamic energy,” enabling the highly accurate detection of subtle market changes that are often overlooked. Innovative Mechanisms 1. Dual Calculation Engines Classic TRI Mode Formula: |Close
L'indicatore costruisce le quotazioni attuali, che possono essere confrontate con quelle storiche e su questa base fanno una previsione del movimento dei prezzi. L'indicatore ha un campo di testo per una rapida navigazione fino alla data desiderata. Opzioni: Simbolo - selezione del simbolo che visualizzerà l'indicatore; SymbolPeriod - selezione del periodo da cui l'indicatore prenderà i dati; IndicatorColor - colore dell'indicatore; HorisontalShift - spostamento delle virgolette disegnate d
Price Magnet — Price Density and Attraction Levels Indicator Price Magnet is a professional analytical tool designed to identify key support and resistance levels based on statistical Price Density. The indicator analyzes a specified historical period and detects price levels where the market spent the most time. These zones act as “magnets,” attracting price action or forming a structural base for potential reversals. Unlike traditional Volume Profile tools, Price Magnet focuses on price-time d
Strumento Avanzato di Analisi del Profilo dei Volumi per MetaTrader 5 Il Kecia Volume Profile Order Finder offre ai trader funzionalità di analisi del profilo dei volumi. Questo indicatore per MT5 combina la visualizzazione del profilo dei volumi con calcoli statistici per aiutare a identificare potenziali opportunità di trading e suggerisce livelli di entrata, stop loss e take profit basati sulla struttura del mercato. Visualizzazione del Profilo di Mercato Trasforma il tuo grafico con visualiz
Fabii Half Trend Baseline
Fabien Georges Andre Guillemaud
Smetti di operare contro il trend del timeframe superiore. Due baseline, un grafico. Senza repaint. Qualsiasi coppia, qualsiasi timeframe. Sul tuo grafico in 2 minuti. Demo gratuita nello Strategy Tester. Get more indicators here Baselines, volatility filters and oscillators. No repaint. Perché ti serve Entri in un trade perché una linea è diventata verde sul tuo grafico. Poi apri un timeframe superiore e vedi che il trend più grande punta nella direzione opposta. Il segnale era reale. Il tre
Gods Eye
Oamogetswe Semelo
God’s Eye God’s Eye is a chart-based market-structure and range-planning indicator for MetaTrader 5. It combines daily volatility context with price structure on the active chart timeframe. It is designed to support discretionary analysis and provide data buffers for Expert Advisors; it does not place trades or guarantee trade outcomes. Daily Range Dashboard God’s Eye calculates an average daily high-low range from completed D1 bars and compares it with price movement from the current daily ope
No Demand No Supply MT5
Trade The Volume Waves Single Member P.C.
No Demand No Supply   This indicator identifies   No Demand –No Supply candles to your chart and plots volume bars colored according to the signal. It can be applied to all timeframes or to a specific one only. It can also be used as regular volume indicator  with exceptional future of WEIGHTED VOLUME. Furthermore is has an alert notification, sound and email when a signals occurs. The indicator does not repaint but the alert will come on two candles back due to the definition of No Demand No Su
Descrizione dettagliata dell'indicatore GannZigZagMACD Scopo e concetto GannZigZagMACD è un indicatore tecnico ibrido per la piattaforma MetaTrader 5 che combina il classico indicatore MACD con elementi dello zigzag di Gann. È progettato per identificare inversioni di trend e generare segnali di trading basati su pattern estremi. L'idea principale dell'indicatore è rilevare massimi e minimi significativi utilizzando il metodo di Gann, per poi proiettare questi segnali sull'istogramma MACD. Prin
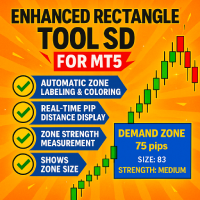
**Indicatore Strumento Rettangolo di Offerta e Domanda Intelligente: La tua guida definitiva per MT5** L'Indicatore Strumento Rettangolo di Offerta e Domanda Intelligente è il tuo compagno ideale per MT5, progettato per visualizzare istantaneamente i dati chiave di offerta e domanda, proprio dove ne hai bisogno: sulle tue zone, in tempo reale. Questo strumento sovrappone automaticamente dati ricchi e actionable sopra le tue zone, come la classificazione della zona, la distanza in pip, la forz
Crash 1000 Scalping Indicator for the Crash 1000 Deriv Synthetic Index. Introduction The Crash 1000 Scalping Indicator is a specialized tool designed for the Crash 1000 index on the Deriv Synthetic market. This indicator is particularly useful for scalping on the M1 timeframe, helping traders to identify precise entry and exit points for buy positions. It is designed to be non-repainting, providing clear signals with audible alerts and push notifications, and is compatible with mobile devices th
AVVISO IMPORTANTE – LICENZA E ATTIVAZIONE RICHIESTE ==================================================== Istruzioni per l'attivazione: Dopo aver completato l'acquisto, contattaci immediatamente per ricevere la tua chiave di licenza, password o dati di attivazione. Senza questi, il software non funzionerà. Siamo qui per garantire un processo di attivazione senza intoppi e assisterti per qualsiasi domanda. --- Volume Delta Profile V2 Enhanced ================================ Strumento Pr
Accesso Ufficiale all'Ecosistema BlueDigitsFx Ricevi aggiornamenti sull'infrastruttura, risorse operative, nuovi prodotti e accesso all'ecosistema ufficiale BlueDigitsFx. Ecosistema Telegram Sito Web Versione MT4 BlueDigitsFx Spike And Strike Reversal MT5 — Oscillatore Composito per l'Analisi delle Inversioni di Mercato e del Momentum BlueDigitsFx Spike And Strike Reversal è un oscillatore composito che combina molteplici segnali di indicatori per aiutare i trader a identificare potenziali i
XAUUSD OrderFlow Structure AutoPOC Pro is an advanced MetaTrader 5 indicator designed to analyze market structure, order flow, buying and selling pressure, liquidity, and volume distribution directly on the chart. The indicator is especially focused on XAUUSD (Gold) analysis, although it can also be used with other instruments available in MetaTrader 5. Its objective is to bring together several analytical tools that would normally require multiple indicators: market structure, BOS and CHOCH, Or
Welcome to the Ultimate Harmonic Patterns recognition indicator that is focused to detect advanced patterns. The Gartley pattern, Bat pattern, and Cypher pattern  are popular technical analysis tools used by traders to identify potential reversal points in the market. Our Ultimate Harmonic Patterns recognition Indicator is a powerful tool that uses advanced algorithms to scan the markets and identify these patterns in real-time. With our Ultimate Harmonic Patterns recognition Indicator, you ca
Gli utenti di questo prodotto hanno anche acquistato
Trend Sniper X
Sarvarbek Abduvoxobov
4.86 (43)
Trend Sniper X è un indicatore trend-following multi-timeframe per MetaTrader 5 che aiuta i trader a identificare la direzione del trend e i potenziali punti di inversione con chiarezza e precisione. per MT4: https://www.mql5.com/en/market/product/193245 Informazioni sul prezzo: Il prezzo attuale è promozionale ed è soggetto a modifiche con il rilascio di futuri aggiornamenti e nuove funzionalità. Offerta Bonus: Per ricevere GRATIS l'Auto-Trade Assistant EA per questo indicatore, invia un messa
Nel 2019 ho mostrato al mondo intero di cosa è capace questo indicatore. Ho operato seguendo i suoi segnali manualmente, su un conto reale, alla luce del sole — il conto era monitorato su Myfxbook e raccontavo in dettaglio il mio esperimento su Facebook. Risultato: in quattro mesi 10.000 dollari sono diventati 941.411. Il rischio era volutamente estremo — il drawdown arrivava fino al 54%, perché nella nostra professione profitto e rischio vanno sempre di pari passo. Lo screenshot di Myfxbook è l
Gann Made Easy è un sistema di trading Forex professionale e facile da usare che si basa sui migliori principi del trading utilizzando la teoria di mr. WD Gann. L'indicatore fornisce segnali ACQUISTA e VENDI accurati, inclusi i livelli di Stop Loss e Take Profit. Puoi fare trading anche in movimento utilizzando le notifiche PUSH. CONTATTAMI DOPO L'ACQUISTO PER RICEVERE GRATUITAMENTE LE ISTRUZIONI DI TRADING E OTTIMI INDICATORI EXTRA! Probabilmente hai già sentito parlare molte volte dei metodi d
M1 Sniper MT5
Oleg Rodin
5 (7)
M1 SNIPER   è un sistema di indicatori di trading facile da usare. Si tratta di un indicatore a freccia progettato per l'intervallo temporale M1. L'indicatore può essere utilizzato come sistema autonomo per lo scalping sull'intervallo temporale M1 e come parte del tuo sistema di trading esistente. Sebbene questo sistema di trading sia stato progettato specificamente per il trading sull'intervallo temporale M1, può comunque essere utilizzato anche con altri intervalli temporali. Inizialmente ho p
Ultra Indicator
Ihor Otkydach
5 (1)
ULTRA è un indicatore tecnico che funziona secondo un approccio “tutto in uno”: analizza autonomamente il mercato, genera segnali di trading, visualizza i livelli per l’impostazione degli ordini stop-loss e suggerisce quando chiudere le operazioni per realizzare profitti o ridurre al minimo le perdite. In altre parole, non importa se non sai come analizzare il mercato, determinare i livelli — dove impostare lo stop-loss — o se hai difficoltà con la gestione del capitale. ULTRA farà tutto questo
Adaptive Price Action Engine Acquista un indicatore, ricevi l'EA gratis Analisi Auto-Ottimizzata del Trend e dei Pattern Candlestick Multi-Timeframe I mercati cambiano continuamente e non tutti i pattern di Price Action hanno lo stesso valore in ogni condizione di mercato. Adaptive Price Action Engine è progettato per adattarsi alle condizioni di mercato in continua evoluzione, combinando struttura del trend, analisi Multi-Timeframe, pattern Candlestick e ottimizzazione statistica in un unico fr
ARICoins
Temirlan Kdyrkhan
ARICoin is a powerful trading companion designed to generate high-probability entry signals with dynamic TP/SL/DP levels based on volatility. Built-in performance tracking shows win/loss stats, PP1/PP2 hits, and success rates all updated live. Key Features: Buy/Sell signals with adaptive volatility bands Real-time TP/SL/DP levels based on ATR Built-in MA Filter with optional ATR/StdDev volatility Performance stats panel (Success, Profit/Loss, PP1/PP2) Alerts via popup, sound, push, or email Cust
Boba Analysis Suite
Trade Ready Solutions LLC
5 (2)
Boba Analysis Suite Boba Analysis Suite è un indicatore di analisi per MetaTrader 5. Riunisce la struttura del mercato, le zone di prezzo rilevanti e il contesto generale del mercato in un’unica visualizzazione del grafico. Sviluppato sulla base dell’esperienza pratica come trader e formatore di trading, supporta un processo di analisi strutturato: valutare la direzione del mercato, individuare livelli importanti e analizzare congiuntamente più intervalli temporali. Analisi nel contesto del merc
ScalpPoint
Temirlan Kdyrkhan
ScalpPoint is a powerful trading companion designed to generate high-probability entry signals with dynamic TP/SL/DP levels based on volatility. Built-in performance tracking shows win/loss stats, PP1/PP2 hits, and success rates — all updated live. Key Features: Buy/Sell signals with adaptive volatility bands Real-time TP/SL/DP levels based on ATR Built-in MA Filter with optional ATR/StdDev volatility Performance stats panel (Success, Profit/Loss, PP1/PP2) Alerts via popup, sound, push, or emai
Zain Gold Scalping
Ahmed Gamal Abdel Nasser Mohamed
Uno strumento completo di analisi della price action basato su una doppia logica di ingresso indipendente – ciascuna confermata da una banda di volatilità – e integrato da un set configurabile di nove filtri di conferma opzionali, che consentono di modulare con precisione il comportamento dei segnali, rendendoli più conservativi o più aggressivi. Strategia Fondamentale Due configurazioni di ingresso indipendenti, ciascuna delle quali si attiva solo quando il prezzo esce da una banda di volatil
Azimuth Pro
Ottaviano De Cicco
5 (7)
Azimuth Pro V2: Synthetic Fractal Structure and Confirmed Entries for MT5 Overview Azimuth Pro is a multi-level swing structure indicator by Merkava Labs . Four nested swing layers, swing-anchored VWAP, ABC pattern detection, three-timeframe structural filtering, and closed-bar confirmed entries — one chart, one workflow from micro-swings to macro-cycles. This is not a blind signal product. It is a structure-first workflow for traders who care about location, context, and timing. Halloween P
Auto Optimized SpeedAngle è un sistema di vettorizzazione del momento di livello istituzionale che elimina l'overfitting ( curve-fitting ) attraverso l'ottimizzazione continua Walk-Forward (WFO). Invece di affidarsi a input statici che si degradano quando i regimi di mercato cambiano, l'indicatore recalibra dinamicamente i suoi parametri utilizzando la validazione Out-of-Sample (OOS), assicurando che i segnali visualizzati rappresentino reali vantaggi statistici anziché anomalie storiche. Quadro
Superhero
Ihor Otkydach
5 (3)
L'indicatore SUPERHERO è un sistema di trading multivaluta progettato secondo un approccio "all-inclusive". L'indicatore analizza autonomamente il mercato e fornisce segnali su quando aprire e chiudere le posizioni. Utilizza ordini Stop Loss e Take Profit. Il rapporto R:R è 1:1. Questo sistema è in grado di inviare notifiche push sul tuo smartphone, consentendoti di effettuare operazioni "in mobilità" senza dover rimanere incollato al PC. È perfetto per le società di trading proprietario. UN OMA
Indicatore multi-valuta di forza e momentum MT5 Dynamic Forex28 Navigator è l'evoluzione dei nostri indicatori popolari da lungo tempo e unisce la potenza di tre strumenti in uno: Advanced Currency Strength28 Indicator (700 recensioni) Advanced Currency IMPULSE with ALERT (530 recensioni) CS28 Combo Signals (bonus attuale) I due indicatori precedenti hanno insieme più di 1.200 recensioni sul MQL5 Market e sono un punto di riferimento nella comunità MT4 dal 2016. Dynamic Forex28 Navigator MT5 por
Volatility Master for MetaTrader is a real-time dashboard tool that scans up to  50 symbols  to identify high-volatility , trending markets instantly. With bullish/bearish signals, customizable alerts, and a user-friendly interface, it helps you avoid range-bound conditions and focus on high-probability trades. Clarity leads to confidence. Trade confidently and protect your capital effectively with this powerful dashboard. We don't offer free or bonus indicators in exchange of reviews from you.
Apex Patterns PRO Acquista l'indicatore - Ottieni GRATUITAMENTE l'Expert Advisor basato su di esso. Intelligenza auto-ottimizzante per pattern grafici e breakout Gli scanner di pattern tradizionali si basano su input fissi, registrando spesso prestazioni inferiori quando la volatilità e le strutture del mercato cambiano. Apex Patterns PRO è progettato per adattarsi alle mutevoli condizioni di mercato combinando il riconoscimento dei pattern grafici strutturali, il filtraggio del momentum e l'au
Neuro Poseidon MT5
Daria Rezueva
4.68 (53)
Neuro Poseidon is a new indicator by Daria Rezueva. It combines precise trading signals with adaptive TP/SL levels - creating best possible trades as a result! Message me and get  Neuro Poseidon Assistant  as a gift to automize your trading process! What makes it stand out? 1. Proven profitability on all assets and timeframes 2. Only confirmed BUY and SELL signals present on the chart 3. Adaptive TP & SL levels generated by the software for each trade 4. Easy to understand - suitable for al
SIO Oscillator: oscillatore auto-ottimizzante dello squilibrio di semivarianza Acquista l’indicatore e ricevi GRATIS l’Expert Advisor (EA) basato su di esso. La maggior parte degli oscillatori tratta ogni movimento di prezzo allo stesso modo. SIO separa la pressione rialzista da quella ribassista e misura lo squilibrio tra le due, mostrando quale parte controlla davvero il mercato: compratori o venditori. Quando lo squilibrio raggiunge un estremo, SIO genera un segnale chiaro con livelli di ingr
Currency Strength Wizard   è un indicatore molto potente che ti fornisce una soluzione all-in-one per un trading di successo. L'indicatore calcola la potenza di questa o quella coppia forex utilizzando i dati di tutte le valute su più intervalli di tempo. Questi dati sono rappresentati in una forma di indice di valuta facile da usare e linee elettriche di valuta che puoi utilizzare per vedere il potere di questa o quella valuta. Tutto ciò di cui hai bisogno è collegare l'indicatore al grafico ch
AriFocus
Temirlan Kdyrkhan
AriFocus - Non-Repainting Buy/Sell Signals AriFocus - one clear signal. AriFocus marks buy and sell signals directly on the chart and suggests a stop-loss level for each one. Every signal is confirmed on bar close and never repaints. - Buy/sell arrows, confirmed on bar close - Suggested stop-loss level for every signal - Trend band and candle coloring to show direction at a glance - 10 ready-made presets, or your own settings (14 calculation methods) - Pop-up, push and email alerts with entr
SkyHammer Signal Pro Indicatore professionale di segnali trend no-repaint con livelli Entry, SL e TP bloccati SkyHammer Signal Pro è un indicatore strutturato di trend e momentum, progettato per trader che desiderano segnali chiari, fissi e verificabili. Funziona al meglio su timeframe bassi, come M1 e M5 . L’indicatore non cerca di prevedere massimi o minimi del mercato. Attende invece una struttura di mercato confermata, una chiara direzione del trend, forza del momentum, volatilità sana e spa
PZ Divergence Trading MT5
PZ TRADING SLU
3.71 (7)
Unlock hidden profits: accurate divergence trading for all markets Tricky to find and scarce in frequency, divergences are one of the most reliable trading scenarios. This indicator finds and scans for regular and hidden divergences automatically using your favourite oscillator. [ Installation Guide | Update Guide | Troubleshooting | FAQ | All Products  ] Easy to trade Finds regular and hidden divergences Supports many well known oscillators Implements trading signals based on breakouts Displays
PainX GainX Blue Spike Fusion AI Synthetic Index Spike Analysis Indicator for MetaTrader 5 Overview PainX GainX Blue Spike Fusion AI is a technical analysis indicator for MetaTrader 5, designed to help traders monitor potential spike setups on compatible synthetic indices. The indicator combines signal monitoring, market-condition analysis, chart markers, notifications, and an on-chart information panel. It presents relevant market information in an organized format to help traders evaluate pote
Apollo SR Master è un indicatore di Supporto/Resistenza con caratteristiche speciali che rendono il trading con le zone di Supporto/Resistenza più semplice e affidabile. L'indicatore calcola le zone di Supporto/Resistenza in tempo reale senza alcun ritardo, rilevando i massimi e i minimi dei prezzi locali. Quindi, per confermare la nuova area SR formata, l'indicatore mostra un segnale speciale che segnala che la zona SR può essere presa in considerazione e utilizzata come un vero e proprio segna
Scalper Vault è un sistema di trading potente e completo, progettato per i trader che desiderano ottenere risultati costanti nel trading intraday. Questo indicatore ad alta precisione funge da sistema di trading autonomo, offrendo analisi di livello istituzionale sia per il mercato Forex che per le Opzioni Binarie. CONTATTAMI DOPO L'ACQUISTO PER RICEVERE I MIEI CONSIGLI DI TRADING E UN FANTASTICO BONUS! Eliminando le congetture e le complesse analisi manuali, Scalper Vault ti permette di concen
The Oracle Pro
Ottaviano De Cicco
5 (1)
The Oracle Pro: Synthetic Multi-Timeframe Bias Engine for MT5 Halloween Promo — 35% OFF The market gets spooky. Your edge stays sharp. Save 35% before this offer fades into the mist. The Oracle Pro is now USD 194 (regular USD 299). The Oracle Pro is a premium multi-timeframe bias engine for MetaTrader 5, built for demanding and professional traders. It answers one question with discipline: what is the directional bias on each timeframe right now, how strong is it, and how much do the timefra
Divergence Bomber
Ihor Otkydach
4.89 (94)
Ogni acquirente dell’indicatore riceverà inoltre gratuitamente: L’utilità esclusiva “Bomber Utility”, che gestisce automaticamente ogni operazione, imposta i livelli di Stop Loss e Take Profit e chiude le posizioni secondo le regole della strategia I file di configurazione (set file) per adattare l’indicatore a diversi asset I set file per configurare il Bomber Utility in tre modalità: “Rischio Minimo”, “Rischio Bilanciato” e “Strategia di Attesa” Una guida video passo-passo per installare, con
Trend Lines PRO MT5
Roman Podpora
5 (1)
LINEE DI TENDENZA PRO       Aiuta a capire dove il mercato sta realmente cambiando direzione. L'indicatore mostra reali inversioni di tendenza e punti in cui i principali attori rientrano. Vedi  Linee BOS   Cambiamenti di tendenza e livelli chiave su timeframe più ampi, senza impostazioni complesse o rumore inutile. I segnali non vengono ridisegnati e rimangono sul grafico dopo la chiusura della barra. VERSIONE MT 4     -      Svela il suo massimo potenziale se abbinato all'indicatore   RFI LEVE
FootPrint Chart MT5
Gayathiri Gopalakrishnan
5 (1)
Turn every candle into a bid x ask footprint built from real tick data. See who is actually trading at each price, with delta, volume profile, imbalance zones and a scored setup engine that prints entry, stop and target Order Flow Footprint Chart Pro Most indicators tell you what price did. This one tells you who did it. Order Flow Footprint Chart Pro rebuilds every candle on your chart from raw tick data and shows you the volume that traded at each individual price inside it, split into the am
Quantum TrendPulse
Bogdan Ion Puscasu
5 (26)
Ecco   Quantum TrendPulse   , lo strumento di trading definitivo che combina la potenza di   SuperTrend   ,   RSI   e   Stocastico   in un unico indicatore completo per massimizzare il tuo potenziale di trading. Progettato per i trader che cercano precisione ed efficienza, questo indicatore ti aiuta a identificare con sicurezza le tendenze di mercato, i cambiamenti di momentum e i punti di entrata e uscita ottimali. Caratteristiche principali: Integrazione SuperTrend:   segui facilmente l'andame
Altri dall’autore
Meridian Signal
Muhammad Okasha Razaq
Introducing Meridian Signal, a trend-following signal indicator that turns every trend reversal into a clear, ready-to-use trade plan. Meridian tracks the market's direction with an adaptive trend line built from price channels, short moving averages, and ATR volatility. When the trend reverses, it marks the signal on your chart and instantly calculates your Entry, Stop Loss, and Take Profit. Everything you need to plan a trade is in one place, helping you spend less time analyzing and more tim
Obsidian Trend
Muhammad Okasha Razaq
Obsidian Trend: Trend Reversal Signals with a Live Dashboard Obsidian Trend is a trend-following indicator that displays the market's direction as a single step-style trend line. When the trend reverses, it marks the change with an arrow and a BUY/SELL tag displaying the signal price. A live dashboard panel on the chart shows the current trend, the latest signal, and how price has moved since the signal appeared. The trend line follows the market using recent highs and lows over an adjustable A
Helix Ribbon
Muhammad Okasha Razaq
Introducing Helix Ribbon, a trend-following ribbon indicator that turns every trend crossover into a clear, ready-to-read signal. Helix tracks the market's direction with two moving averages: a fast Triple Exponential Moving Average (TEMA) and a slow Hull Moving Average. The space between them is drawn as a flowing, color-shifting ribbon with thin strands inside it. When the fast line crosses the slow line, the ribbon twists and Helix marks the new trend on your chart with an arrow and a BUY/SEL
Vantage Bands
Muhammad Okasha Razaq
Introducing Vantage Bands, a multi-layer trend indicator that combines a Natural Moving Average, an anchored VWAP, a Bollinger cloud and a Kalman-smoothed Hull crossover into one clean chart overlay. Vantage reads the market in layers. The Natural Moving Average (NMA) shows the main trend and changes color with its slope. The anchored VWAP shows where the session's volume-weighted price sits. The Bollinger cloud shows how stretched price is. Two Kalman-filtered Hull lines, a Hull Trend line and
Zygos TDI
Muhammad Okasha Razaq
Introducing Zygos TDI, a Traders Dynamic Index indicator that turns RSI momentum, volatility and trend into one clear, ready-to-read window. Zygos builds on the classic TDI idea. It smooths the RSI into a fast price line and a slower signal line, then wraps them in volatility bands and a colour-changing baseline. When the price line crosses the signal line, Zygos marks the exact bar with an arrow. The bands show how stretched the market is, the baseline shows which way momentum is leaning, and t
Themis SMC
Muhammad Okasha Razaq
Introducing Themis SMC, a Smart Money Concepts indicator that puts market structure, order blocks, liquidity, fair value gaps, premium and discount zones and rule-based entry signals on one clean chart overlay. Themis reads the market in layers. Internal and swing structure show every Break of Structure (BOS) and Change of Character (CHoCH). Order blocks mark the zones where price is likely to react. Equal highs and lows show resting liquidity. Fair value gaps show imbalance. The premium and di
Nova Exhaustion
Muhammad Okasha Razaq
Introducing Nova Exhaustion , a trend exhaustion indicator that finds the bar where a move runs out of steam. It combines a 9-count setup, a filled SuperTrend and automatic support and resistance levels, all on one clean chart overlay. Nova Exhaustion counts consecutive closes against the close four bars earlier. Nine closes in a row below it mark selling exhaustion and a BUY. Nine closes in a row above it mark buying exhaustion and a SELL. The counts at 7 and 8 warn you early that a 9 is close.
Vortex Anchor
Muhammad Okasha Razaq
Introducing Vortex Anchor , a multi-level market structure and Anchored VWAP indicator that brings swing analysis, trend bias, key price levels and entry signals together in one chart. Vortex Anchor tracks market structure through four independent ZigZag swing levels, each designed to highlight a different degree of price movement. From small local swings to major structural turning points, every level has its own marker, making it easier to distinguish short-term movements from broader market d
Axiom RSI
Muhammad Okasha Razaq
Introducing Axiom RSI , a momentum and trend analysis indicator that combines advanced RSI calculations, moving-average trend detection, a color-coded histogram and rule-based BUY/SELL signals in one integrated indicator. Axiom RSI combines RSI momentum with fast and slow moving-average channels to identify bullish, bearish and neutral market conditions. It offers multiple RSI calculation methods and customizable trend filters to adapt the analysis to different trading approaches. When the sele
Trinity Nexus
Muhammad Okasha Razaq
Introducing Trinity Nexus , a multi-indicator trend analysis tool that combines Flux, Core Trend, Pulse, and Anchor to identify market direction and generate aligned BUY/SELL signals. Trinity Nexus evaluates the selected indicators together, generating signals when all enabled components agree on market direction. It also offers configurable signal modes, trend-strength analysis, and an interactive dashboard for monitoring market conditions. Key Features: Four Indicator Components: Combines Flu
Filtro:
Nessuna recensione
Rispondi alla recensione