Kingdom Range 90
- Indicatori
-
Lewis Kosasih
 Trading since 2009.
- Versione: 1.0
Kingdom Range 90 draws, for XAUUSD (gold) and BTCUSD, the range in which the high and the low of the current day and of the current 4-hour bar have historically stayed about 90% of the time. It is a free tool from EA Kingdom.
It is not a buy or sell signal. The figures below are historical statistics, not a promise.
WHAT YOU SEE
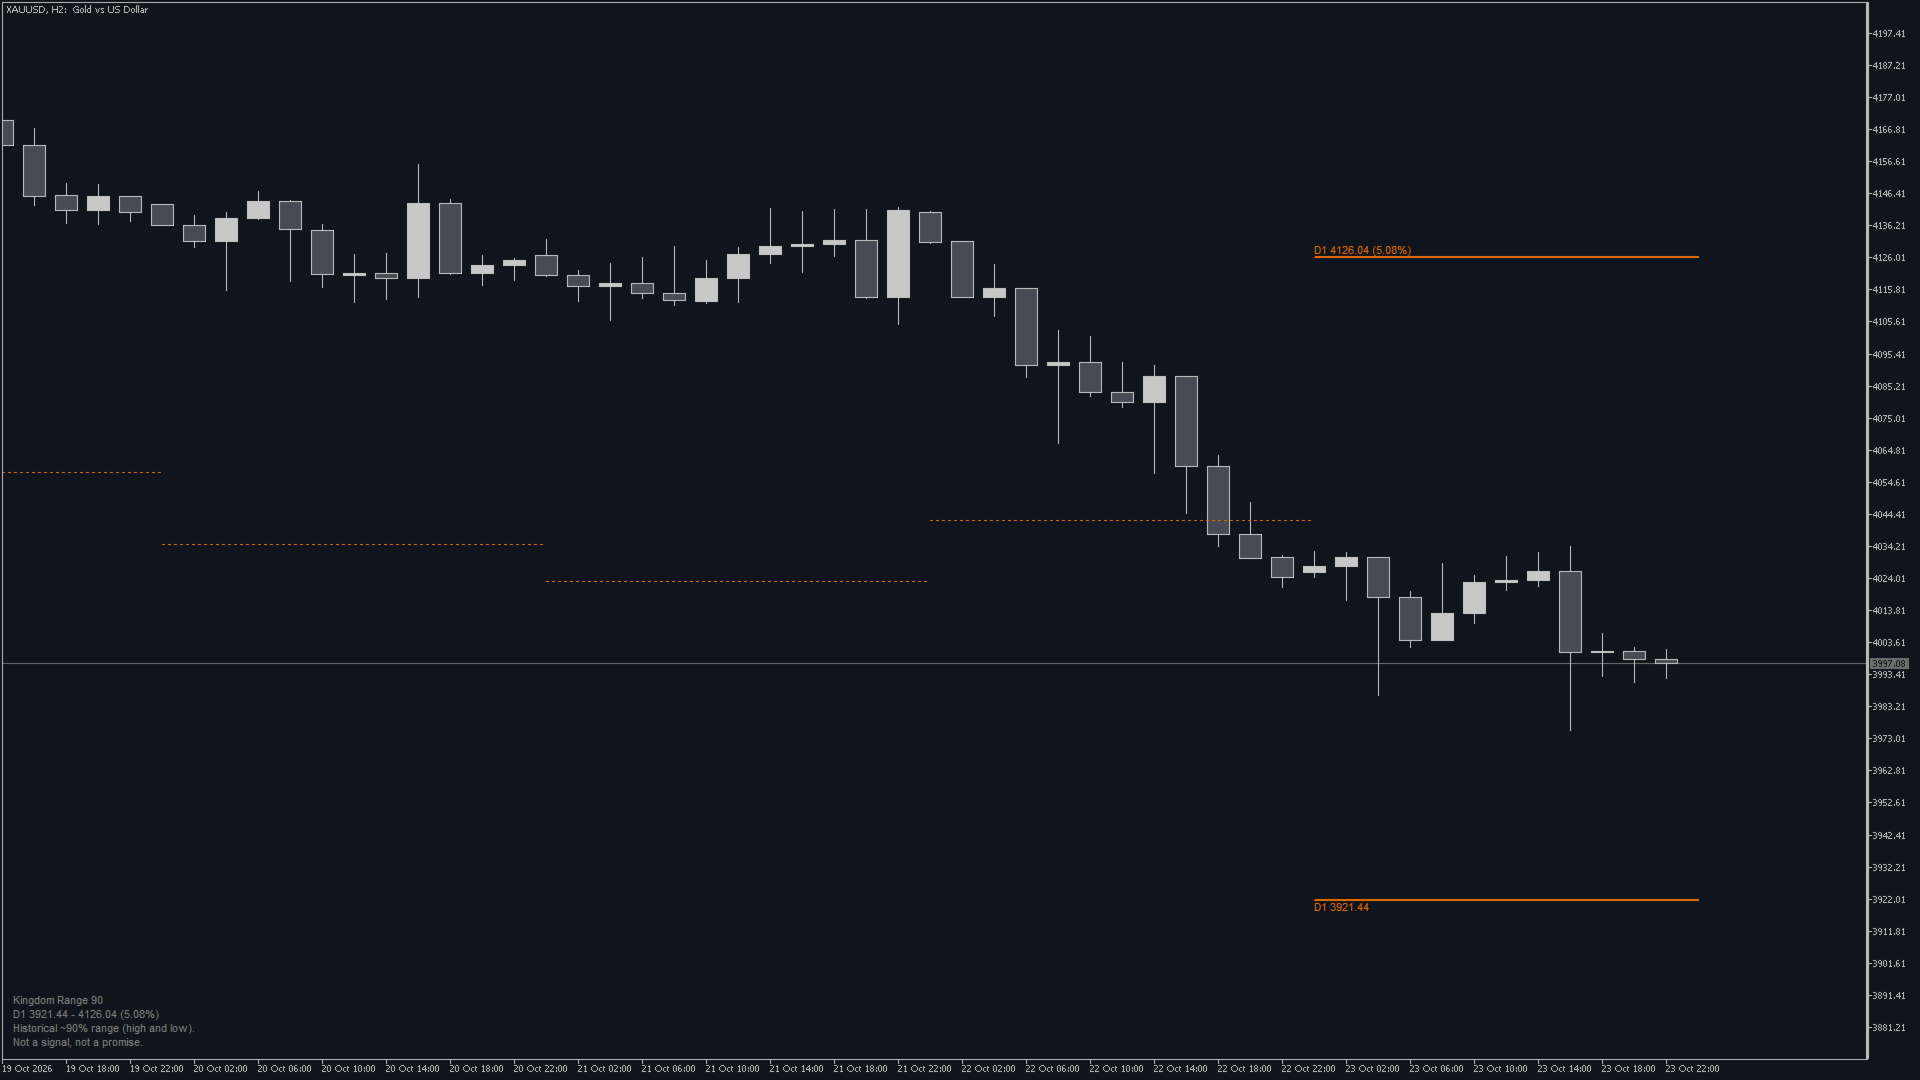
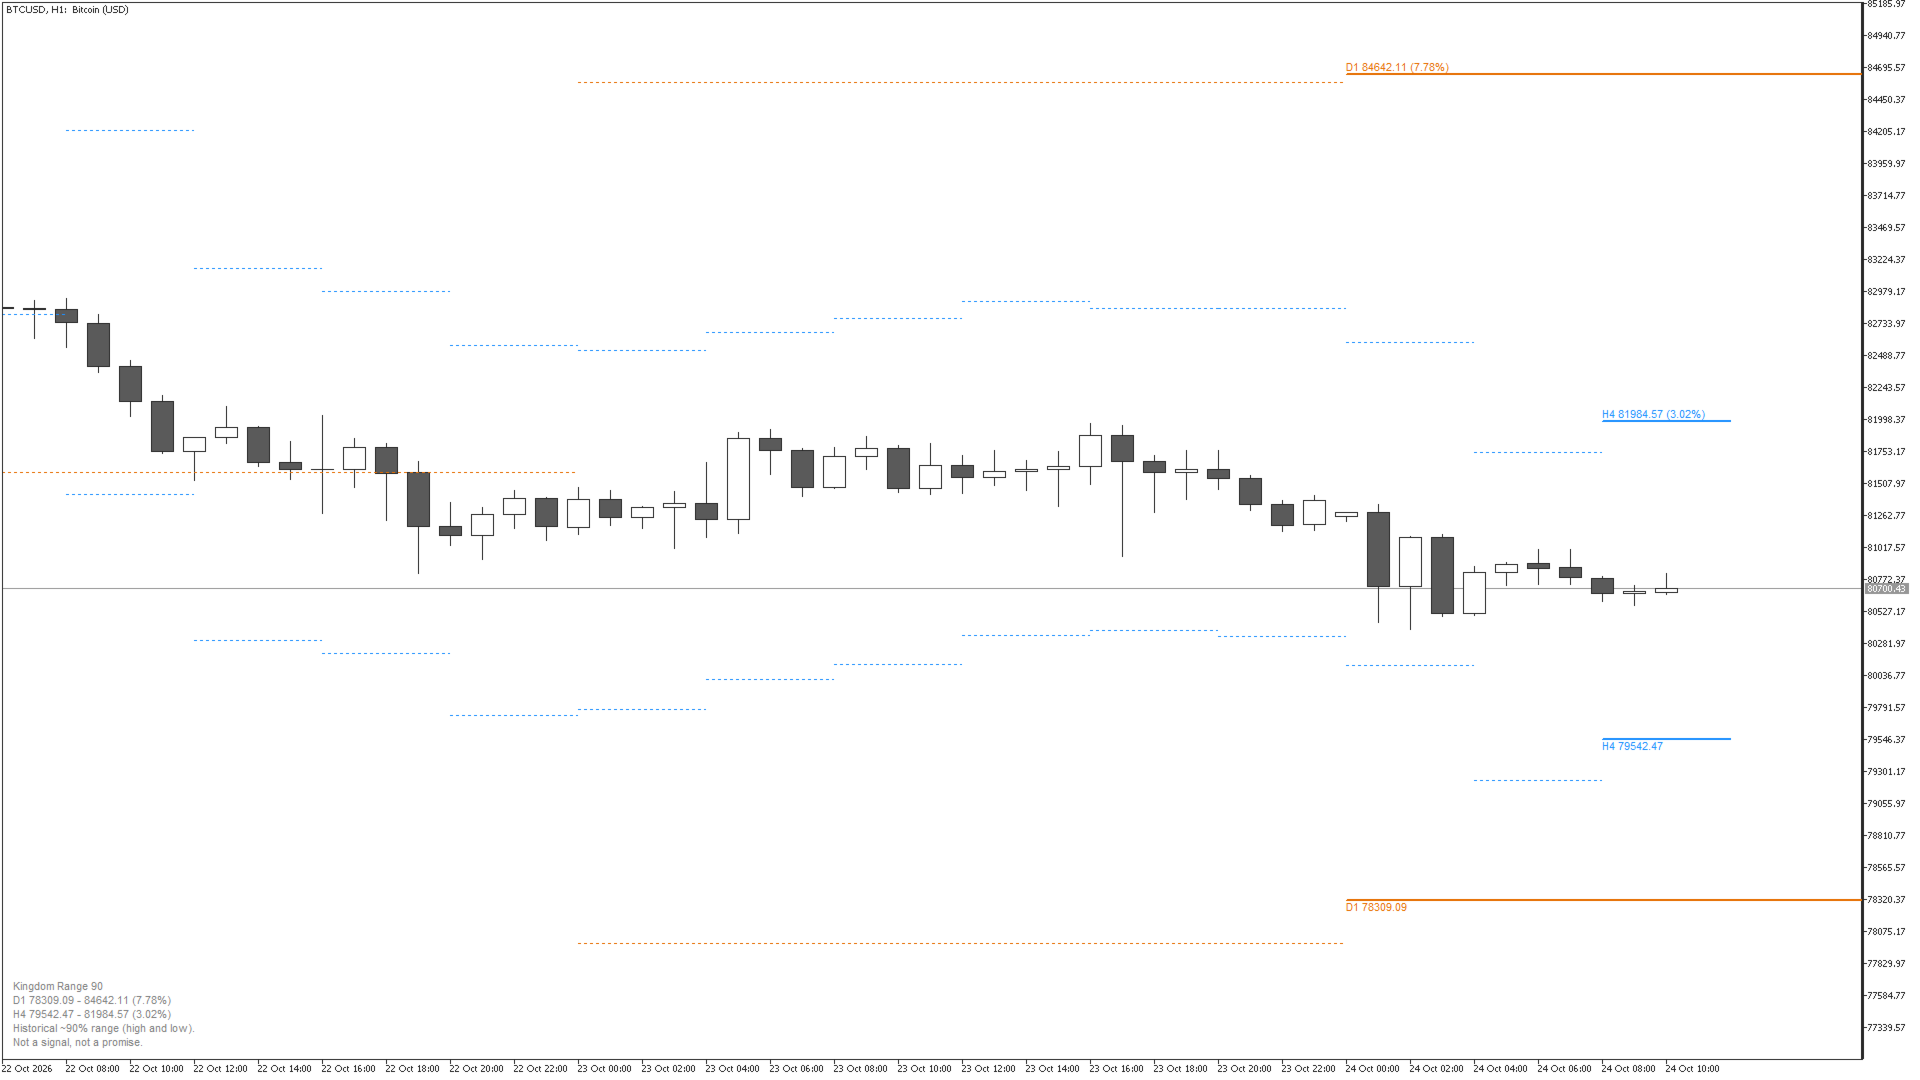
- Two lines for today (D1), orange by default: an upper and a lower limit for the running day.
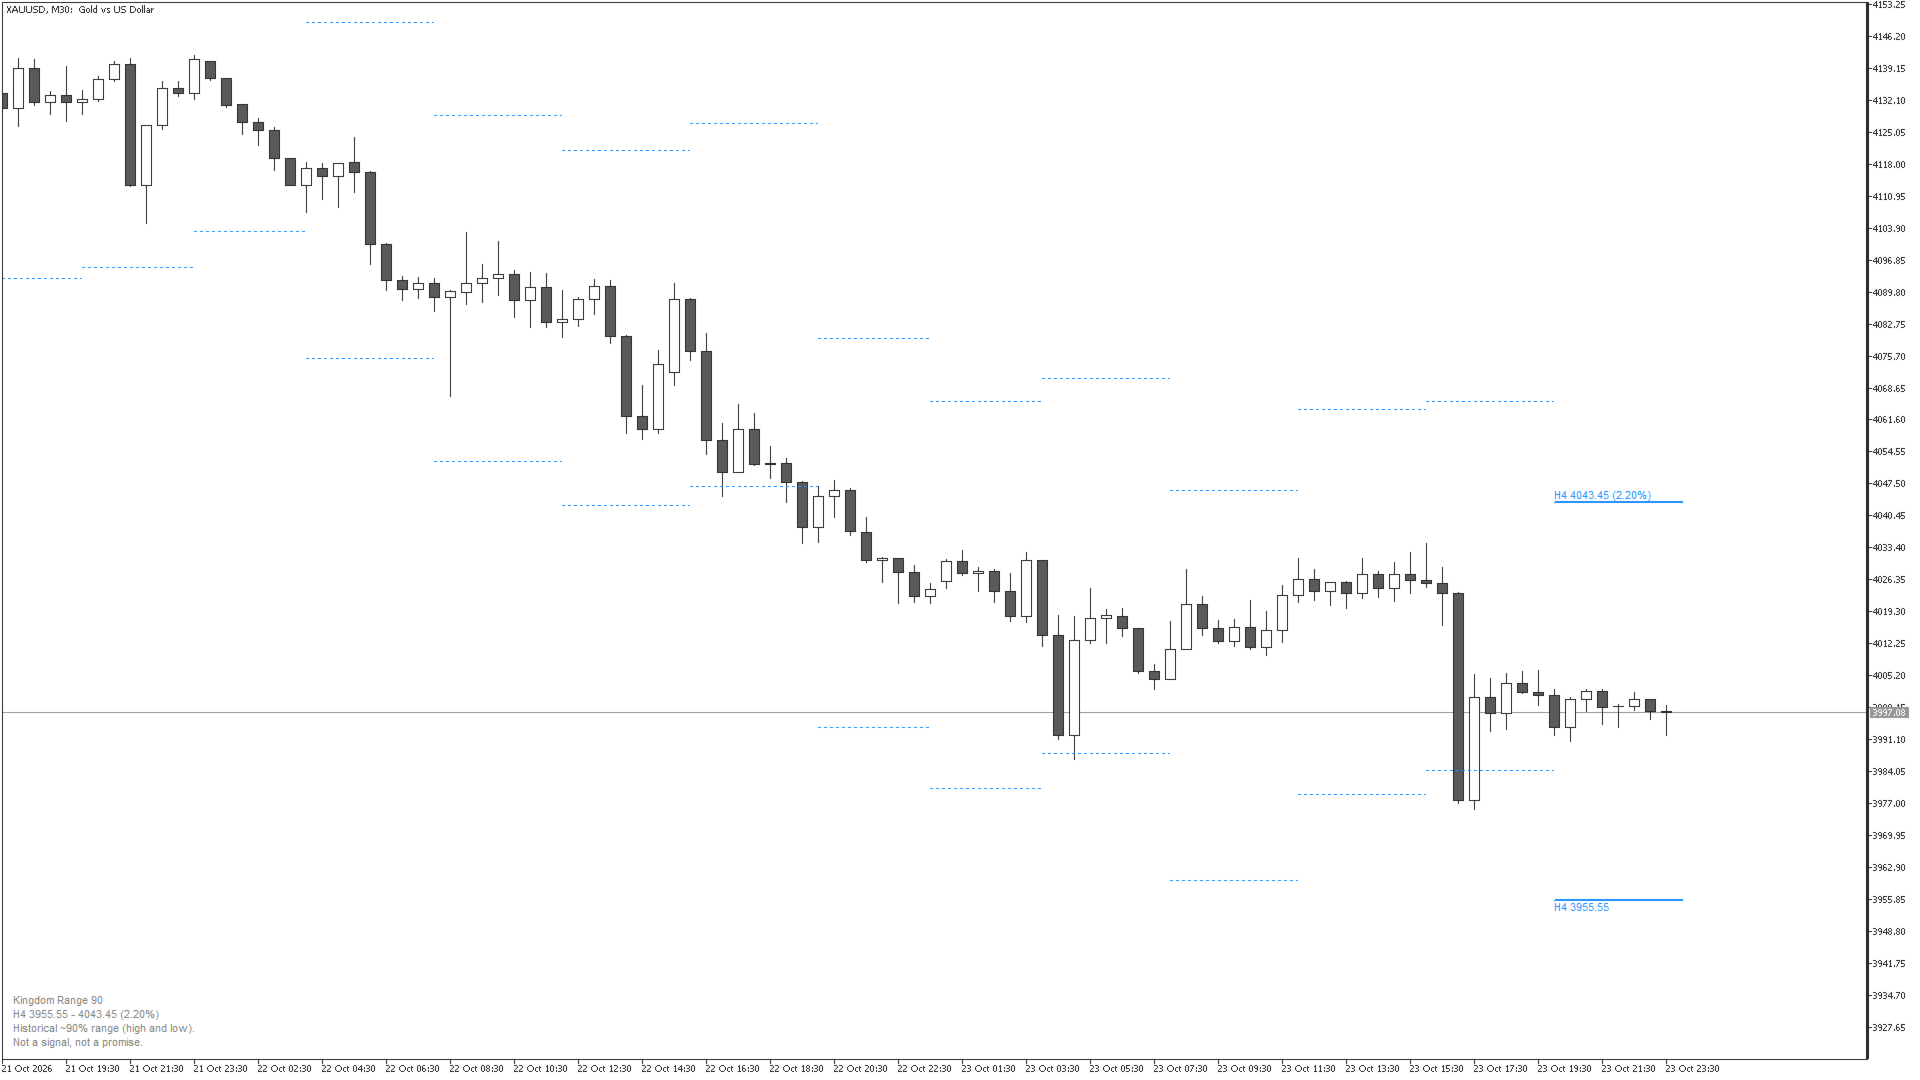
- Two lines for the current 4-hour bar (H4), blue by default.
- A short text block in the chart corner with both ranges (the lower and the upper limit in the symbol's digits, and the width of each range in percent) and the note "Historical ~90% range (high and low). Not a signal, not a promise."
- Optional history: the ranges of up to 200 earlier bars, so you can see for yourself how often price stayed inside.
- The same display on any chart timeframe, from M1 to D1.
HOW TRADERS USE IT
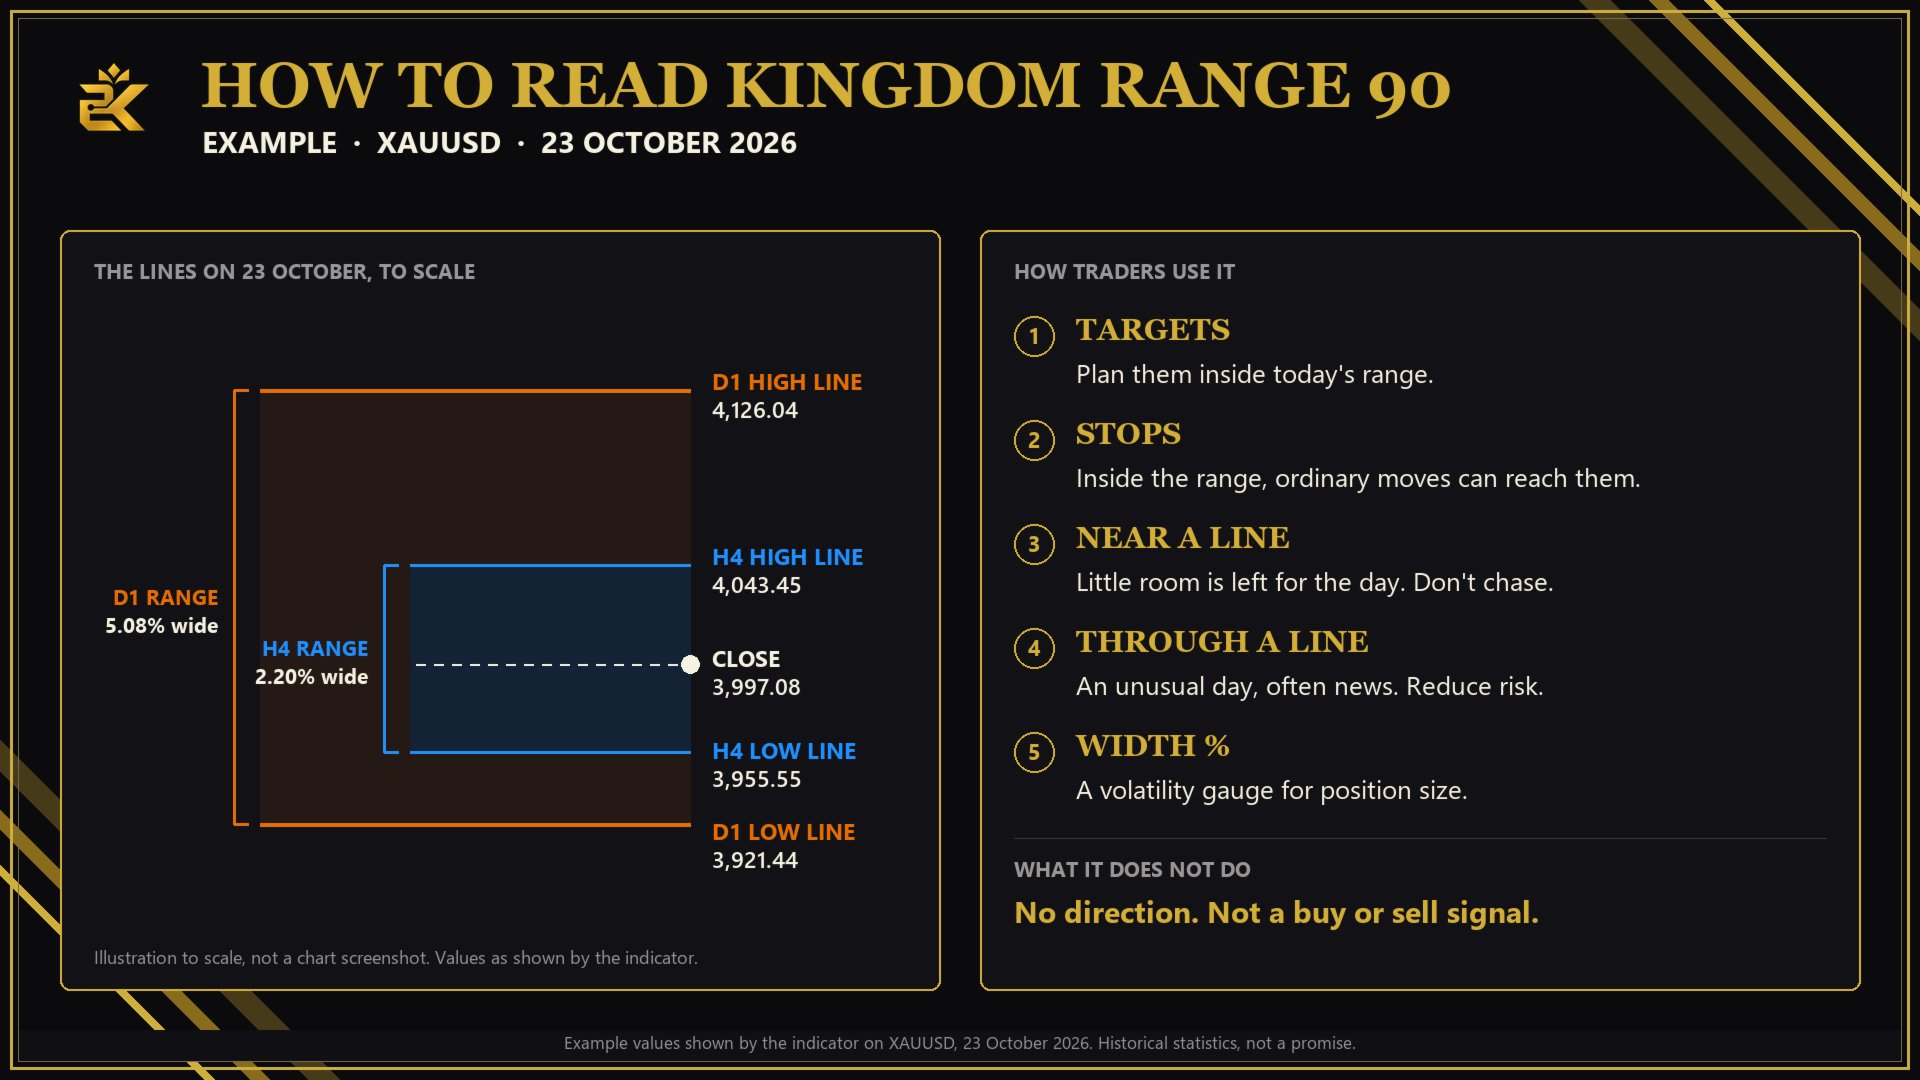
Example, XAUUSD on 23 October 2026 (IC Markets): the D1 range was 3,921.44 - 4,126.04 (5.08% wide), the H4 range of the last 4-hour bar was 3,955.55 - 4,043.45 (2.20% wide), and the day closed at 3,997.08, inside both ranges.
- Plan targets inside today's range. On that day a target above 4,126.04 lay beyond the D1 line; in the test years the high and low of a XAUUSD day both stayed inside the D1 lines 87.6% to 89.2% of the time.
- Place stops with the range in mind. A stop well inside the range sits where the ordinary movement of the day can reach it.
- Near a line, little room is left for that day or that 4-hour bar. Chasing price there means trading into the edge of the usual range.
- A break through a line marks an unusual day, often around major news. It is a reason to reduce risk, not to add to it.
- The width in percent is a volatility gauge (5.08% for D1 on that day). A wider range means larger ordinary swings for the same lot size.
WHAT IT DOES NOT DO
- It does not show a direction: the lines describe how far price usually travels, not which way.
- It does not give buy or sell signals.
HOW IT IS CALCULATED
From the last completed D1 or H4 bar: upper limit = close + a fixed multiple of ATR(14), lower limit = close minus a fixed multiple of ATR(14). ATR uses Wilder's smoothing, calculated by the indicator itself. The multiples are fixed per symbol and timeframe. They were calibrated on IC Markets data from 2020 to 2023 and tested on data from January 2024 to October 2026.
The range of a running bar is set when the bar opens and does not change until the next bar: no repainting. The indicator recalculates only when a new D1 or H4 bar opens, not on every tick.
TESTED COVERAGE
Share of bars whose high and low both stayed inside the range, on IC Markets data (test years, not used for calibration):
- XAUUSD D1: 89.2% in 2024, 87.6% in 2025, 88.9% from January to October 2026
- XAUUSD H4: 90.0% in 2024, 90.4% in 2025, 90.4% from January to October 2026
- BTCUSD D1: 86.9% in 2024, 90.7% in 2025, 90.8% from January to October 2026
- BTCUSD H4: 89.3% in 2024, 90.4% in 2025, 90.6% from January to October 2026
REQUIREMENTS AND LIMITS
- Calibrated for XAUUSD and BTCUSD only (broker suffixes such as XAUUSD.r are recognized). On other symbols the indicator shows the note "this symbol is not calibrated" and draws nothing.
- Calibrated on IC Markets bars with New York close server time (GMT+2/GMT+3). If your server time differs, the indicator shows a note, because daily and 4-hour bars form differently and the 90% coverage does not apply.
- Prices on other brokers differ slightly (spread, server time), so coverage can shift.
- The range does not know the news calendar. On days with major releases such as NFP, FOMC or CPI, price is more likely to leave the range.
- The multiples are fixed. A new calibration would be a new version, with its own tested coverage table.
- No DLL, no web requests, no file writing, no trading functions, no account data.
INPUTS
Show D1 range, Show H4 range, D1 color (orange by default), H4 color (blue by default), Line width (1 to 5), History bars (0 to 200) and Text corner. There is no input to change the multiples.
Past statistics do not guarantee future market behavior. Use the range as context for your own decisions, together with your own risk management.