Market State Intelligence OBV Contour

MSI-OBV Contour 


What It Is 


MSI-OBV Contour is an Expert Advisor that reads the On-Balance Volume (OBV) flow of the market across three higher timeframes plus the chart timeframe, applies envelope bands to that flow, and only enters when the path of least resistance is clear. It is designed for the trader who wants to make fewer, better decisions rather than chase every candle.

It ships as a single file. The OBV engine is embedded inside the EA as a compiled resource  so you don't need to install, maintain, or configure a separate indicator. Attach the EA, and the analysis engine comes with it. The indicator is also auto-attached to a subwindow on first run for visual reference.

There is no daily tuning, no manual tracking of divergence patterns, no afternoon spent watching for the regime to flip. The EA watches, aggregates, decides, and executes.

The Edge  (What you see that others may not)

Most OBV tools show you a squiggly line. MSI-OBV Contour asks three questions about it:

1. Where is the OBV relative to its own midpoint? :This is the regime: bullish, bearish, or neutral. Not a subjective read. A number, compared against a threshold.

2. Which direction is the OBV moving? :This is the slope, expressed through gradient-aware colour coding of the OBV line itself. Four colours, each carrying a distinct meaning (you can change these via inputs):

  • Aqua : accelerating bullish (up and getting stronger)

  • Steel blue : decelerating bullish (up but losing momentum)

  • Gold/gray : flat, no clear direction (this is the mid-point line)

  • Saddle brown : decelerating bearish (down but losing momentum)

  • Orange : accelerating bearish (down and getting stronger)

The transition between colours is a signal in itself. When the line flips from steel blue to aqua, momentum is strengthening. When it flips from orange to saddle brown, the down move is losing conviction. You see this at a glance, without checking any number.

3. How far has it stretched from its midpoint, in volatility units? : This is proximity. It tells you where the OBV currently sits within its range: near the midpoint (small values ;a move that has just started, or a consolidating market), in the healthy middle band (moderate values ; a developed trend with room left to run), or stretched toward the extreme (large values ; an extended move, or a strong trend holding at the range edge).

Proximity is a distance metric, not a freshness metric. Freshness is a separate column: age, shown in brackets next to the regime and slope values ( ▲ BULL [14] means the bullish regime has held for 14 bars). Age tells you how long. Proximity tells you how far. Together they distinguish a fresh move that has barely begun from a fresh move that has already travelled far.


Then the EA does something most indicators don't: it wraps the OBV in envelope bands scaled to the OBV's own rolling range. Not a fixed percentage, not a standard deviation guess ; the bands adapt to the instrument's behaviour. When the market is quiet, the bands narrow. When it's moving, they widen. The band boundary becomes a natural decision line that self-calibrates.

A note on the bands. The OBV can stay near the outer band for extended periods during strong trends. This is normal, a strong trend pushes the OBV to the range edge and holds it there. The band gate is therefore permissive by default design, and can be fully disabled by the trader who wants to trade strong trends to their extremes. When enabled, it acts as a discipline for stacking additional positions, not as a signal to exit existing ones.

The Decision Hierarchy  (How Signals Combine)

Every entry the EA takes is scored against a hierarchy of confluences. The more confluences that agree, the stronger the signal. In order of importance:

Tier 1 — Structural Alignment (highest weight)

  • HTF (higher timeframe) consensus is bullish (for BUY) or bearish (for SELL)

  • Chart-TF regime agrees with HTF

  • The OBV is inside its bands, not at the outer edge (if band gate enabled)

If any of these fail, the trade is rejected. These are the non-negotiables. They answer: "Is the market structurally in my favour?"

Tier 2 — Momentum Confirmation

  • Chart-TF slope agrees with the entry direction

  • The regime is fresh (few bars since the last flip) rather than stale

  • Proximity is in the healthy range (not touching the midpoint, not stretched to exhaustion)

These weight the confidence. They answer: "Is the momentum real, or is this a false start?"

Tier 3 — Timing Refinement

  • Signal freshness: momentum or X-cross arrow appeared on this bar, not five bars ago

  • Divergence confirmation (when enabled)

  • Confidence matrix score above the user's threshold

These gate the final entry. They answer: "Is now the right moment, or should I wait?"

What this means in practice: The EA never enters on a single signal. It enters when a stack of independent reads agree. When they don't, you get a reason in the panel such as; "HTF SLOPE mismatch", "Band gate — OBV at upper band", "Pyramid blocked — earlier position not at BE" , so you always know why a trade did or didn't fire.

The Drive Modes (Choosing Your Trading Personality)

EVENT mode is for the trader who wants clean, bounded entries. One signal, one trade. The EA waits for a momentum flip or an X-cross, enters, and then stays out until the next signal. Disciplined, selective, does not chase. If you want a "one signal, one decision" style, this is your mode.

STATE mode is for the trader who wants to build position(s) while a trend holds. Once the regime and slope agree, the EA attempts a new entry on every bar, up to your positions cap. It is passive on the way in and lets the market decide how much size the trend deserves.

STATE mode is pyramiding, there is no "pyramiding off" variant. If you don't want to pyramid, use EVENT. Two clean semantics, no ambiguity.

Self-Scaling Pyramiding (How It Protects You)

When STATE mode adds to a position, two gates must both pass:

The BE gate. All existing same-direction positions must already be at breakeven or better. In plain terms: the EA only stacks on winners that have already paid for their risk. The first position must have earned its escape hatch (SL at entry or better) before the EA is allowed to double down. You are never adding size onto a losing trade.

The band gate (if enabled). The OBV must be inside its envelope bands. If the OBV has reached the outer band, the pyramid gate closes by design  (the EA will not add a new position at the range extreme). This does not affect existing positions; only new pyramids are blocked.

The combined effect is self-scaling pyramiding: on a strong trend, entries accumulate. On a stalling trend, they don't. The EA adds position when the market continues to pay for it, and stops adding when the OBV reaches its range extreme.

A note on "size". If you are running fixed lots, the EA adds positions of the same size (the total exposure grows by one lot per pyramid). If you are running risk-percent or equity-percent sizing, the EA adds size, because the position itself is larger as equity grows. The distinction matters: fixed lots pyramid quantity, percent-based sizing pyramids both quantity and aggregate exposure.

The Confidence Matrix  (Reading the Odds at a Glance)

The panel shows a 2×2 confidence matrix:

UP

DOWN

TREND

TrendConfUp

TrendConfDn

REVERT

RevertConfUp

RevertConfDn

Each cell is scored 0–100. TREND reflects how strongly the market agrees with continuation. REVERT reflects how strongly it agrees with reversal. The two are independent ; both can be high during a transition, both can be low during consolidation.

You can glance at this and know whether the environment favours trend-following or reversal-hunting. The EA can gate entries on this matrix if you choose, or ignore it and rely on the structural filters.

For traders who want more discipline, the gate modes offer three ways to filter:

  • ABSOLUTE : require a minimum confidence in the entry direction

  • NET : require the confidence in your direction to exceed the opposite side by a margin

  • BOTH : require both conditions

The default is off. Enable it when you want fewer, higher-quality entries.

Risk Management (Full Trade Lifecycle)

The EA manages every trade from entry to exit.

On entry:

  • Fixed lots, risk-percent sizing, or equity-percent sizing

  • (Risk-percent sizing requires a non-zero StopLossPoints ; the EA needs a stop distance to calculate lot size from your risk budget.)

  • Automatic lot cap by balance, instrument multiplier, and margin safety

  • Position caps per direction

  • Optional spacing between same-direction entries (avoids stacking multiple trades around the same price)

  • Spread gate and session filter (set what spread  and times you don't want to trade beyond)

In the trade:

  • Take profit and stop loss set at entry, with broker minimum-distance enforcement

  • Breakeven moves the SL to entry ± buffer once the position reaches a profit threshold

  • Trailing stop steps the SL forward as profit grows, never worse than entry, never inside the broker's freeze band

  • Partial close can take a portion of the position off at a profit target while leaving the runner

  • Five trail stages are tracked and shown visually: grey (initial), dodger blue (breakeven), yellow (stage 1), orange (stage 2), lime (locked). On-chart lines change colour as the position advances through the stages. Optional PnL labels at the right edge of the chart show exactly how much profit is locked at each stage.

On exit:

  • Signal reversal (momentum or X-cross, or either)

  • HTF flip

  • TP or SL reached

  • Every close is logged with a reason such as; "exit signal", "HTF flip", "reversal" , so you can review your trade history and see what triggered each close.

Advanced safety:

  • No-money cooldown : the EA pauses for 10 seconds after a broker "insufficient funds" error

  • Retry logic on trades with proper freeze-level handling : no phantom positions from rejected orders

  • Margin safety at every step : the EA never opens a position it can't afford

Managing manual trades. Set MagicNumber = 0 and the EA will manage any position on the symbol, including trades you opened by hand. This includes trailing stops, breakeven, partial closes ( everything the EA does for its own positions). Useful when you want to open a trade manually but have the EA manage the exit.

Trend-Friendly Settings (How to Configure for One Direction)

If your market view is long-only, or you're in a bull regime and don't want the EA to fight it:

  • Set MaxSellPositions = 0 (the EA will not open a single short/sell trade)

  • Set MaxBuyPositions = 2 (or more) ;allows pyramiding on the long/buy side only

The same in reverse for short-only setups. The EA respects the caps absolutely. All signals in the suppressed direction are dropped silently; only the allowed direction can fire.

Combine this with the HTF filter set to SLOPE and you have a directional bias that the EA will not fight. If the HTF says bearish and you've disabled shorts, the EA simply waits,  it doesn't take a counter-trend long. It sits out until the HTF agrees.

Ease of Use  (What You Actually Have to Do)

  1. Install : drop the single .ex5 file into your MQL5\Experts\ folder. That's it. The indicator engine is embedded.

  2. Attach : drag the EA onto a chart. The OBV indicator attaches automatically to a subwindow.

  3. Choose your drive mode : EVENT for one entry per signal, STATE for pyramiding.

  4. Set your risk : fixed lots, or risk percent, or equity percent. Set your TP and SL.

  5. Watch : the panel tells you what the EA is doing, what it's blocked on, and why.

Everything else has sensible defaults. You can run the EA with the default configuration out of the box and get a working, disciplined trading system. Every parameter is there if you want to tune it, but none of them are required to get started.

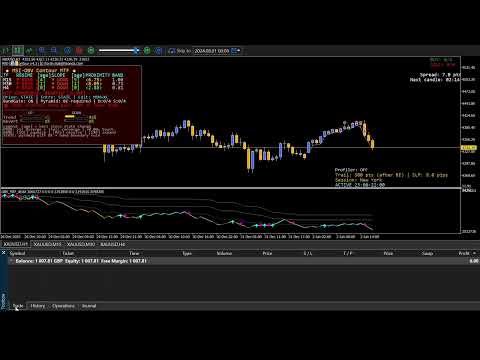
The embedded indicator alone, an MTF OBV engine with bands, proximity, divergence detection, and gradient colour coding,  is worth more than $100 as a standalone tool (indicator's multi timeframe panel turned off by default, setting Enable MTF Panel= true turns it on via its properties if desired: see image 5 in snapshots). It ships at no extra cost inside the EA.

The Questions It Answers for You

"Is the market in a trend right now?"
→ Read the HTF CONSENSUS line. If it says BULLISH or BEARISH, yes. If NEUTRAL, no.

"Which direction should I be biased?"
→ Read the panel's regime and slope columns for each timeframe. The consensus reflects the majority view.

"Is this move real or just noise?"
→ Check the confidence matrix. High TREND confidence with low REVERT means the market agrees with continuation. High REVERT with falling TREND means the move is losing steam.

"Is momentum accelerating or fading?"
→ Read the OBV line colour. Aqua = accelerating bullish. Orange = accelerating bearish. Steel blue and saddle brown are the "losing steam" stages (often the earliest warning that a trend is about to pause).

"Should I add to my position?"
→ If you're in STATE mode and the panel shows the pyramid counter increasing, the EA thinks so. If it shows the pyramid counter flat while positions exist, the pyramid gate is blocking (usually because the earlier entries aren't yet at breakeven).

"Is my trade at risk?"
→ The trail line on the chart tells you the current SL. Its colour tells you the stage. If it's yellow, you're locking in small profit. If it's lime, you've locked in meaningful profit. The BE horizon line (if enabled) shows the floor the trail will never cross.

"Why isn't the EA taking this trade?"
→ Read the trade status line at the bottom of the panel. It names the gate that blocked. "HTF SLOPE mismatch" means the higher timeframe disagrees. "Band gate — OBV at upper band" means the OBV is at the range edge. "Pyramid blocked — 1 BUY not at BE" means the earlier position hasn't paid for its risk yet.

"What's the current spread, session, and time to next candle?"
→ Top-right and bottom-right of the panel. Spread is colour-coded red when it exceeds your maximum.

"I opened a trade manually, will the EA manage it?"
→ Set MagicNumber = 0 . The EA will trail, breakeven, partial-close, and exit any position on the symbol.

The Bottom Line

MSI-OBV Contour is not a black box. Every decision the EA makes is visible, reasoned, and logged. It aggregates multiple independent reads of the market (including regime, slope, proximity, band phase, HTF consensus, signal freshness, confidence) and only acts when enough of them agree.

It trades when the market says to trade. It pyramids when the market pays for it. It stops when the market says to stop. And it tells you why, every time, in plain language on the panel.

Single file deployment. Embedded engine. Minimal configuration. Full trade lifecycle management.

For the trader who wants a disciplined, self-contained system that runs on the OBV edge without requiring constant attention, MSI-OBV Contour delivers.

Altri dall’autore
Cumulative Volume Delta (CVD) MA-X Plus: Il Framework Definitivo per l'Order Flow Sblocca le meccaniche nascoste del mercato con il CVD MA-X Plus . Mentre gli indicatori di volume standard ti dicono solo quanto è stato scambiato, il CVD MA-X Plus ti dice chi sta vincendo la battaglia, quando la sta vincendo e dove è ancorato lo "smart money". Aggregando l'azione del prezzo a livello di tick (impostabile su Real Volume per i mercati regolamentati come Azioni/Futures/Oro) e la distribuzione del vo
The Ultimate Ichimoku MTF Dashboard: Your All-In-One Trading Edge Transform Your Trading with One Powerful Indicator Imagine having a professional trading assistant that monitors multiple timeframes simultaneously, identifies high-probability entries, warns you of potential reversals, and provides clear risk management guidance-all in one clean, intuitive display. That's exactly what the Ichimoku MTF Dashboard delivers.     Why This Isn't Just Another In
MTF Connecting Fractals Multi-Timeframe Market Structure. One Glance. Real Decisions. MTF Connecting Fractals is not just another arrow-printing indicator. It’s a complete multi-timeframe market structure intelligence system designed to answer the most important trading questions in real time - clearly, visually, and without clutter. Built around fractals as objective structure anchors, this tool gives traders a decisive edge by combining price action, structural context, proximity risk, and
Critical Market Session Information with a Single Glance Stop juggling multiple tools and squinting at time zone converters. The SessionInfoDisplay Indicator is your new, indispensable trading co-pilot that puts real-time market intelligence directly on your chart.   What It Does: Your Essential Trading Dashboard   This intelligent indicator provides three critical pieces of information at a glance: 1. Real-Time Session Detection    - Automatically identifies which major financial session is act
FREE
Clr-Dynamic RSI v SMA Indicator : A Comprehensive Analysis of Features and Advantages The Clr-Dynamic RSI v SMA indicator represents a significant evolutionary leap in technical analysis tools, transforming the classic Relative Strength Index (RSI) from a potentially ambiguous oscillator into a sophisticated, multi-dimensional trading system. At its core, this indicator retains the mathematical foundation of the RSI, measuring the speed and change of price movements, but radically enhances its
MTF Candlestick Patterns Detector: Il Tuo Centro di Comando Definitivo per la Price Action Nel frenetico mondo del trading, perdere un singolo pattern di inversione può fare la differenza tra una settimana redditizia e un'opportunità mancata. Il MTF Candlestick Patterns Detector è un indicatore professionale per MQL5 progettato per scansionare, rilevare e aggregare simultaneamente oltre 24 leggendari pattern di candele su tutti i timeframe. Smetti di dare la caccia ai segnali e di tirare a indo
MTF VWAP Indicator - Quick Overview   This indicator shows you where institutional money is flowing across multiple timeframes using Volume Weighted Average Price (VWAP) to identify high-probability trading zones. New version has VWAP bands plotting capability if user enabled and display panel (whose background changes colour on confluence) can be toggled on/off.      What It Actually Does:     1. Tracks Smart Money Levels: - Shows Daily, Weekly, and Monthly VWAP lines where big players (banks,
Indicator Overview This is a sophisticated Multi-Timeframe (MTF) indicator that not only applies the classic Fisher Transform formula but integrates it into a comprehensive trading system featuring a real-time dashboard. The indicator excels at pinpointing reversals through advanced divergence detection and providing a clear, multi-timeframe view of market structure.     How It Works: Core Fisher Logic   1.   Normalization and Signal Generation         The indicator transforms price (using med
MTF WAD Simplified Indicator - Professional Trading Solution     Overview The MTF WAD Simplified is a sophisticated multi-timeframe volume-based indicator designed to track smart money flow across financial markets. By monitoring the Williams Accumulation/Distribution (WAD) across 8 different timeframes, this tool provides traders with unprecedented insight into institutional accumulation and distribution patterns.     Core Benefits for Traders     1. Smart Money Tracking - Detect Institutional
RSI v SMA MTF Indicator : Professional Trading Edge in One Tool   Summary The RSI v SMA MTF Indicator is a sophisticated, multi-timeframe momentum analysis tool that transforms the traditional RSI into a powerful, actionable trading system. By combining RSI slope analysis with SMA crossover signals, divergence detection, and real-time multi-timeframe confluence, this indicator provides traders with a more comprehensive view of market momentum across all relevant timeframes.     Core Utility an
Cumulative Volume Delta MA-X MTF (con Gradient Momentum) Questo indicatore esegue un'analisi multi-timeframe del Delta del Volume Cumulativo (CVD) per MetaTrader 5. Calcola la differenza netta tra la pressione di acquisto e di vendita analizzando i dati del volume reale o dei tick, fornendo una rappresentazione visiva del sentiment del flusso degli ordini. Logica e Caratteristiche dell'Indicatore L'indicatore utilizza un approccio matematico per l'analisi del volume: Origine dei Dati: Supporta
Cumulative Volume Delta (CVD) MA-X: Strumento Intelligente di Sentiment per l'Order Flow Sblocca i meccanismi nascosti del mercato con il Cumulative Volume Delta (CVD) MA-X . Mentre gli indicatori di volume standard ti dicono solo quanto è stato scambiato, il CVD MA-X ti dice CHI sta vincendo la battaglia tra compratori e venditori e QUANDO . Aggregando l'azione del prezzo a livello di tick e la distribuzione del volume, questo indicatore fornisce una mappa cristallina della convinzione e dell'
Multi-Timeframe Money Flow Index (MTF MFI) with Smart Divergence and Dashboard Unlock the flow of institutional money across every timeframe. Are you tired of guessing the trend only to be trapped by a sudden reversal? The Multi-Timeframe Money Flow Index (MTF MFI) is a professional-grade trading tool designed to provide a bird's-eye view of market liquidity and momentum. By aggregating volume-weighted data from W1 down to M1, this indicator eliminates noise and highlights high-probability tra
MTF Parabolic SAR Maximize your trading efficiency with the Multi-Timeframe Parabolic SAR Trend and Momentum Dashboard. Designed for serious traders who value clarity over clutter, this tool aggregates price action across six timeframes into a single, sleek visual interface.  By combining that reliable classic Parabolic SAR logic with advanced momentum scoring and risk assessment, this indicator transforms raw data into actionable trade signals.  The Strategic Edge: Why This Indicator? Most tra
Multi-Timeframe Heiken Ashi (Smoothed with Dashboard) Professional Market Structure Visualization with Weighted Confluence Scoring Transform your trading with crystal-clear multi-timeframe analysis. This indicator combines smoothed Heiken Ashi candles with an intelligent weighted scoring system to give you unprecedented clarity in any market condition. YOUR TRADING QUESTIONS – ANSWERED INSTANTLY: 1. What's the REAL trend direction? Dashboard Reveals:   Higher timeframe (MN1, W1, D1, H4) trend a
Hybrid BB-LRMA [Trend and Volatility Engine]   Master the markets with the Hybrid BB-LRMA, a professional-grade technical analysis tool that fuses the volatility-tracking power of Bollinger Bands (BB) with the hyper-responsive Linear Regression Moving Average (LRMA) to eliminate lag and pinpoint high-probability entries with arrow Signals   Why Hybrid BB-LRMA? Most moving averages are too slow, and Bollinger Bands alone can be noisy. The Hybrid BB-LRMA solves this by using a gradient-based LRMA
Hybrid FATL Fractal: Professional Digital-Signal Logic   Simplify the Complexity of Market Structure.   Unlock the power of digital signal processing combined with price action geometry. The Hybrid FATL Fractal is a professional-grade technical analysis tool designed to eliminate market noise and pinpoint high-probability institutional turning points. By merging the Fast Adaptive Trend Line (FATL) algorithm with Dynamic Fractal Breakout logic, this indicator provides a dual-layered filter that a
VOLUME PROFILE SAF-XII Analisi Market Profile Professionale per MT5 (L'indicatore ideale per i trader che utilizzano strategie Grid) COS'È IL VOLUME PROFILE? Il Volume Profile è uno strumento istituzionale professionale che visualizza l'attività di trading a specifici livelli di prezzo, a differenza dei tradizionali indicatori di volume che mostrano il volume nel tempo. Rivela DOVE sono avvenuti gli scambi all'interno della finestra temporale scelta, aiutando a identificare: VALUE AREAS (VAH/VA
Fisher Transform MTF Pro v4.03 Professional Multi-Timeframe Trading Decision System Fisher Transform MTF Pro turns complex multi-timeframe data into clear, actionable trade decisions in seconds. It answers instantly:  What’s the trend?  Where’s the entry?  How strong is the setup?  What are the risks?  Should I buy, sell, or wait?  The Edge   Zero-Line Filter (Trend Protection) Prevents counter-trend trades by default:  No buys above zero  No sells below zero This forces alignment with th
Turtles Professional v2.0 The Legendary Turtle Strategy, Reimagined for the Modern Trader Turtles Pro transforms the iconic 1980s Turtle Trading System into a high-performance, multi-timeframe decision engine. It eliminates guesswork by providing institutional-grade analysis on trend structure, entry quality, and volatility all on a single chart. The Strategic Edge Turtles Professional uses a Smart Weighted Bias Engine to prioritize higher time frames, ensuring your trades align with the d
Hybrid Hull-LSMA : The Trend Meets Momentum Powerhouse Are you struggling with moving averages that are either too slow to react or too noisy to trust? The Hybrid Hull-LSMA is a solution, engineered to solve the "lag vs. noise" dilemma. By fusing the ultra-smooth Hull Moving Average (HMA) with the predictive Least Squares Moving Average (LSMA), this indicator delivers a high-definition view of market structure and entry timing. Why the Hybrid Hull-LSMA? Standard indicators follow the market; t
T3 MTF PureMaths: Indicatore Multi-Timeframe Tillson T3 Sistema di Trading di Confluenza Zero-Lag con Dashboard Interattiva Il vantaggio strategico dell'analisi multi-timeframe T3 MTF Pure Maths è una dashboard di trading di livello professionale che aggrega la struttura del mercato su 8 timeframe simultaneamente – dal mensile fino al grafico a 5 minuti – offrendo approfondimenti operativi istantanei senza dover cambiare grafico o eseguire calcoli mentali. Sviluppato con un' ottimizzazione mate
Divergent Fisher Transform MT5  Precision Momentum. Intelligent Filtering. EA-Ready Automation. The Divergent Fisher Transform for MT5 is a professional-grade momentum trading indicator designed to help traders answer the most important question in the market: “What should I do right now?” It transforms raw price into high-probability, structured trading decisions using a powerful combination of:  Fisher Transform momentum modeling  Zero-line structural filtering  Multi-level overbought/o
Divergent Stochastic Filter II Catch Reversals Early, Filter Noise, Trade with Confidence The Edge: Why This Stochastic is Different  Every trader knows the Stochastic oscillator. But knowing when to trust its signals, that's the real challenge. The Divergent Stochastic Filter II transforms this classic indicator into a precision reversal detection system by adding critical elements: divergence intelligence, signal filtering and exhaustion detection.  While standard Stochastic oscillators fire s
X-Hybrid Modular Z – Execution Intelligence Platform Trasforma qualsiasi indicatore in un sistema di trading completamente automatizzato X-Hybrid Modular Z è un motore di esecuzione modulare che converte qualsiasi indicatore personalizzato ben progettato in un sistema di trading automatico completo. Progettato per i trader che esigono un'esecuzione di livello professionale e un controllo rigoroso del rischio, colma il divario tra la generazione del segnale e la gestione del trade a livello isti
Hybrid FATL-LRMA : Digital Precision Meets Statistical Certainty The Ultimate Trend-Momentum Convergence System with clear action protocols. Why Hybrid FATL-LRMA? The Edge some Traders Miss Are you tired of lagging indicators that signal entries after the move has already happened? Frustrated by noisy oscillators that keep you in chop while trends pass you by? The Hybrid FATL-LRMA is a dual-engine trading system that bridges the gap between high-frequency digital signal processing and stat
ADX ClrDynamic Slope-Aware, Low-Lag Trend & Momentum Engine Tired of lagging indicators that signal a trend only after the move is over? Traditional ADX calculations are often too slow for modern market volatility. ADX ClrDynamic bridges this gap by combining customizable low-lag smoothing algorithms (EMA, SMA, Wilder, or Hull Acceleration) with slope-aware momentum logic, giving you a lean, high-precision decision engine for timing trend entries and exits. Key Trading Questions Answered What is
ADX ClrDynamicPro Plus III Multi-Timeframe Trend, Momentum & Divergence Command Center Tired of lagging indicators that signal a trend only after the move is over? ADX ClrDynamicPro Plus III is a complete decision engine for trend, momentum, and reversal traders. By combining customizable smoothing algorithms (EMA, SMA, Wilder, or optional Hull Acceleration) with multi-timeframe (HTF) confirmation, institutional divergence detection, and an embedded subwindow dashboard, this tool delivers clear,
SERA - Sigma-Enhanced Regression Analysis – The Non-Repaint, Early-Entry MTF Trading System The Problem with Most Regression Tools (And How We Solved It) Traditional regression indicators lie to you. They repaint, they lag, and distort actionable data. Their flaws cost you in false back-tests, late entries/exits and therefore missed profits. Avoid catching a falling knife or chasing a train with SERA, she eliminates ALL three problems. One-Click Trading Style Selection – Choose Conservative, R
La logica delle Bande Tricolore Ottimizzate dà priorità alla visibilità della price action mantenendo al contempo il rilevamento dello Squeeze (compressione). 1. Cambio di Filosofia: Fai Trading a Modo Tuo L'impostazione SignalMode ti consente di scegliere come l'indicatore interpreta i tocchi delle bande. Pensalo come alla tua personalità di trading: Quando il prezzo tocca la... Modalità BREAKOUT (Trend Trader) Modalità BOUNCE (Cacciatore di Reversion) Modalità AUTO (Versatile) Banda Superiore
Filtro:
Nessuna recensione
Rispondi alla recensione
