Market State Intelligence OBV Contour
- エキスパート
- バージョン: 4.4
- アクティベーション: 5

MSI-OBV Contour
What It Is
MSI-OBV Contour is an Expert Advisor that reads the On-Balance Volume (OBV) flow of the market across three higher timeframes plus the chart timeframe, applies envelope bands to that flow, and only enters when the path of least resistance is clear. It is designed for the trader who wants to make fewer, better decisions rather than chase every candle.
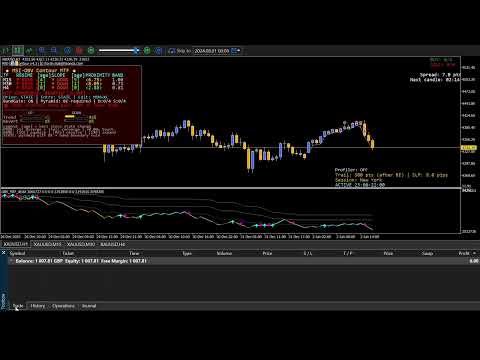
It ships as a single file. The OBV engine is embedded inside the EA as a compiled resource so you don't need to install, maintain, or configure a separate indicator. Attach the EA, and the analysis engine comes with it. The indicator is also auto-attached to a subwindow on first run for visual reference.
There is no daily tuning, no manual tracking of divergence patterns, no afternoon spent watching for the regime to flip. The EA watches, aggregates, decides, and executes.
The Edge (What you see that others may not)
Most OBV tools show you a squiggly line. MSI-OBV Contour asks three questions about it:
1. Where is the OBV relative to its own midpoint? :This is the regime: bullish, bearish, or neutral. Not a subjective read. A number, compared against a threshold.
2. Which direction is the OBV moving? :This is the slope, expressed through gradient-aware colour coding of the OBV line itself. Four colours, each carrying a distinct meaning (you can change these via inputs):
-
Aqua : accelerating bullish (up and getting stronger)
-
Steel blue : decelerating bullish (up but losing momentum)
-
Gold/gray : flat, no clear direction (this is the mid-point line)
-
Saddle brown : decelerating bearish (down but losing momentum)
-
Orange : accelerating bearish (down and getting stronger)
The transition between colours is a signal in itself. When the line flips from steel blue to aqua, momentum is strengthening. When it flips from orange to saddle brown, the down move is losing conviction. You see this at a glance, without checking any number.
3. How far has it stretched from its midpoint, in volatility units? : This is proximity. It tells you where the OBV currently sits within its range: near the midpoint (small values ;a move that has just started, or a consolidating market), in the healthy middle band (moderate values ; a developed trend with room left to run), or stretched toward the extreme (large values ; an extended move, or a strong trend holding at the range edge).
Proximity is a distance metric, not a freshness metric. Freshness is a separate column: age, shown in brackets next to the regime and slope values ( ▲ BULL [14] means the bullish regime has held for 14 bars). Age tells you how long. Proximity tells you how far. Together they distinguish a fresh move that has barely begun from a fresh move that has already travelled far.
Then the EA does something most indicators don't: it wraps the OBV in envelope bands scaled to the OBV's own rolling range. Not a fixed percentage, not a standard deviation guess ; the bands adapt to the instrument's behaviour. When the market is quiet, the bands narrow. When it's moving, they widen. The band boundary becomes a natural decision line that self-calibrates.
A note on the bands. The OBV can stay near the outer band for extended periods during strong trends. This is normal, a strong trend pushes the OBV to the range edge and holds it there. The band gate is therefore permissive by default design, and can be fully disabled by the trader who wants to trade strong trends to their extremes. When enabled, it acts as a discipline for stacking additional positions, not as a signal to exit existing ones.
The Decision Hierarchy (How Signals Combine)
Every entry the EA takes is scored against a hierarchy of confluences. The more confluences that agree, the stronger the signal. In order of importance:
Tier 1 — Structural Alignment (highest weight)
-
HTF (higher timeframe) consensus is bullish (for BUY) or bearish (for SELL)
-
Chart-TF regime agrees with HTF
-
The OBV is inside its bands, not at the outer edge (if band gate enabled)
If any of these fail, the trade is rejected. These are the non-negotiables. They answer: "Is the market structurally in my favour?"
Tier 2 — Momentum Confirmation
-
Chart-TF slope agrees with the entry direction
-
The regime is fresh (few bars since the last flip) rather than stale
-
Proximity is in the healthy range (not touching the midpoint, not stretched to exhaustion)
These weight the confidence. They answer: "Is the momentum real, or is this a false start?"
Tier 3 — Timing Refinement
-
Signal freshness: momentum or X-cross arrow appeared on this bar, not five bars ago
-
Divergence confirmation (when enabled)
-
Confidence matrix score above the user's threshold
These gate the final entry. They answer: "Is now the right moment, or should I wait?"
What this means in practice: The EA never enters on a single signal. It enters when a stack of independent reads agree. When they don't, you get a reason in the panel such as; "HTF SLOPE mismatch", "Band gate — OBV at upper band", "Pyramid blocked — earlier position not at BE" , so you always know why a trade did or didn't fire.
The Drive Modes (Choosing Your Trading Personality)
EVENT mode is for the trader who wants clean, bounded entries. One signal, one trade. The EA waits for a momentum flip or an X-cross, enters, and then stays out until the next signal. Disciplined, selective, does not chase. If you want a "one signal, one decision" style, this is your mode.
STATE mode is for the trader who wants to build position(s) while a trend holds. Once the regime and slope agree, the EA attempts a new entry on every bar, up to your positions cap. It is passive on the way in and lets the market decide how much size the trend deserves.
STATE mode is pyramiding, there is no "pyramiding off" variant. If you don't want to pyramid, use EVENT. Two clean semantics, no ambiguity.
Self-Scaling Pyramiding (How It Protects You)
When STATE mode adds to a position, two gates must both pass:
The BE gate. All existing same-direction positions must already be at breakeven or better. In plain terms: the EA only stacks on winners that have already paid for their risk. The first position must have earned its escape hatch (SL at entry or better) before the EA is allowed to double down. You are never adding size onto a losing trade.
The band gate (if enabled). The OBV must be inside its envelope bands. If the OBV has reached the outer band, the pyramid gate closes by design (the EA will not add a new position at the range extreme). This does not affect existing positions; only new pyramids are blocked.
The combined effect is self-scaling pyramiding: on a strong trend, entries accumulate. On a stalling trend, they don't. The EA adds position when the market continues to pay for it, and stops adding when the OBV reaches its range extreme.
A note on "size". If you are running fixed lots, the EA adds positions of the same size (the total exposure grows by one lot per pyramid). If you are running risk-percent or equity-percent sizing, the EA adds size, because the position itself is larger as equity grows. The distinction matters: fixed lots pyramid quantity, percent-based sizing pyramids both quantity and aggregate exposure.
The Confidence Matrix (Reading the Odds at a Glance)
The panel shows a 2×2 confidence matrix:
| UP | DOWN | |
|---|---|---|
| TREND | TrendConfUp | TrendConfDn |
| REVERT | RevertConfUp | RevertConfDn |
Each cell is scored 0–100. TREND reflects how strongly the market agrees with continuation. REVERT reflects how strongly it agrees with reversal. The two are independent ; both can be high during a transition, both can be low during consolidation.
You can glance at this and know whether the environment favours trend-following or reversal-hunting. The EA can gate entries on this matrix if you choose, or ignore it and rely on the structural filters.
For traders who want more discipline, the gate modes offer three ways to filter:
-
ABSOLUTE : require a minimum confidence in the entry direction
-
NET : require the confidence in your direction to exceed the opposite side by a margin
-
BOTH : require both conditions
The default is off. Enable it when you want fewer, higher-quality entries.
Risk Management (Full Trade Lifecycle)
The EA manages every trade from entry to exit.
On entry:
-
Fixed lots, risk-percent sizing, or equity-percent sizing
-
(Risk-percent sizing requires a non-zero StopLossPoints ; the EA needs a stop distance to calculate lot size from your risk budget.)
-
Automatic lot cap by balance, instrument multiplier, and margin safety
-
Position caps per direction
-
Optional spacing between same-direction entries (avoids stacking multiple trades around the same price)
-
Spread gate and session filter (set what spread and times you don't want to trade beyond)
In the trade:
-
Take profit and stop loss set at entry, with broker minimum-distance enforcement
-
Breakeven moves the SL to entry ± buffer once the position reaches a profit threshold
-
Trailing stop steps the SL forward as profit grows, never worse than entry, never inside the broker's freeze band
-
Partial close can take a portion of the position off at a profit target while leaving the runner
-
Five trail stages are tracked and shown visually: grey (initial), dodger blue (breakeven), yellow (stage 1), orange (stage 2), lime (locked). On-chart lines change colour as the position advances through the stages. Optional PnL labels at the right edge of the chart show exactly how much profit is locked at each stage.
On exit:
-
Signal reversal (momentum or X-cross, or either)
-
HTF flip
-
TP or SL reached
-
Every close is logged with a reason such as; "exit signal", "HTF flip", "reversal" , so you can review your trade history and see what triggered each close.
Advanced safety:
-
No-money cooldown : the EA pauses for 10 seconds after a broker "insufficient funds" error
-
Retry logic on trades with proper freeze-level handling : no phantom positions from rejected orders
-
Margin safety at every step : the EA never opens a position it can't afford
Managing manual trades. Set MagicNumber = 0 and the EA will manage any position on the symbol, including trades you opened by hand. This includes trailing stops, breakeven, partial closes ( everything the EA does for its own positions). Useful when you want to open a trade manually but have the EA manage the exit.
Trend-Friendly Settings (How to Configure for One Direction)
If your market view is long-only, or you're in a bull regime and don't want the EA to fight it:
-
Set MaxSellPositions = 0 (the EA will not open a single short/sell trade)
-
Set MaxBuyPositions = 2 (or more) ;allows pyramiding on the long/buy side only
The same in reverse for short-only setups. The EA respects the caps absolutely. All signals in the suppressed direction are dropped silently; only the allowed direction can fire.
Combine this with the HTF filter set to SLOPE and you have a directional bias that the EA will not fight. If the HTF says bearish and you've disabled shorts, the EA simply waits, it doesn't take a counter-trend long. It sits out until the HTF agrees.
Ease of Use (What You Actually Have to Do)
-
Install : drop the single .ex5 file into your MQL5\Experts\ folder. That's it. The indicator engine is embedded.
-
Attach : drag the EA onto a chart. The OBV indicator attaches automatically to a subwindow.
-
Choose your drive mode : EVENT for one entry per signal, STATE for pyramiding.
-
Set your risk : fixed lots, or risk percent, or equity percent. Set your TP and SL.
-
Watch : the panel tells you what the EA is doing, what it's blocked on, and why.
Everything else has sensible defaults. You can run the EA with the default configuration out of the box and get a working, disciplined trading system. Every parameter is there if you want to tune it, but none of them are required to get started.
The embedded indicator alone, an MTF OBV engine with bands, proximity, divergence detection, and gradient colour coding, is worth more than $100 as a standalone tool (indicator's multi timeframe panel turned off by default, setting Enable MTF Panel= true turns it on via its properties if desired: see image 5 in snapshots). It ships at no extra cost inside the EA.
The Questions It Answers for You
"Is the market in a trend right now?"
→ Read the HTF CONSENSUS line. If it says BULLISH or BEARISH, yes. If NEUTRAL, no.
"Which direction should I be biased?"
→ Read the panel's regime and slope columns for each timeframe. The consensus reflects the majority view.
"Is this move real or just noise?"
→ Check the confidence matrix. High TREND confidence with low REVERT means the market agrees with continuation. High REVERT with falling TREND means the move is losing steam.
"Is momentum accelerating or fading?"
→ Read the OBV line colour. Aqua = accelerating bullish. Orange = accelerating bearish. Steel blue and saddle brown are the "losing steam" stages (often the earliest warning that a trend is about to pause).
"Should I add to my position?"
→ If you're in STATE mode and the panel shows the pyramid counter increasing, the EA thinks so. If it shows the pyramid counter flat while positions exist, the pyramid gate is blocking (usually because the earlier entries aren't yet at breakeven).
"Is my trade at risk?"
→ The trail line on the chart tells you the current SL. Its colour tells you the stage. If it's yellow, you're locking in small profit. If it's lime, you've locked in meaningful profit. The BE horizon line (if enabled) shows the floor the trail will never cross.
"Why isn't the EA taking this trade?"
→ Read the trade status line at the bottom of the panel. It names the gate that blocked. "HTF SLOPE mismatch" means the higher timeframe disagrees. "Band gate — OBV at upper band" means the OBV is at the range edge. "Pyramid blocked — 1 BUY not at BE" means the earlier position hasn't paid for its risk yet.
"What's the current spread, session, and time to next candle?"
→ Top-right and bottom-right of the panel. Spread is colour-coded red when it exceeds your maximum.
"I opened a trade manually, will the EA manage it?"
→ Set MagicNumber = 0 . The EA will trail, breakeven, partial-close, and exit any position on the symbol.
The Bottom Line
MSI-OBV Contour is not a black box. Every decision the EA makes is visible, reasoned, and logged. It aggregates multiple independent reads of the market (including regime, slope, proximity, band phase, HTF consensus, signal freshness, confidence) and only acts when enough of them agree.
It trades when the market says to trade. It pyramids when the market pays for it. It stops when the market says to stop. And it tells you why, every time, in plain language on the panel.
Single file deployment. Embedded engine. Minimal configuration. Full trade lifecycle management.
For the trader who wants a disciplined, self-contained system that runs on the OBV edge without requiring constant attention, MSI-OBV Contour delivers.