Vertex Pulse MT4

### Vertex Pulse MT4: Precision HYBRID Indicator

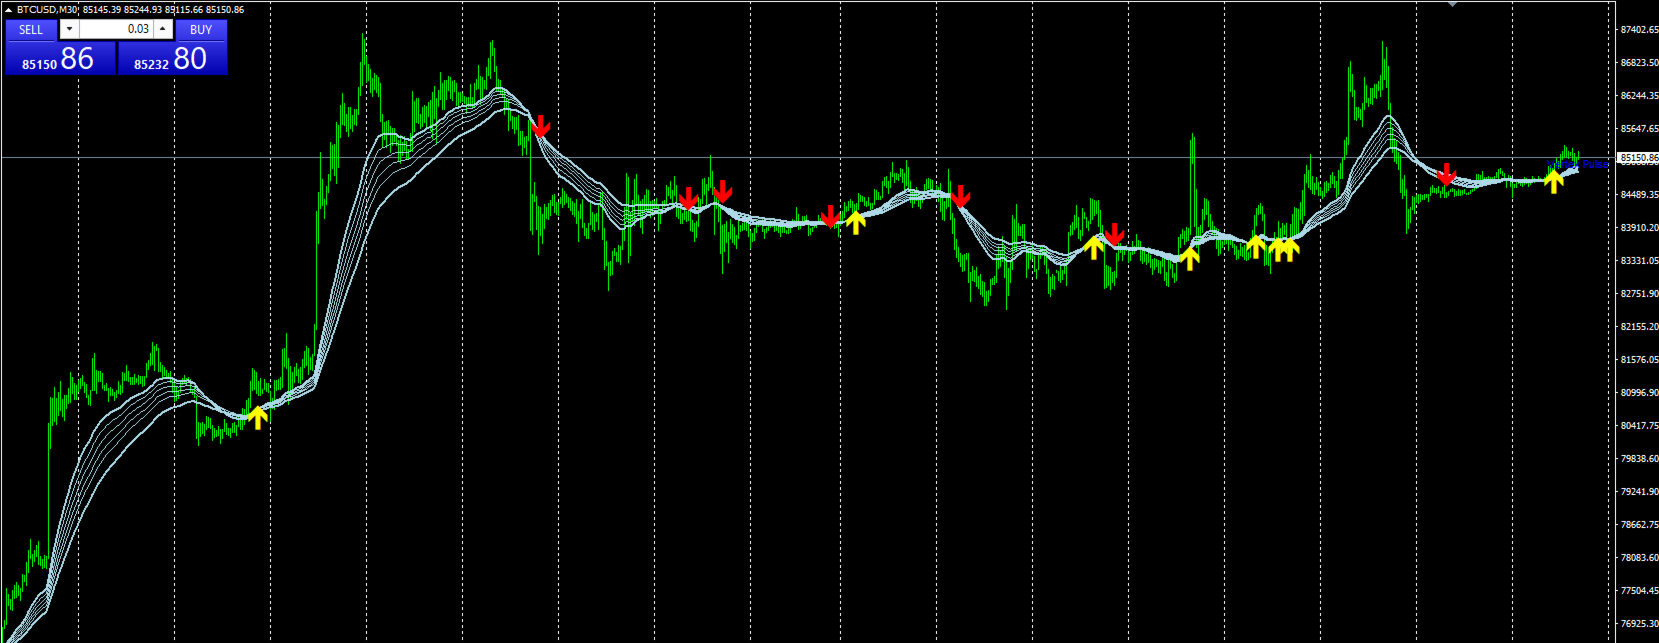
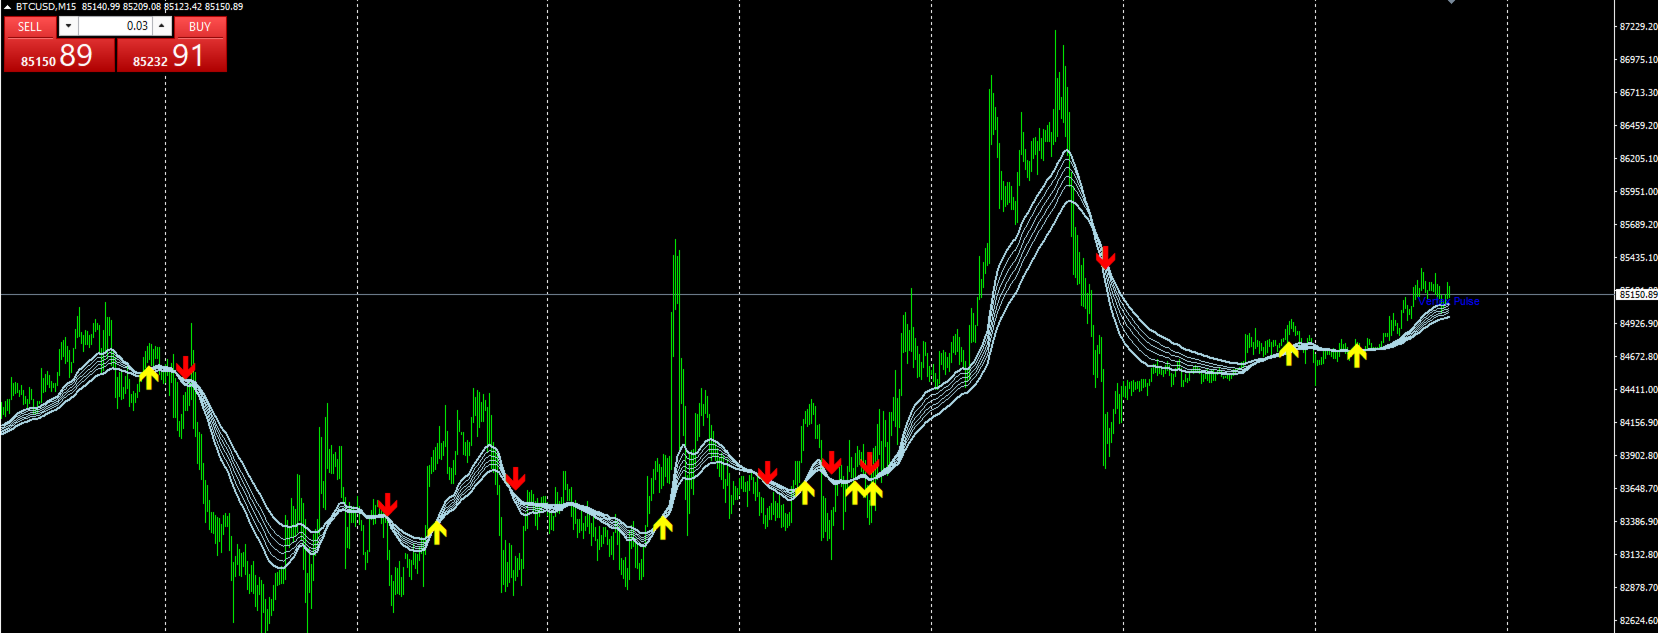
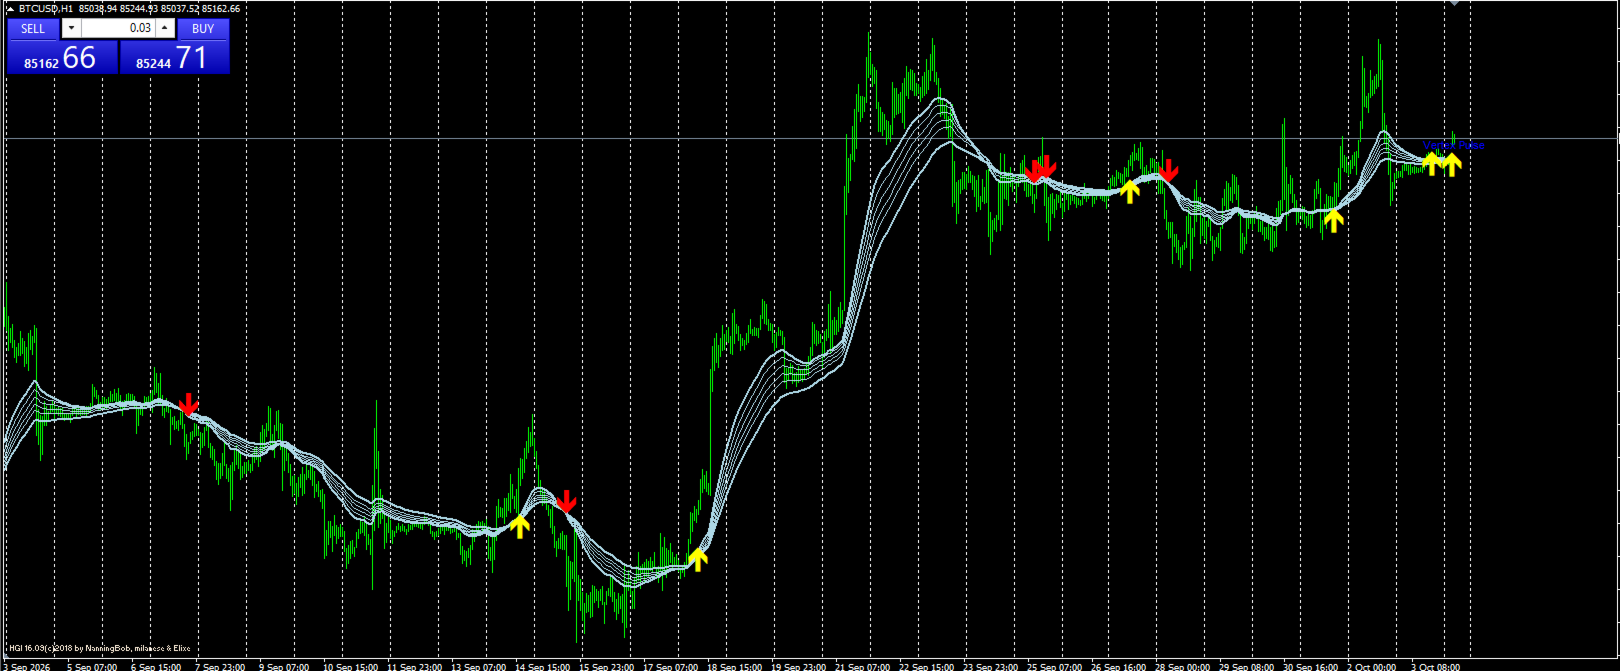
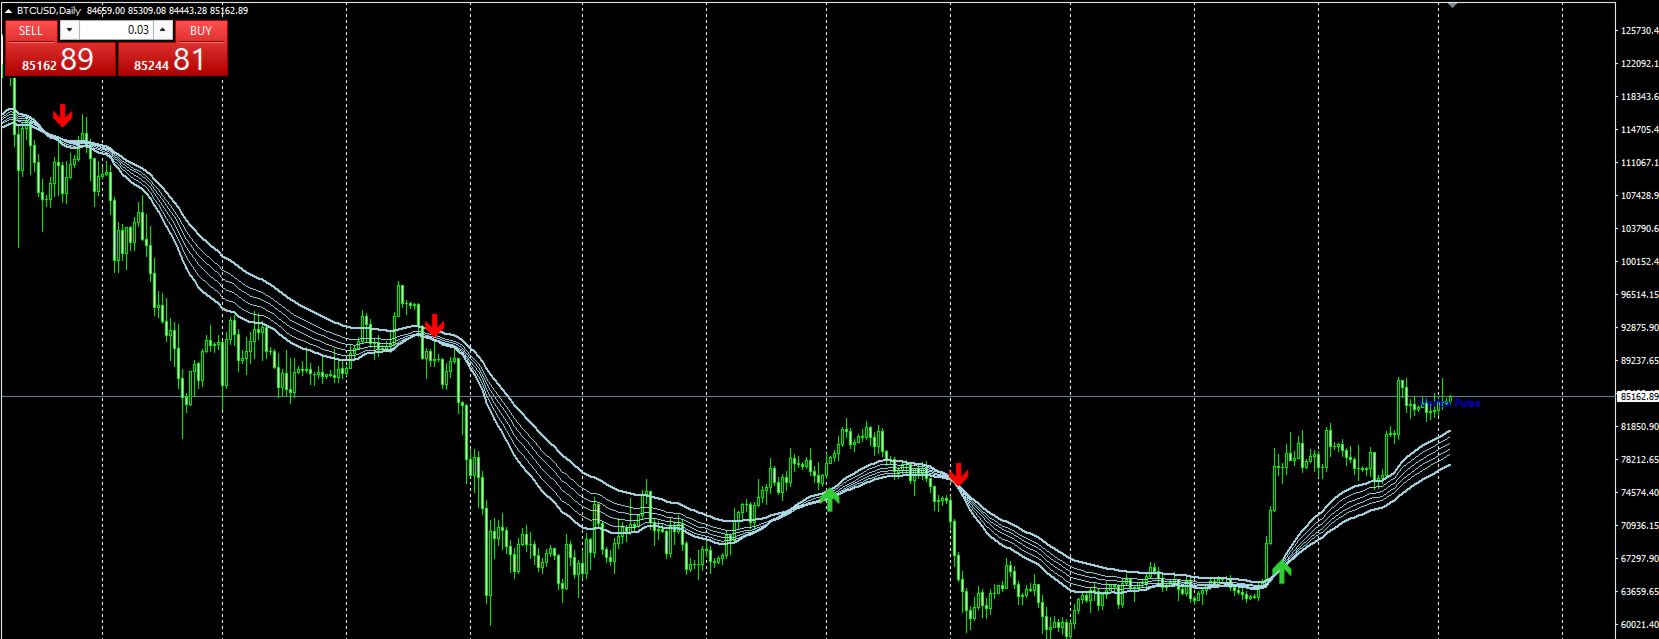
**Vertex Pulse** is an institutional-grade hybrid indicator engineered specifically for MetaTrader MT4. A volatility-adapted hybrid indicator for MetaTrader MT4 (Vertex Pulse) that pairs Average True Range (ATR) volatility expansion bands paired with tick volume surge filters to signal high-probability swing and momentum entries with real-time multi-bar execution signals and on-chart signal markers and terminal alerts.

---

### Key Capabilities
- **Non-Repainting Execution:** Signals are calculated and printed strictly upon candle close (bar index 1). Once confirmed, arrows and levels never shift or disappear.
- **Dynamic Volatility & Algorithmic Filtering:** Engineered with adaptive threshold mechanics to isolate high-conviction momentum while systematically filtering out choppy consolidation noise.
- **Dynamic Spread Safeguard:** Automatically suppresses breakout alerts during spread widening, protecting traders against slippage during high-impact news or roll-over hours.
- **Comprehensive Notification Suite:** Native chart popups, sound triggers, email dispatches, and push alerts to MetaTrader MT4 mobile terminals.
- **Multi-Asset Compatibility:** Optimized for Forex majors, Indices (US30, NAS100, DAX40), Gold (XAUUSD), and high-liquidity crypto pairs.

---

### How to Trade with Vertex Pulse
1. **Trend Identification:** Observe the indicator's directional bias and momentum orientation on your chosen chart.
2. **Signal Confirmation:** A confirmed hybrid entry signal confirms that both the algorithmic multiplier and volume threshold conditions have been met on candle close.
3. **Execution & Risk Management:**
   - **Entry:** Open position on the open of the bar immediately following the confirmed signal.
   - **Stop Loss:** Place behind dynamic structural swing levels or ATR boundaries.
   - **Take Profit:** Recommended risk-to-reward ratio of 1:1.5 to 1:2.5, or trail until an opposite signal confirms.

---

### Input Parameters Guide
| Parameter | Default | Description |
| :--- | :--- | :--- |
| **len7** | 30 | Slow EMA 7 |
| **len8** | 35 | Slow EMA 8 |
| **len9** | 40 | Slow EMA 9 |
| **len10** | 45 | Slow EMA 10 |
| **len11** | 50 | Slow EMA 11 |
| **len12** | 60 | Slow EMA 12 |
| **MaxHistoryBars** | 2000 | Max bars to process |
| **UseAlerts** | true | Enable Pop-up Alerts |
| **ArrowSize** | 3 | size of the Buy/Sell arrows |

---

### Expert Advisor (EA) Integration
Automated developers can access signals easily via `iCustom()`:
- **Buffer 0:** Bullish Arrow price value (0.0 if no signal)
- **Buffer 1:** Bearish Arrow price value (0.0 if no signal)
- **Buffer 2:** Dynamic Trailing Band price level

---

### Recommendations
- **Recommended Timeframes:** M15, M30, H1, H4.
- **Best Assets:** EURUSD, GBPUSD, XAUUSD, US30, BTCUSD.
- **Account Type:** Raw Spread or ECN account recommended for lowest execution friction.

*Built with mathematical verification by Dough Algo Labs. Past statistical performance does not guarantee future market outcomes. Always test thoroughly in demo environments before committing live capital.*
Prodotti consigliati
VWAP Level
Francesco Lenza
4.75 (8)
L’indicatore VWAP Level è uno strumento di analisi tecnica che calcola il prezzo medio ponderato per i volumi scambiati di un asset specifico. Il VWAP fornisce ai trader e agli investitori il prezzo medio di un asset in un arco temporale specifico. È comunemente utilizzato dagli investitori per confrontare i dati sulle operazioni di trading “passive”, come i fondi pensionistici e i fondi comuni d’investimento, ma anche dai trader che vogliono verificare se un asset è stato comprato o venduto a u
FREE
VWAP Band Fills with Anchored VWAP MT4 porta il VWAP di TradingView su MetaTrader 4. Se usate il "VWAP" integrato di TradingView, qui troverete gli stessi parametri (Anchor Period, Source, Offset, Bands Calculation Mode, Bands Multiplier #1 to #3, Hide VWAP on 1D or Above), la stessa formula (Pine ta.vwap) e gli stessi colori - più un VWAP ancorato (Anchored VWAP) che parte dal punto in cui trascinate una linea verticale. LA FORMULA All'interno di ogni periodo di ancoraggio, barra per barra: V
FREE
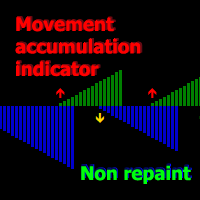
Un indicatore tecnico che calcola le sue letture sui volumi di scambio. Sotto forma di istogramma, mostra l'accumulo della forza del movimento dello strumento di trading. Dispone di sistemi di calcolo indipendenti per le direzioni rialziste e ribassiste. Funziona su qualsiasi strumento di trading e intervallo di tempo. Può integrare qualsiasi sistema di trading. L'indicatore non ridisegna i suoi valori, i segnali appaiono sulla candela corrente. È facile da usare e non carica il grafico, non ric
When the Accumulation/Distribution indicator grows, it means accumulation (buying) of a particular security, as the overwhelming share of the sales volume is related to an upward trend of prices. When the indicator drops, it means distribution (selling) of the security, as most of sales take place during the downward price movement. Divergences between the Accumulation/Distribution indicator and the price of the security indicate the upcoming change of prices. As a rule, in case of such divergen
L'indicatore costruisce le quotazioni attuali, che possono essere confrontate con quelle storiche e su questa base fanno una previsione del movimento dei prezzi. L'indicatore ha un campo di testo per una rapida navigazione fino alla data desiderata. Opzioni: Simbolo - selezione del simbolo che visualizzerà l'indicatore; SymbolPeriod - selezione del periodo da cui l'indicatore prenderà i dati; IndicatorColor - colore dell'indicatore; HorisontalShift - spostamento delle virgolette disegnate d
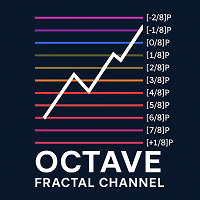
Octave Fractal Channel — Dynamic Gann-Based Support/Resistance Levels with Auto-Scaling. This indicator plots a dynamic channel based on the fractal structure of price movement. Channel levels adapt to the current symbol and timeframe, making it suitable for use across various financial instruments — from currency pairs to cryptocurrencies and indices. The indicator can be used in combination with other technical tools, such as the RSI oscillator, to provide additional signal filtering. How to
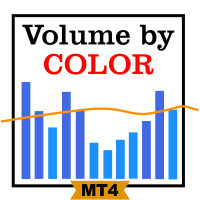
Volume By Color RSJ colora la barra del volume con una tonalità più scura quando il volume scambiato è superiore alla propria media mobile, così le candele con un'attività insolita risaltano. Una modalità opzionale a quattro colori mostra per livelli la forza del volume di ogni candela. Per impostazione predefinita, l'indicatore confronta ogni barra con la media semplice a 20 periodi del volume. Il tipo e il periodo della media possono essere modificati nei parametri di input. Come usarlo Le bar
FREE
Donchian channels are a tool in technical analysis used to determine the relative volatility of a market and the potential for price breakouts. Can help identify potential breakouts and reversals in price, which are the moments when traders are called on to make strategic decisions. These strategies can help you capitalize on price trends while having pre-defined entry and exit points to secure gains or limit losses. Using the Donchian channel can thus be part of a disciplined approach to managi
FREE
Volume Profile Sniper v11. 1 è uno strumento completo per l'analisi di mercato Un approccio professionale al trading Volume Profile Sniper v11.1 integra più di 15 filtri chiave in un unico indicatore, fornendo segnali chiari basati su una valutazione completa della situazione del mercato. Caratteristiche principali Analisi dello squilibrio di volume-l'algoritmo calcola la percentuale di acquirenti e venditori in ciascuna candela, segnalando la predominanza di una delle parti (soglia configurab
MR Volume Profile 4
Sergey Khramchenkov
The "MR Volume Profile 4" indicator is a charting tool that displays trading volume at different price levels rather than time intervals. A key concept in volume profile is the point of control (POC)—the price level with the highest volume traded during the session or time range. While tools like VWAP or OBV provide volume trends, the "MR Volume Profile 4" indicator offers granular detail about where the most market activity occurs at specific price levels. This makes it a more precise tool for
Adaptive Volume Profile disegna il Volume Profile delle ultime barre direttamente sul grafico: il Point of Control (POC), la Value Area (VAH / VAL), i nodi ad alto volume (HVN), i nodi a basso volume (LVN) e un istogramma del volume opzionale. La dimensione delle righe di prezzo si adatta alla volatilità corrente (ATR), così il profilo resta leggibile su qualsiasi simbolo e timeframe. Caratteristiche POC - il livello di prezzo con il maggior volume scambiato nella finestra Value Area (VAH / VAL)
FREE
The   Visual Volatility Clustering   indicator clusters the market based on volatility. The indicator does not redraw and gives accurate data, does not use closing prices. Uses the opening prices or the highs or lows of the previous completed bar. Therefore, all information will be clear and unambiguous. The essence of the indicator is to divide the price market into certain areas according to a similar type of volatility. This can be done in any way. In this example, the indicator is configure
The   Volume Weighted ATR indicator   is a helpful tool for measuring market activity. It is based on the idea of the Volume-Weighted ATR. Combining these two elements helps identify potential turning points or breakout opportunities. The indicator for the classification of the activity of the market uses the moving average and its multiples. Accordingly, where the VWATR bar is located (relative to the moving average), it is labelled as ultra-low, low, average, high, very high or ultra high. Th
FREE
BoxInside MT4
Evgeny Shevtsov
4.83 (6)
This indicator calculates the volume profile and places labels that correspond to the VAH, VAL and POC levels, for each candle individually. Indicator operation features The indicator works on the timeframes from M5 to MN, but it uses the history data of smaller periods: M1 - for periods from M5 to H1, M5 - for the H4 period, M30 - for the D1 period, H4 - for the W1 period, D1 - for the MN period. The color and location of the VAL, VAH and POC labels on the current candle are considered to be c
FREE
BoxChart MT4
Evgeny Shevtsov
4.4 (5)
The market is unfair if only because 10% of participants manage 90% of funds. An ordinary trader has slim changes to stand against these "vultures". This problem can be solved. You just need to be among these 10%, learn to predict their intentions and move with them. Volume is the only preemptive factor that faultlessly works on any timeframe and symbol. First, the volume appears and is accumulated, and only then the price moves. The price moves from one volume to another. Areas of volume accumu
The ProfileVolumesMarket indicator calculates tick volume on each price level in a selected range. Volume is vital when determining strength and therefore significance of price levels. The calculation range is set by a trader by means of moving two vertical lines. Thus the indicator allows to track important levels on different steps of a symbol price formation. A histogram of volume profile can be displayed on the chart (or removed from the chart) if you press "ON" ("OFF") button. When you chan
Zig Zag 123
Stephen Reynolds
Zig Zag 123 tells us when a reversal or continuation is more likely by looking at the shift in supply and demand. When this happens a signature pattern appears known as 123 (also known ABC) will often break out in direction of higher low or lower high. Stop loss and take profit levels have been added. There is a panel that shows the overall performance of your trades for if you was to use these stop loss and take profit levels.  We get alerted if a pattern 123 appears and also if the price re
FREE
Dollar Mint Indicator
David Mwaniki Mbugua
Dollar mint indicator is a special workmanship with years of experience in forex.   Dollar mint ea is a fully non repaint indicator optimised with price action data such that once it gives you a signal t . The indicator   can be used to trade anything on the mt4 with much ease. Benefits ; Fully non repaint Use in any timeframe Use in all the available tradable assets on mt4 Best to use on h4. It generates fully analysed buy and sell signals based on trend and also filters out retracements and
Forex Gump Dot is a ready-made mechanical trading system for the +10 pips strategy. This strategy has been actively discussed and developed on the Internet for several years. The essence of this strategy is to open trade operations during the day and fix the minimum profit on each trade operation. That is, scalp. Our development team decided to adapt the indicators of the Forex Gump family and release a new product that will best match the scalping trading strategy. This product is Forex Gump Do
Buy Sell Visual MTF V2 for MT4
Naththapach Thanakulchayanan
This MT4 indicator, Bull Bear Visual MTF V2, summarize the strength color graphic and percentages of power for both  Bull and Bear in current market emotion stage which will show you in multi timeframes (9) and sum of the total Bull and Bear power strength which is an important information for traders especially you can see all Bull and Bear power in visualized graphic easily, Hope it will be helpful tool for you for making a good decision in trading.
Harmonic Scanner Pro MT4 watches many symbols and timeframes at once for eight harmonic patterns: ABCD, Gartley, Bat, Alternate Bat, Butterfly, Crab, Deep Crab and Cypher. One panel shows where a pattern has just reached its potential reversal zone. It also shows where one is forming close to its zone, and how long ago the last one completed. It uses only confirmed swings and closed bars. A completed pattern in a cell never changes afterwards. MetaTrader 4 edition: the same calculation, panel, o
Here   our MT5 version more valuable tools SMC Trend Trading   ,  Easy SMC Trading  ,  Institutional SMC Architect Volume Analysis Tools  ,  Volume flow Profile  ,  Market volume profile  , FVG with Volume  , Liquidity Heatmap Profile  ,  Volume Spread Analysis 2. Key Features Dynamic Filtering : The core feature. As soon as the current price crosses a historical liquidity level, that level disappears. This reduces chart clutter and prevents you from trading off "dead" support/resistance. Liqui
Here   our more valuable tools SMC Trend Trading   ,  Easy SMC Trading  ,  Institutional SMC Architect Volume Analysis Tools  ,  Volume flow Profile  ,  Market volume profile  , FVG with Volume  , Liquidity Heatmap Profile  ,  Volume Spread Analysis The activity of these professional operators, and more important, their true intentions, are clearly shown on a price chart if the trader knows how to read them .   VSA looks at the interrelationship between three variables on the chart in order
Blahtech Market Profile
Blahtech Limited
4.53 (15)
Was: $249  Now: $99   Market Profile defines a number of day types that can help the trader to determine market behaviour. A key feature is the Value Area, representing the range of price action where 70% of trading took place. Understanding the Value Area can give traders valuable insight into market direction and establish the higher odds trade. It is an excellent addition to any system you may be using. Blahtech Limited presents their Market Profile indicator for the MetaTrader community. Ins
Blahtech Supply Demand
Blahtech Limited
4.58 (36)
Was: $299  Now: $99   Supply Demand uses previous price action to identify potential imbalances between buyers and sellers. The key is to identify the better odds zones, not just the untouched ones. Blahtech Supply Demand indicator delivers functionality previously unavailable on any trading platform. This 4-in-1 indicator not only highlights the higher probability zones using a multi-criteria strength engine, but also combines it with multi-timeframe trend analysis, previously confirmed swings
The   VWAP indicator   is our version of the popular Volume-Weighted Average Price indicator. The VWAP is the ratio between the value traded (price multiplied by the number of volume traded) and the total volume traded over a specific time period. As a result, it measures the average price of the instrument much better than the simple moving average. Although there are many ways to use the VWAP, most investors use it to calculate the daily average.  The indicator works in five modes: Moving  -
Price Magnet — Price Density and Attraction Levels Indicator Price Magnet is a professional analytical tool designed to identify key support and resistance levels based on statistical Price Density. The indicator analyzes a specified historical period and detects price levels where the market spent the most time. These zones act as “magnets,” attracting price action or forming a structural base for potential reversals. Unlike traditional Volume Profile tools, Price Magnet focuses on price-time d
CyberZingFx Volume Plus
Afsal Meerankutty
4.94 (17)
Advanced version of CyberZingFx Volume Indicator, the ultimate MT4 indicator for traders seeking highly accurate buy and sell reversal signals. With an additional strategy and price action dot signals that enhances its effectiveness, this indicator offers a superior trading experience for professionals and beginners alike. The CyberZingFx Volume Plus Advanced version combines the power of volume analysis and historical price data with an additional strategy, resulting in even more precise and re
The indicator analyzes the change in the minimum and maximum prices of the previous bars fixing the entrance of the big players. If the change (delta) increases, a signal is displayed on the graph in the form of an arrow. At the same time, virtual trade on history is carried out. In case of a repeat of the signal, the positions are increased (refilling). Thus the lot of positions can differ. The results of virtual trading in the form of losses / losses, profitability, drawdown and transaction li
Lisek Weis Wave
Darius Hans Lischka
4 (4)
This Weis Wave Volume indicator is a tool to help traders identify the current price trend.  Understanding volume can provide insight into a market's behavior to help you determine its overall health. The most important rule is this: volume precedes price. Typically, before a market price moves, volume comes into play. It has 2 main colors histogram which are green and red. – Green indicates an upward wave. The more the price increases, the bigger the green volume gets. – The red color shows a d
FREE
Gli utenti di questo prodotto hanno anche acquistato
Currency Strength Wizard è un indicatore molto potente che ti fornisce una soluzione all-in-one per un trading di successo. L'indicatore calcola la potenza di questa o quella coppia forex utilizzando i dati di tutte le valute su più intervalli di tempo. Questi dati sono rappresentati in una forma di indice di valuta facile da usare e linee elettriche di valuta che puoi utilizzare per vedere il potere di questa o quella valuta. Tutto ciò di cui hai bisogno è collegare l'indicatore al grafico che
Trend SniperX MT4
Sarvarbek Abduvoxobov
5 (6)
Trend Sniper X è un indicatore di trend-following multi-timeframe per MetaTrader 5 che aiuta i trader a identificare la direzione del trend e i potenziali punti di inversione con chiarezza e precisione. Per MT5: https://www.mql5.com/en/market/product/181101 Informazioni sul prezzo: Il prezzo attuale è promozionale ed è soggetto a modifiche con il rilascio dei prossimi aggiornamenti e nuove funzionalità. Canale Code2Profit Domina il mercato con l'analisi multi-timeframe! Come massimizzare il tuo
M1 Sniper
Oleg Rodin
4.97 (30)
M1 SNIPER è un sistema di indicatori di trading facile da usare. Si tratta di un indicatore a freccia progettato per l'intervallo temporale M1. L'indicatore può essere utilizzato come sistema autonomo per lo scalping sull'intervallo temporale M1 e come parte del tuo sistema di trading esistente. Sebbene questo sistema di trading sia stato progettato specificamente per il trading sull'intervallo temporale M1, può comunque essere utilizzato anche con altri intervalli temporali. Inizialmente ho pro
SIO Oscillator: oscillatore auto-ottimizzante dello squilibrio di semivarianza Acquista l’indicatore e ricevi GRATIS l’Expert Advisor (EA) basato su di esso. La maggior parte degli oscillatori tratta ogni movimento di prezzo allo stesso modo. SIO separa la pressione rialzista da quella ribassista e misura lo squilibrio tra le due, mostrando quale parte controlla davvero il mercato: compratori o venditori. Quando lo squilibrio raggiunge un estremo, SIO genera un segnale chiaro con livelli di ingr
Gann Made Easy
Oleg Rodin
4.84 (174)
Gann Made Easy è un sistema di trading Forex professionale e facile da usare che si basa sui migliori principi del trading utilizzando la teoria di mr. WD Gann. L'indicatore fornisce segnali ACQUISTA e VENDI accurati, inclusi i livelli di Stop Loss e Take Profit. Puoi fare trading anche in movimento utilizzando le notifiche PUSH. CONTATTAMI DOPO L'ACQUISTO PER RICEVERE GRATUITAMENTE LE ISTRUZIONI DI TRADING E OTTIMI INDICATORI EXTRA! Probabilmente hai già sentito parlare molte volte dei metodi d
Advanced Supply Demand
Bernhard Schweigert
4.91 (302)
Speciale Trading- SCONTO DEL 30% La soluzione migliore per qualsiasi trader principiante o esperto! Questo indicatore è uno strumento di trading unico, di alta qualità e conveniente, perché abbiamo incorporato una serie di funzionalità proprietarie e una nuova formula. Con questo aggiornamento, potrai visualizzare doppie zone di timeframe. Non solo potrai visualizzare un TF più alto, ma anche entrambi, il TF del grafico e il TF più alto: MOSTRA ZONE ANNIDATE. Tutti i trader che operano con Of
Questo indicatore è un indicatore per l'analisi automatica delle onde perfetto per il trading pratico! Caso... Nota:   non sono abituato a usare nomi occidentali per la classificazione delle onde a causa dell'influenza della convenzione di denominazione di Tang Lun (Tang Zhong Shuo Zen), ho chiamato l'onda base come   penna   e la banda dell'onda secondaria come   segmento   At allo stesso tempo, il segmento ha la direzione del trend. La denominazione   è principalmente segmento di trend   (que
Attualmente 30% di sconto! La soluzione migliore per ogni principiante o trader esperto! Questo software per cruscotti funziona su 28 coppie di valute. Si basa su 2 dei nostri indicatori principali (Advanced Currency Strength 28 e Advanced Currency Impulse). Offre un'ottima panoramica dell'intero mercato Forex. Mostra i valori di forza delle valute avanzate, la velocità di movimento delle valute e i segnali per 28 coppie Forex in tutti i (9) timeframe. Immaginate come migliorerà il vostro tra
Non repaint MT4
Yan Zhen Du
5 (2)
This is a professional chart indicator designed for traders focused on stability and clear price action. It helps filter market noise and provides clear visual entry and exit zones for your trading decisions. Price Information: The current price is promotional and is subject to change as upcoming updates and new features are released. MQL5 public channel:  CLICK HERE for MT5:  Non-repainting MT5 version Core Features: Strictly Non-Repainting: The system is built with strict non-repaint logic. W
Scalper Vault
Oleg Rodin
4.9 (41)
Scalper Vault è un sistema di trading potente e completo, progettato per i trader che desiderano ottenere risultati costanti nel trading intraday. Questo indicatore ad alta precisione funge da sistema di trading autonomo, offrendo analisi di livello istituzionale sia per il mercato Forex che per le Opzioni Binarie. CONTATTAMI DOPO L'ACQUISTO PER RICEVERE I MIEI CONSIGLI DI TRADING E UN FANTASTICO BONUS! Eliminando le congetture e le complesse analisi manuali, Scalper Vault ti permette di concen
Vi presentiamo ON Trade Waves Patterns Harmonic Elliot Wolfe, un indicatore avanzato progettato per rilevare vari tipi di pattern sul mercato utilizzando metodi sia manuali che automatici. Ecco come funziona: Pattern Armonici: Questo indicatore è in grado di individuare pattern armonici che appaiono sul vostro grafico. Questi pattern sono fondamentali per i trader che praticano la teoria del trading armonico, come descritta nel libro di Scott Carney "Harmonic Trading vol 1 & 2". Che li disegniat
RFI levels PRO
Roman Podpora
5 (2)
L'indicatore mostra accuratamente i punti di inversione e le zone di ritorno dei prezzi in cui il       Principali attori   . Vedi dove si formano le nuove tendenze e prendi decisioni con la massima precisione, mantenendo il controllo su ogni operazione. VERSION MT5     -     Rivela il suo massimo potenziale se combinato con l'indicatore   TREND LINES PRO Cosa mostra l'indicatore: Strutture di inversione e livelli di inversione con attivazione all'inizio di un nuovo trend. Visualizzazione dei l
ShapeRadar - indicatore dei pattern grafici classici ShapeRadar individua automaticamente sul grafico i pattern classici dell’analisi tecnica: doppi e tripli massimi e minimi, Testa e Spalle e la sua versione inversa, cunei ascendenti e discendenti, rettangoli, triangoli, bandiere e pennant. Quando il prezzo chiude oltre il limite di una figura, l’indicatore disegna il pattern, il punto di ingresso, il livello di stop loss e l’obiettivo, mentre un pannello informativo riassume tutti i pattern ri
PRO Renko System
Oleg Rodin
5 (31)
PRO Renko System è un sistema di trading altamente accurato appositamente progettato per il trading di grafici RENKO. Questo è un sistema universale che può essere applicato a vari strumenti di trading. Il sistema neutralizza efficacemente il cosiddetto rumore di mercato che consente di accedere a segnali di inversione accurati. L'indicatore è molto facile da usare e ha un solo parametro responsabile della generazione del segnale. Puoi facilmente adattare lo strumento a qualsiasi strumento di
SR Liquidity
Oleg Rodin
5 (3)
SR Liquidity è un indicatore di trading progettato per individuare le zone nascoste in cui si concentra la liquidità di mercato e dove il prezzo reagisce con maggiore intensità. Queste aree di liquidità agiscono come potenti livelli di supporto e resistenza, offrendo una mappa chiara dei punti in cui è più probabile che il mercato inverta la propria direzione. Invece di tracciare le classiche linee di supporto e resistenza, SR Liquidity analizza l'effettivo comportamento dei prezzi per individua
Auto Optimized SpeedAngle è un sistema di vettorizzazione del momento di livello istituzionale che elimina l'overfitting ( curve-fitting ) attraverso l'ottimizzazione continua Walk-Forward (WFO). Invece di affidarsi a input statici che si degradano quando i regimi di mercato cambiano, l'indicatore recalibra dinamicamente i suoi parametri utilizzando la validazione Out-of-Sample (OOS), assicurando che i segnali visualizzati rappresentino reali vantaggi statistici anziché anomalie storiche. Quadro
Professional Volume Profile An indicator for MetaTrader 4 that builds a horizontal Volume Profile directly on the price chart. It shows the levels where traders executed the most trades, helping to identify support/resistance zones and assess the balance of power in the market. What the Indicator Displays POC (Point of Control) — the level with the maximum trading volume (red line). VAH / VAL (Value Area High / Low) — the upper and lower boundaries of the value area, where 70% of the volume was
Scalping Entry Points - è un sistema di trading manuale che può adattarsi ai movimenti dei prezzi e dare segnali per aprire le negoziazioni senza ridisegnare. L'indicatore determina la direzione del trend dal livello centrale di supporto e resistenza. L'indicatore a punto fornisce segnali per entrate e uscite. Adatto per trading intraday manuale, scalping e opzioni binarie. Funziona su tutti i tempi e strumenti di trading. L'indicatore fornisce diversi tipi di avvisi. Come utilizzare il prodott
All in One package includes the  Oscillator Predictor ,  MACD Predictor ,  Thrust Scanner  and  Advanced Fibonacci  indicators which are mandatory for applying  Dinapoli  trade plans.  Please visit below links for detailed explanations of indicators. Advanced Fibonacci Indicator =>  https://www.mql5.com/en/market/product/52834 Thrust Scanner Indicator => https://www.mql5.com/en/market/product/52830 Overbought /Oversold Predictor indicator => https://www.mql5.com/en/market/product/52621 Macd P
Quantum Imbalance Profiles   è un indicatore delle fasi di equilibrio e squilibrio. Mostra a quali prezzi il mercato ha scambiato volume, quale parte ha dominato all'interno di quella zona e attraverso quali livelli il prezzo si è poi espanso con un impulso. Un profilo di volume classico risponde a una sola domanda: dove sono avvenuti gli scambi. Non mostra quale parte ha dominato a ogni prezzo, come si è conclusa la fase laterale né in quale direzione il mercato ne è uscito. Quantum Imbalance P
Currency Strength Matrix
Raymond Gilmour
4.5 (26)
THE ONLY CURRENCY STRENGTH INDICATOR BUILT ON PRICE ACTION Most currency strength meters average an oscillator, or measure how far price has travelled. But these are not accurate measures of trend, Currency Strength Matrix measures trend strength, not just if a currency price has gone up or down. Currency Strength Matrix reads market structure . For each of the 28 major pairs it finds the confirmed cycle highs and lows, and decides whether that pair is in an uptrend, a downtrend, or neither. A
Dark Support Resistance  is an Indicator for intraday trading. This Indicator is programmed to identify  Support and Resistance Lines , providing a high level of accuracy and reliability. Key benefits Easily visible lines Only the most important levels will be displayed Automated adjustment for each timeframe and instrument Easy to use even for beginners Never repaints, never backpaints, Not Lag 100% compatible with Expert Advisor development All types of alerts available: Pop-up, Email, Push
ATTUALMENTE SCONTATO DEL 40%! La soluzione migliore per ogni principiante o trader esperto! Questo indicatore è uno strumento di trading unico, di alta qualità e conveniente perché abbiamo incorporato una serie di caratteristiche proprietarie e una formula segreta. Con un solo grafico fornisce avvisi per tutte le 28 coppie di valute. Immaginate come migliorerà il vostro trading perché sarete in grado di individuare l'esatto punto di innesco di una nuova tendenza o opportunità di scalping! Co
Scalp Arrow Exit Signals (MT4 Indicator) A powerful all‑in‑one MT4 indicator providing precise entries, exits, and re‑entries across any timeframe or trading style. The Scalp Arrow Exit Signals is a complete “black‑box” signal system engineered for MT4 traders who want clarity, speed, and reliability. It generates clean buy/sell arrows along with exit, re‑entry, retracement, and pull‑back entry signals — all supported by flexible alerts and customizable risk settings. Whether you scalp fast ch
PZ Turning Points MT4
PZ TRADING SLU
1 (1)
Identify key turning points with reliable fractal analysis This indicator examines the price structure of fractals of different periods to determine possible reversal points in the market, providing timing to positional traders that already have a fundamental or technical valuation model. Unlike its younger brother, Reversal Fractals , this indicator won't miss reversals because of the period selected, and will find reversal fractals on a zig-zag fashion, ignoring those reversals which do not
Quant Direction
Georgios Kalomoiropoulos
Quant Direction è uno strumento di analisi di mercato 3D. Offre un'analisi di mercato perfettamente oggettiva, basata su algoritmi, calcolando con precisione le deviazioni percentuali su diversi parametri. Sviluppato utilizzando strumenti di modellazione avanzati basati sull'intelligenza artificiale e rigorosamente testato, questo algoritmo analizza il mercato con una precisione senza pari. È possibile analizzare qualsiasi coppia di valute o strumento finanziario sulla piattaforma. Che si pratic
Top Bottom Tracker è un indicatore basato su sofisticati algoritmi che analizza l'andamento del mercato ed è in grado di rilevare i massimi e i minimi del trend / Versione MT5 . Il prezzo aumenterà progressivamente fino a raggiungere i 500$. Prossimo prezzo --> 99$ Caratteristiche Nessuna riverniciatura Questo indicatore non cambia i suoi valori all'arrivo di nuovi dati Coppie di trading Tutte le coppie forex Timeframe Tutti i timeframe Parametri ==== Configurazione dell'indicatore ====
Neuro Poseidon MT4
Daria Rezueva
4.73 (45)
Neuro Poseidon is a new indicator by Daria Rezueva. It combines precise trading signals with adaptive TP/SL levels - creating best possible trades as a result! Message me and get  Neuro Poseidon Assistant  as a gift to automize your trading process! What makes it stand out? 1. Proven profitability on all assets and timeframes 2. Only confirmed BUY and SELL signals present on the chart 3. Adaptive TP & SL levels generated by the software for each trade 4. Easy to understand - suitable for all
AW Prime Oscillator
AW Trading Software Limited
5 (1)
Una combinazione di due oscillatori. Il primo mostra i punti di ingresso, il secondo mostra l'andamento attuale. L'indicatore può visualizzare i segnali dell'oscillatore tramite frecce in due modalità, tutti i segnali dell'oscillatore veloce o segnali solo nella direzione della tendenza attuale. Ha un pannello multi-intervallo temporale e tre tipi di notifiche di segnali. Benefici: Adatto per il trading giornaliero e scalping Filtraggio delle tendenze Configurazione semplice e sensibile Pannello
CRT Multi-Timeframe Market Structure & Liquidity Sweep Indicator Non-Repainting | Multi-Asset | MT5 Version Available MT5 Version:   https://www.mql5.com/en/market/product/162075 Full User Guide — explains what each feature does and why:   https://www.mql5.com/en/blogs/post/767525 Quick Start User Guide  — explains how to configure and in what order:  https://www.mql5.com/en/blogs/post/767540 Indicator Overview CRT Ghost Candle HTF Fractal is a complete institutional-grade market structure too
Altri dall’autore
### Crossfire Pro MT4: Precision HYBRID Indicator **Crossfire Pro** is an institutional-grade hybrid indicator engineered specifically for MetaTrader MT4. A volatility-adapted hybrid indicator for MetaTrader MT4 (Crossfire Pro) that pairs Average True Range (ATR) volatility expansion bands paired with tick volume surge filters to signal high-probability swing and momentum entries with signals evaluated strictly on closed bars to prevent repainting and on-chart signal markers and terminal alert
### Triad Breakout Pro MT4: Precision HYBRID Indicator **Triad Breakout Pro** is an institutional-grade hybrid indicator engineered specifically for MetaTrader MT4. A volatility-adapted hybrid indicator for MetaTrader MT4 (Triad Breakout Pro) that pairs Average True Range (ATR) volatility expansion bands paired with tick volume surge filters to signal high-probability swing and momentum entries with real-time multi-bar execution signals and real-time chart popups and mobile push notifications.
Filtro:
Nessuna recensione
Rispondi alla recensione