Heiken Ashi Scanner Dashboard Multi Pair Timeframe

Overview and Primary Objective of the Software
The Heiken Ashi Scanner Dashboard is a professional multi-symbol and multi-timeframe analytical utility engineered for the MetaTrader 5 terminal. The core objective of this software is to eliminate the analytical limitations and CPU overhead associated with manually monitoring dozens of individual price charts. By consolidating the data feed of up to 10 distinct financial instruments across multiple timeframes simultaneously, the dashboard provides a unified graphical matrix of prevailing market trends based on Heiken Ashi candlestick formations. This tool functions strictly as an observational scanner and alert mechanism; it does not execute automated trades, nor does it employ any high-risk money management methodologies such as Martingale, Grid, or Arbitrage. It is designed for technical analysts who require rigorous algorithmic filtering before validating a market structure. To ensure signals are not triggered by random market noise, the dashboard integrates a complex MultiFilterSuite framework consisting of 14 modular technical indicators. Every signal generated on the dashboard is accompanied by a mathematical calculation for Average True Range (ATR) to project theoretical Stop Loss and Take Profit levels, assisting the user in evaluating the structural risk-to-reward ratio before manual execution.

Algorithmic Logic and Operating Principle
The computational engine of this scanner is fundamentally anchored in the Heiken Ashi (HA) formula. Unlike standard Japanese candlesticks that plot raw Open, High, Low, and Close data, the Heiken Ashi algorithm averages these data points to create a smoother, more continuous representation of directional momentum. The internal calculation operates sequentially from the oldest historical bar to the newest:
1. HA Close = (Open + High + Low + Close) / 4.
2. HA Open = (Previous HA Open + Previous HA Close) / 2.
3. HA High = Maximum value among the current raw High, HA Open, and HA Close.
4. HA Low = Minimum value among the current raw Low, HA Open, and HA Close.

Signal Validity and Strict Non-Repaint Characteristics
All signal evaluations are conducted on historical timeseries data buffers. The software strictly evaluates closed bars (Bar 1 and older). It actively ignores the currently forming, unclosed candle (Bar 0) for final signal generation on the dashboard. Consequently, once a signal is registered on the dashboard interface and the corresponding graphical markers are plotted on the chart, the signal is absolutely Non-Repainting. The arrows and lines will never shift, disappear, or recalculate their values retroactively, ensuring complete transparency in historical structural analysis.

Core Entry Methodologies and Trigger Conditions
The scanner is equipped with two distinct mathematical trigger logics, selectable by the user:
Entry Logic 1: Heiken Ashi No Wick (Momentum Continuity)
When deployed, the algorithm conducts a chronological scan through the lookback period. It waits for a structural shift where the previous HA candle was bearish, but the current closed HA candle is bullish. For a Buy signal to be validated, the algorithm strictly requires the current bullish HA candle to have zero lower wick (HA Low equals HA Open). Conversely, a Sell signal is validated when the trend shifts from bullish to bearish, and the new bearish HA candle possesses zero upper wick (HA High equals HA Open). This logic indicates strong, uninterrupted momentum.
Entry Logic 2: Heiken Ashi Color Flip (Early Reversal)
When this alternative logic is selected, the scanner performs a reverse iteration starting from the most recently closed bar. It purely seeks the exact moment of a color change. A Buy signal is logged when Bar 2 (the previous closed bar) was mathematically bearish, but Bar 1 (the most recent closed bar) is bullish. A Sell signal is triggered under the exact inverse condition.

Dynamic Risk Management and ATR Projection Engine
Upon the successful validation of either logic, the software immediately queries the Average True Range (ATR) buffer for the specific symbol and timeframe. The theoretical Stop Loss (SL) is computed by multiplying this ATR value by a user-defined floating-point multiplier. For a bullish setup, the SL is projected downwards: Entry Price - (ATR * Multiplier). For a bearish setup, the SL is projected upwards: Entry Price + (ATR * Multiplier). Following the establishment of the SL distance, the software projects two theoretical Take Profit (TP) targets calculated based on user-defined Risk-to-Reward (RR) ratios measured from the Entry-to-SL distance.

MultiFilterSuite Framework: Technical Validation Modules
The analytical depth of this dashboard resides in the embedded MultiFilterSuite. Each of the 14 technical filters operates on independent indicator handles and requires explicit activation to participate in the signal validation sequence. The software utilizes strict boolean AND logic; a single failure among the active filters will instantly invalidate the Heiken Ashi base signal.

1. RSI Cross Threshold Filter: For a Buy signal, the algorithm checks the timeseries buffers to ensure the RSI value on the previous bar was equal to or below the Oversold threshold, and the current bar's RSI is strictly above it. For a Sell, it requires a cross below the Overbought threshold.
2. ADX Trend Strength Filter: Regardless of signal direction, the ADX main line value must be strictly greater than the user-defined minimum level to ensure sufficient market volatility.
3. Single Moving Average Filter: Buys are strictly invalidated if the close price is below the MA. Sells are invalidated if the close is above the MA.
4. Ichimoku Senkou Span B Cloud Filter: Requires the raw closing price to be structurally positioned above the Span B line for long signals, and below it for short signals.
5. RSI Midline (75-Period) Filter: Buy signals are exclusively permitted when the slow RSI is strictly > 50.0, and Sell signals when the slow RSI is < 50.0.
6. Double Moving Average Crossover Filter: A Buy signal is permitted only if the Fast MA data array value is numerically greater than the Slow MA data array value on the evaluated shift.
7. Awesome Oscillator (AO) Composite Filter: Contains three independent sub-checks. The Volume Filter requires the absolute AO histogram value to exceed specific minimums. The Color Filter compares the current AO bar to the previous AO bar to ensure momentum is accelerating. The Zero-Line Filter dictates that the AO histogram must reside above 0.0 for Buys and below 0.0 for Sells.
8. Parabolic SAR Acceleration Filter: Buys are allowed only when the Close price is tracking above the calculated SAR coordinate for that specific bar. Sells require the price below the SAR dots.
9. Heiken Ashi Secondary Trend Filter: Calculates a separate layer of Heiken Ashi data to ensure the micro-signal aligns with macro-HA momentum.
10. CCI Trend Baseline Filter: Assesses the raw value against the absolute zero baseline. Buys require CCI > 0.0, indicating bullish deviation.
11. CCI Overbought/Oversold Filter: Buy signals require the CCI to cross upwards from a state below the oversold threshold (-100). Sell signals require crossing downwards from the overbought threshold (100).
12. RVI Trend Momentum Filter: If the Relative Vigor Index main line evaluates to a value less than or equal to 0.0, all Buy signals are immediately rejected.
13. RVI Signal Line Crossover Filter: Compares the spatial relationship between the RVI Main Line and the RVI Signal Line buffers. Buy setups require the Main Line to be mathematically superior to the Signal Line.
14. MACD Histogram & Zero Line Filters: The Histogram check mathematically subtracts the MACD Signal buffer from the MACD Main buffer; Buys are rejected if the result is negative. The Zero Line check demands the MACD Main buffer be positive for longs and negative for shorts.
15. Support & Resistance Proximity Filter: Loops backward through the timeseries array over a defined period to record the Highest High and Lowest Low. A Buy signal is valid if the current bar's Low price touched or came within a strictly defined point-based tolerance zone of the Support level.
16. Fibonacci Structural Retracement Filter: Integrates an internal ZigZag algorithm to map structural swing highs and lows dynamically. It calculates the range between peaks and valleys, applies Fibonacci ratios to define a retracement band, and verifies if the signal bar physically intersects this mathematical zone.

Dashboard Graphical User Interface (GUI) Mechanics
The interface renders a multi-column matrix displaying the Pair, Timeframe, Direction, Signal Time, Entry Price, SL, TP1, TP2, ATR value, and Age of the signal. Users can dynamically sort rows by clicking the column headers. Every signal row features an interactive 'OPEN' button. When clicked, the software utilizes ChartSetSymbolPeriod to instantly transform the active chart window to the exact instrument and timeframe of the selected signal. Upon loading, the drawing engine automatically plots OBJ_TREND dashed lines and OBJ_TEXT labels anchoring the Entry, SL, and TP levels at the signal bar's timestamp.

Operation and Setup Recommendations
- Asset Selection: The scanner performs optimally on highly liquid currency pairs, major indices, and high-volume commodities (e.g., EURUSD, GBPJPY, XAUUSD, US30).
- Timeframe Application: While operational from M1 to MN1, the mathematical reliability of Heiken Ashi and structural filters is substantially higher on M15, H1, and H4 timeframes.
- Latency and VPS: Since the scanner evaluates historical closed bars, ultra-low latency is not strictly mandatory. However, if scanning 10 pairs across 5 timeframes with multiple complex filters enabled, a stable VPS environment is recommended.
- Account Specifications: Standard, Hedging, or Netting accounts are supported. Low spread environments (ECN/Raw) are recommended to maintain precision in the mathematical relationship between open and close prices.

Complete Documentation of Input Parameters

=== [LOGIC] ENTRY METHOD SELECTION ===
- InpEntryMethod (Default: ENTRY_HA_NO_WICK) -> Dictates the foundational trigger mechanism. Select between momentum continuation logic (No Wick) or structural reversal logic (Color Change).

=== [LOGIC] SCANNER CORE SETTINGS ===
- InpSymbols (Default: EURUSD,GBPUSD,USDJPY,AUDUSD,USDCAD,USDCHF,NZDUSD,EURJPY,GBPJPY,XAUUSD) -> A comma-separated string dictating the specific symbols the software will loop through.
- InpTimeframes (Default: M5,M15,M30,H1,H4) -> A comma-separated string declaring the timeframes for analysis.
- InpUseWatch (Default: true) -> If true, the software overrides the InpSymbols list and scans every visible instrument within the Market Watch window.
- InpMaxSymbols (Default: 10) -> Integer limit defining the absolute maximum number of instruments to process.
- InpScanSec (Default: 7) -> Defines the frequency of the EventSetTimer loop in seconds.
- InpBarsCopy (Default: 120) -> Instructs the CopyRates function on how many historical bars to download into local memory per timeframe.
- InpLookback (Default: 80) -> The maximum chronological depth (in bars) the scanning loop will iterate backward to locate a valid signal.
- InpDirection (Default: 0) -> Controls directional filtering (0 = Both, 1 = Buy Only, 2 = Sell Only).

=== [LOGIC] ATR SL & TP SETTINGS ===
- InpATRPeriod (Default: 14) -> Calculation period for the Average True Range indicator.
- InpATRMultSL (Default: 1.5) -> Floating-point coefficient multiplied against the raw ATR value to determine Stop Loss distance.
- InpTP1_RR (Default: 1.0) -> Geometric reward multiplier for Take Profit 1 relative to SL distance.
- InpTP2_RR (Default: 2.0) -> Geometric reward multiplier for Take Profit 2 relative to SL distance.

=== [LOGIC] ALERT & NOTIFICATION ===
- InpAlertPopup (Default: false) -> Triggers native MetaTrader alert dialog boxes.
- InpAlertSound (Default: false) -> Triggers the playback of a localized audio file.
- InpSoundBuy (Default: alert.wav) / InpSoundSell (Default: alert2.wav) -> Audio filenames for bullish and bearish triggers.
- InpAlertPush (Default: false) -> Dispatches push notifications to the MetaQuotes ID.
- InpAlertEmail (Default: false) -> Transmits a text breakdown of the signal via SMTP server.
- InpEmailSubject (Default: HA Scanner Signal) -> Customized text string for the email subject header.
- InpAlertOnlyNew (Default: false) -> If true, restricts alerts strictly to signals generated on the most recently closed bar.

=== [LOGIC] DISPLAY & UI SETTINGS ===
- InpX (Default: 12) / InpY (Default: 28) -> X and Y coordinates positioning the dashboard relative to the chart corner.
- InpScale (Default: 100) -> Percentage-based scaling multiplier adjusting physical dimensions (70-160).
- InpRowH (Default: 18) -> Absolute pixel height assigned to each individual data row.
- InpFont (Default: 8) -> Base integer font size applied to textual elements.
- InpPadX (Default: 8) -> Horizontal pixel margin separating text data from internal cell borders.
- InpWPair to InpWOpen -> Series of integer inputs defining column widths in pixels (Pair, TF, Direction, Time, Entry, SL, TP1, TP2, ATR, Age, Open).
- InpShowEmpty (Default: false) -> If true, displays rows for symbols/timeframes even if signal validity is false.
- InpMaxRows (Default: 18) -> Limits the vertical rendering of the matrix to prevent UI overflow.
- InpSortBy (Default: SORT_TIME) -> Establishes the default array sorting parameter.
- InpSortNewest (Default: true) -> True forces the most recent timestamps to occupy the top rows.

=== [LOGIC] CHART MARKERS & LEVELS ===
- InpDrawOnChart (Default: true) -> Master toggle granting permission to dynamically create trend lines and text elements.
- InpShowArrow (Default: true) -> Toggles the creation of objects pinpointing the exact entry bar.
- InpShowLevels (Default: true) -> Toggles the creation of horizontal dashed lines for Entry, SL, and TP.
- InpExtendBars (Default: 25) -> Instructs object creation on how many bars into the future the lines project.
- InpArrowCodeBuy (233) / InpArrowCodeSell (234) -> Numerical character codes mapped to the Wingdings font family.
- InpArrowSize (Default: 2) -> Modifies the width parameter of arrow objects.
- InpArrowDistance (Default: 15) -> Defines vertical offset spacing in points between candlestick extremes and arrows.

=== [LOGIC] COLOR PALETTE ===
- InpColBg through InpColTP2 -> Contains configuration variables allowing users to modify RGB hex values of Dashboard Background, Headers, Rows, Text, Arrows, and Target Lines.

=== MULTIFILTERSUITE PARAMETERS ===
- Use_RSI_Cross_Filter (Default: false) -> Toggles RSI threshold crossover logic.
- RSI_Length (14) / RSI_Price_Source (PRICE_CLOSE) / RSI_Oversold (30.0) / RSI_Overbought (70.0) -> RSI indicator calculation inputs and threshold limits.
- Use_ADX_Filter (Default: false) -> Toggles Average Directional Index trend strength verification.
- ADX_Period (10) / ADX_Min_Level (20.0) -> ADX smoothing period and minimum volatility threshold.
- Use_MA_Filter (Default: false) -> Toggles Single Moving Average spatial verification.
- MA_Period (50) / MA_Method (MODE_SMA) / MA_Shift (0) -> Moving average calculation and displacement variables.
- Use_Ichimoku_Filter (Default: false) -> Toggles spatial comparison against the Ichimoku Kinko Hyo indicator.
- Ichimoku_Tenkan (9) / Ichimoku_Kijun (26) / Ichimoku_SenkouB (52) -> Period configurations for Ichimoku cloud lines.
- Use_RSI75_Filter (Default: false) -> Toggles macroeconomic sentiment evaluation using slow RSI.
- RSI_Filter_Period (75) -> Lookback period required to compute long-term relative strength.
- Use_DoubleMA_Filter (Default: false) -> Toggles comparative logic between Fast and Slow Moving Averages.
- MA_A_Period (30) / MA_B_Period (140) / MA_A_Method / MA_B_Method / MA_A_Applied / MA_B_Applied / MA_A_Shift / MA_B_Shift -> Variables governing the mathematical calculation of the dual averages.
- Use_AO_Filter (Default: false) -> Master toggle enabling Awesome Oscillator momentum evaluation.
- Use_AO_Volume_Filter (false) / AO_Buy_Min (4.0) / AO_Sell_Max (-4.0) -> Evaluates AO histogram volume extremums.
- Use_AO_Color_Filter (false) / Use_AO_Zero_Filter (false) -> Evaluates AO directional expansion and zero-line alignment.
- Use_SAR_Filter (Default: false) -> Toggles geometric assessment against Parabolic SAR coordinates.
- SAR_Step (0.02) / SAR_Maximum (0.2) -> Incremental acceleration factors applied to the SAR equation.
- Use_HeikenAshi_Filter (Default: false) -> Toggles secondary macro Heiken Ashi trend check.
- Use_CCI_Filter (Default: false) -> Toggles baseline momentum check using Commodity Channel Index.
- CCI_Period (50) / CCI_Applied (PRICE_CLOSE) -> Lookback period and applied price for the CCI engine.
- Use_CCI_OBOS_Filter (Default: false) -> Toggles exhaustion boundary logic to detect sharp market reversals.
- CCI_OBOS_Period (14) / CCI_Overbought (100.0) / CCI_Oversold (-100.0) -> Reversal-specific CCI parameters.
- Use_RVI_Filter (Default: false) -> Toggles baseline structural alignment using Relative Vigor Index.
- RVI_Period (75) -> Processing period assigned to compute RVI main line.
- Use_RVI_Signal_Filter (Default: false) -> Toggles crossover logic between RVI main line and signal line.
- RVI_Signal_Period (20) -> Smoothing period for RVI signal line array.
- Use_MACD_Filter (Default: false) -> Toggles momentum verification between MACD Main and Signal Lines.
- MACD_FastEMA (12) / MACD_SlowEMA (26) / MACD_SignalSMA (9) / MACD_Applied (PRICE_CLOSE) -> Variables governing the MACD oscillator calculations.
- Use_MACD_Zero_Filter (Default: false) -> Enforces a rule that the MACD Main Line must structurally reside above/below the zero baseline.
- Use_SR_Filter (Default: false) -> Toggles algorithmic geometric identification of historical Support and Resistance.
- SR_Period (50) / SR_Zone_Points (80) -> Historical depth and mathematical tolerance margin defining the interactive proximity zone.
- Use_Fib_Filter (Default: false) -> Toggles dynamic structural retracement zone analysis based on automated swing mapping.
- Fib_Level_1 (0.382) / Fib_Level_2 (0.618) -> Fractional ratios utilized to calculate the boundary of the retracement band.
- ZigZag_Depth (12) / ZigZag_Deviation (5) / ZigZag_Backstep (3) -> Variables directing the internal algorithm on how to filter noise and identify valid macro swing structures.

Strict Formal Risk Disclaimer
Trading foreign exchange (Forex), commodities, equities, indices, and any other highly leveraged financial derivatives involves a severe and substantial risk of capital loss and may not be suitable for all types of investors. The usage of margin and leverage can compound losses just as rapidly as it can compound gains. You should carefully consider your investment objectives, level of experience, and risk appetite before deciding to participate in the financial markets. Past performance of any specific trading algorithm, indicator, dashboard, methodology, or software program does not provide any guarantee of future financial results. This software product (Heiken Ashi Scanner Dashboard) is classified strictly as an informational, analytical, and operational charting utility. It is designed to assist technical analysts in mathematically plotting specific graphical structures and calculating theoretical statistical data arrays; it explicitly does not constitute direct financial, investment, or trading advice, and it provides no assurances regarding financial profitability. Unforeseen market volatility, extreme geopolitical news events, sudden gaps in pricing, and severe liquidity conditions can cause the mathematical models represented by the software to perform erratically or differently in live real-time conditions compared to historical timeseries data. Users are strongly mandated to thoroughly evaluate and test the entire functionality of this product within a simulated Demo Account environment. You must fully comprehend the mathematical mechanics of the algorithmic filters and the behavior of the graphical interface before ever considering the deployment of this tool in a live trading environment with real capital risk. The end-user accepts total and absolute responsibility for all trading execution decisions, position sizing, and risk management protocols applied in their respective accounts.
Prodotti consigliati
Show Pips for MT5
Roman Podpora
4.5 (32)
Questo indicatore informativo sarà utile per coloro che vogliono essere sempre informati sulla situazione attuale del conto. VERSION MT 4 -   More useful indicators L'indicatore mostra dati come profitto in punti, percentuale e valuta, nonché lo spread per la coppia corrente e il tempo fino alla chiusura della barra nell'intervallo di tempo corrente. Esistono diverse opzioni per posizionare la linea delle informazioni sulla carta: A destra del prezzo (corre dietro al prezzo); Come commento (nell
FREE
Stochastic   +   RSI   Multi-Timeframe   Dashboard   with   Momentum   Strength Need Trade Assistant? Trade Panel Pro MT 5 Please leave a review, if you like this.   OVERVIEW A   professional   multi-timeframe   dashboard   indicator   that   displays   Stochastic   Oscillator   and   RSI   (Relative   Strength   Index)   values   from   7   different   timeframes   simultaneously   on   a   single   compact   panel.   Perfect   for   scalpers   and   day   traders   who   need   quick   m
FREE
Flusso di volume in acquisto e in vendita in una finestra separata, sul tuo grafico MetaTrader 5. JET Volume Flow mostra, in una finestra separata, quanta parte del volume recente è andata nelle barre rialziste e quanta nelle barre ribassiste. Sopra lo zero il flusso è in acquisto (istogramma verde); sotto lo zero è in vendita (istogramma rosso). I movimenti di prezzo molto piccoli vengono ignorati e i picchi di volume fuori dal normale vengono limitati, così una singola barra non domina la lett
FREE
Stamina HUD
Michele Todesco
STAMINA HUD – Advanced Market & Trend Dashboard (MT5) STAMINA HUD   is a professional   market information panel   designed for traders who want   clarity, speed, and control   directly on the chart. It provides a   clean heads-up display (HUD)   with essential market data and   multi-timeframe trend direction , without cluttering the chart or generating trading signals. What STAMINA HUD Shows   Current Price   Spread (in real pips)   Today High–Low range (pips)   Average D
FREE
KF Market Structure
Abdul Malikul Hanan
KF Market Structure — Smart Money Concepts Trend & Breakout Analyzer KF Market Structure is a clean, rule-based Smart Money Concepts (SMC) indicator for MetaTrader 5 that automatically detects and visualizes market structure: Swing Highs, Swing Lows, Break of Structure (BOS), and Change of Character (CHoCH). Built strictly for closed bar evaluation, it provides an objective structural baseline for Price Action traders and automated trading strategies without erratic signals. Whether you trade
FREE
B2U Market State System Part of the B2U Market State System A professional indicator suite designed to analyze market structure, trend state, and momentum. B2U Market State System 의 구성 요소입니다. 시장 구조, 추세 상태, 모멘텀을 입체적으로 분석하기 위한 전문 인디케이터 시스템입니다. Visualizes momentum state and pressure balance within market structures. B2U Ultimate %R Edition goes beyond the traditional Williams %R numeric oscillator. 과매수 · 과매도를 색상과 라인으로 ‘ 상태화 ’ 하다 .” B2U Ultimate %R Edition 은  단순히 전통 Williams %R 을 “ 과매수 / 과매도 숫자 지표 ”
FREE
My Fibonacci MT5
Ahmad Aan Isnain Shofwan
My Fibonacci MT5 An automated Fibonacci indicator for MetaTrader 5 that combines ZigZag swing detection with comprehensive Expert Advisor integration through a 20-buffer system. More details about data specification and EA integration: https://www.mql5.com/en/blogs/post/764114 Core Features Automated Fibonacci Detection The indicator identifies swing points using configurable ZigZag parameters and draws Fibonacci retracements and extensions automatically. It updates levels as new swing formatio
FREE
TradeInfos
Dustin Ricardo Pierenz
Track your spread and all position PnLs (Buy & Sell) in real-time – stay in control of your trades at a glance! Features: Real-time spread display (in pips) Total Buy position PnL Total Sell position PnL Clean, non-intrusive display layout Works with all symbols and timeframes Perfect for: Scalpers needing quick spread awareness Day traders monitoring long/short performance Risk managers optimizing exposure No need to switch tabs or rely on external tools — everything you need is visible at
FREE
RelicusRoad CopyTrader è un copiatore di operazioni ( trade copier ) gratuito per MetaTrader 5 . Copia le operazioni tra terminali MT5 sullo stesso computer, così puoi operare su un conto e far seguire gli altri, ciascuno con la propria dimensione e il proprio rischio. Versione completa, senza limitazioni né periodo di prova. Fai trading su un conto. Lascia che gli altri seguano. MetaTrader 4: RelicusRoad CopyTrader MT4 Come funziona Un terminale funziona come Leader (master) e condivide gli ord
FREE
Descrizione dell'indicatore MonteCarlo Bands L'indicatore   MonteCarloBands   è uno strumento di analisi prospettica che utilizza il metodo Monte Carlo per proiettare possibili scenari futuri del prezzo di un asset finanziario. Si presenta come una serie di cinque bande percentili che si estendono nel futuro, visualizzando un "cono di probabilità" basato sul comportamento storico del mercato. Aspetto visivo: P50 (Mediana) : Linea verde continua al centro, rappresenta il percorso mediano atteso P
FREE
AI London Session Range Indicator automatically draws the London session's opening range as a box on your chart, giving breakout and session traders an instant, objective reference for the high-volatility window that sets the tone for the rest of the trading day. The indicator tracks the exact high and low reached during the configured opening-range window after the London session start, plots it as a shaded box, and keeps it visible for the rest of the session so you can watch for breakouts, re
FREE
TradeVision Pro
Ian Nganga Comba
TradeVisonPro Forex Analyzer Pro Dashboard di analisi e monitoraggio dei conti di trading MT5 TradeVisonPro Forex Analyzer Pro è una soluzione di analisi del trading e monitoraggio dei conti progettata per gli utenti di MetaTrader 5. Il prodotto organizza i dati di trading MT5 in una dashboard web strutturata, consentendo ai trader di visualizzare le informazioni del conto, monitorare le posizioni aperte, analizzare lo storico delle operazioni, seguire le strategie, mantenere un diario di tradin
FREE
MACD Colored ZeroLag
Farzin Sadeghi Bonjar
4.73 (11)
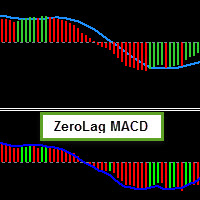
It is the MQL5 version of zero lag MACD that was available for MT4 here: https://www.mql5.com/en/code/9993 Also there was a colored version of it here but it had some problems: https://www.mql5.com/en/code/8703 I fixed the MT4 version which has 95 lines of code. It took me 5 days to write the MT5 version.(reading the logs and testing multiple times and finding out the difference of MT5 and MT4!) My first MQL5 version of this indicator had 400 lines of code but I optimized my own code again and n
FREE
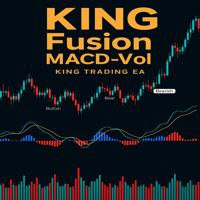
- وصف المنتج - مؤشر احترافي متكامل لا يعد KING Fusion MACD-Vol من KING TRADING EA مجرد MACD آخر — فهو عبارة عن مجموعة أدوات تداول كاملة تجمع بين مؤشرات احترافية متعددة في نافذة فرعية واحدة أنيقة. لم تعد بحاجة إلى تحميل مخططك بأدوات منفصلة. يجمع هذا المؤشر بين: MACD مع خطوط مزدوجة ورسم بياني مكبر رسم بياني ملون ومثبت بالحجم ملصقات ديناميكية مع قيم المؤشرات في الوقت الفعلي (ATR، ADX، RSI، Volume) عداد تنازلي للبار التنبيهات المتقاطعة (مرئية + صوتية) كل ما تحتاجه من الوضوح والسرعة والدقة -
FREE
Indicatore Crypto_Forex "HTF Moving Averages Cross" per MT5. - Migliora i tuoi metodi di trading con il potente indicatore HTF Moving Averages Cross per MT5. HTF significa "intervallo di tempo più lungo". - Questo indicatore è eccellente per i trader di tendenza con movimenti di prezzo. - Permette di collegare medie mobili veloci e lente da intervalli di tempo più lunghi al grafico corrente --> questo è un metodo professionale. - HTF Moving Averages Cross ha avvisi integrati per dispositivi mob
RSI Currency Strength Meter is a powerful and elegant multi-currency indicator that measures the real-time relative strength of the 8 major currencies using RSI logic. By calculating the smoothed performance of each currency across its major pairs and applying the RSI formula, it delivers clean and responsive strength lines that make it easy to spot which currencies are truly strong or weak at any moment. This indicator is particularly useful for visualizing currency correlations and divergence
Blahtech VWAP MT5
Blahtech Limited
5 (1)
Blahtech VWAP - Volume Weighted Average Price (VWAP) is the ratio of price to total volume. It provides an average price over a specified time interval.  Links [  Install  |  Update  |  Documentation   ] Feature Highlights Configurable VWAP Line Sessions, intervals, anchored or continuous Previous day settlement line Standard Deviation bands Alerts at bar close or real time Automatic Broker or Tick volumes Significantly reduced CPU usage Input Parameters Expert Advisor Mode  - Reserved for iCu
FREE
Ultimate Multi-Timeframe Pattern Scanner Dashboard is a high-performance, advanced technical tool designed to automatically scan and identify 14 of the most powerful candlestick patterns simultaneously across multiple currency pairs and timeframes. Built with a highly optimized, timer-driven architecture, this dashboard updates seamlessly without causing platform lag or freezing, making it the perfect scanner for active traders who want to monitor the entire market from a single chart. ️ IMPORT
FREE
Rating Meter: una valutazione consolidata da 26 indicatori Rating Meter calcola per voi i segnali di 26 indicatori molto diffusi e li riunisce in una valutazione semplice del tipo «vendere / neutrale / comprare». Non serve aprire le finestre dei singoli indicatori e confrontare i valori a mano. Basta un'occhiata al pannello per capire da che parte pende il mercato sul timeframe selezionato. Our products: https://www.mql5.com/en/users/trendhunter/seller Cosa mostra il pannello Indicatore Oscillat
FREE
Enhanced FVG Enhanced FVG is a technical indicator for MetaTrader 5 that identifies Fair Value Gaps on the chart and measures the buyer-to-seller volume ratio within each detected gap. Volume classification is performed using M1 timeframe tick volume data, applying the same methodology used in standard Volume Profile analysis. How It Works The indicator scans three consecutive candlesticks to detect Fair Value Gaps. A Bullish FVG is identified when the high of the first candle does not overlap w
FREE
VFI Quantum
Nikita Berdnikov
5 (1)
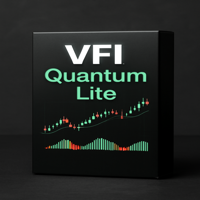
Introducing VFI (Volume Flow Indicator) – a trading indicator that analyzes the relationship between volume and price movement to identify key trading opportunities. The indicator displays the strength and direction of volume flow, providing clear signals about potential entry and exit points. Signals are formed based on zero line crossovers, crossovers between the VFI line and its exponential moving average (EMA), and when the indicator exits overbought and oversold zones. Attention! This stra
FREE
Trading Sessions by Mahefa R is an indicator for MetaTrader 5 that visually identifies the four main trading sessions: New York, London, Tokyo, and Sydney . Designed to provide a clean, intuitive, and professional market view, it highlights the most active periods of the Forex market using smart visualization of session ranges , session-specific candle colors , and daily separators . Main Features: Automatic detection of the 4 major sessions New York London Tokyo Sydney Each session is fully c
FREE
Reverse TradeCopier for Followers can copy trades from an account that is running   Reverse TradeCopier for Source . Features: Copies trades from one source (master) account to multiple following (slave) accounts. Allow investor (read only) password for source (master) account. There are no complicated settings and input parameters, everything is easy. Works with different brokers. Works with different quotes symbols (EURUSD_FX, eurusd_m, etc.). Can copy orders from 4-digit quotes platform to 5-
FREE
Visual Supertrend indicator
AL MOOSAWI ABDULLAH JAFFER BAQER
• Please test the product in the Strategy Tester before purchasing to understand how it works. • If you face any issues, contact me via private message—I’m always available to help. • After purchase, send me a screenshot of your order to receive a   FREE EA   as a gift. Supertrend is a trend-following indicator based on Average True Range (ATR). The calculation of its single line combines trend detection and volatility. It can be used to detect changes in trend direction and to position stops.
Phantom ICT
Thanaphat Jantawee
5 (1)
PHANTOM ICT MTF EA is an automated trading system designed for XAUUSD (Gold), using a multi-timeframe analysis approach. The system focuses on identifying structured market conditions and executing trades based on selective entry logic. It is not designed for frequent trading, but instead waits for specific conditions before opening positions. Core Features Multi-timeframe analysis (D1 / H4 / M5) Selective trade entry based on structured conditions Designed for short-term execution on M5 timefr
FREE
Spread & Swap Monitor — Real-Time Trading Cost & Rollover Fee Tracker for MT5 Never enter a trade blind to broker spreads and overnight financing fees. Spread & Swap Monitor provides an elegant, non-intrusive on-chart HUD that continuously tracks live spread volatility against a rolling average and calculates real swap costs directly converted into your account currency. KEY FEATURES - Real-Time Spread Tracking: Displays live spread in both pips and raw points. - Dynamic Volatility Alert: Spr
FREE
GOM Trade Manager
Wannapach Chinnaprapa
GOM Trade Manager helps you execute trades the way you want it. Works on all instruments Forex, Commodities, & Crypto. It helps you with lot calculations, spread addition and balance calculations so you can just focus on actual trading. For full automatic planned management, stackable triggers and spread widening protection >> check out GOM Trade Manager Pro . ------------------------------------------NOTABLE FEATURES------------------------------------------ You set everything based on bid
FREE
Free automatic Fibonacci is an indicator that automatically plots a Fibonacci retracement based on the number of bars you select on the BarsToScan setting in the indicator. The Fibonacci is automatically updated in real time as new highest and lowest values appears amongst the selected bars. You can select which level values to be displayed in the indicator settings. You can also select the color of the levels thus enabling the trader to be able to attach the indicator several times with differe
FREE
Follow The Line MT5
Oliver Gideon Amofa Appiah
4.6 (35)
This indicator obeys the popular maxim that: "THE TREND IS YOUR FRIEND" It paints a GREEN line for BUY and also paints a RED line for SELL. (you can change the colors). It gives alarms and alerts of all kinds. IT DOES NOT REPAINT and can be used for all currency pairs and timeframes. Yes, as easy and simple as that. Even a newbie can use it to make great and reliable trades. NB: For best results, get my other premium indicators for more powerful and reliable signals. Get them here: https://www.m
FREE
Fabii Memory Support Resistance
Fabien Georges Andre Guillemaud
Smetti di indovinare quali zone di supporto e resistenza contano: ognuna mostra quante volte il prezzo l'ha testata. No repaint. Qualsiasi coppia, qualsiasi timeframe. Sul tuo grafico in 2 minuti. Test gratuito nello Strategy Tester. Get more indicators here Baselines, volatility filters and oscillators. No repaint. Perché ti serve Disegni supporto e resistenza a mano, e due trader non disegnano mai gli stessi livelli sullo stesso grafico. Non sai quali livelli meritano la tua attenzione. Met
Gli utenti di questo prodotto hanno anche acquistato
Trend Sniper X
Sarvarbek Abduvoxobov
4.87 (46)
Trend Sniper X è un indicatore trend-following multi-timeframe per MetaTrader 5 che aiuta i trader a identificare la direzione del trend e i potenziali punti di inversione con chiarezza e precisione. per MT4: https://www.mql5.com/en/market/product/193245 Informazioni sul prezzo: Il prezzo attuale è promozionale ed è soggetto a modifiche con il rilascio di futuri aggiornamenti e nuove funzionalità. Offerta Bonus: Per ricevere GRATIS l'Auto-Trade Assistant EA per questo indicatore, invia un messa
Smart Trend Trading System — MetaTrader 5 Dopo l'acquisto, inviami un messaggio su MQL5 per ricevere GRATUITAMENTE Smart Universal Expert Advisor, insieme al corso online, al manuale PDF e all'accesso al gruppo privato. STTS riunisce la direzione del trend, i segnali di entrata e uscita, le zone di inversione e i livelli di prezzo importanti direttamente sul grafico. Segui il sistema manualmente oppure collega un EA compatibile separato per eseguire le operazioni automaticamente con le impostazi
Un nuovo Re in città - Indicatore + Gestione ordini (TP1 + TP2 + TP3) + Invio opzionale di segnali Telegram INCLUSO (GRATIS) (SISTEMA COMPLETO DI TRADING e SEGNALI) Il nostro miglior EA per l’Oro: Gold Slayer Questo indicatore include una strategia avanzata, un sistema di trading con gestione ordini personalizzabile e un sistema mean reversion che combina estensioni di envelope, supportato da molteplici filtri intelligenti di conferma come RSI per individuare ingressi di inversione ad alta proba
SuperScalp Pro
Van Minh Nguyen
4.5 (38)
SuperScalp Pro - Professional Multi-Layer Confluence Scalping System SuperScalp Pro è un indicatore di scalping avanzato che potenzia il Supertrend classico con diversi filtri intelligenti di conferma. Aiuta a individuare opportunità di trading Buy/Sell con una maggiore probabilità di successo, riducendo significativamente i falsi segnali. Le frecce Buy e Sell vengono visualizzate chiaramente direttamente sul grafico, insieme ai livelli di Stop Loss e Take Profit basati sull’ATR, calcolati autom
Entry Points Pro vi mostra dove entrare, dove mettere lo stop e con quale lotto operare — prima di piazzare l'ordine. PREZZO Ora 199 USD: 4 copie a questo prezzo, poi 249 USD. Il prezzo finale è di 349 USD. Guadagno facendo trading sui mercati e lo dimostro, quindi non ho bisogno di vendere questo indicatore a tutti. È uno strumento per trader che ragionano con la propria testa, non un pulsante magico. Nessuna rottura, nessun trade. Una freccia grigia è un segnale annullato: il prezzo non ha ro
Zoryk Gold
Reda El Koutbane
4.68 (22)
ZORYK — Sistema avanzato di segnali XAUUSD per MetaTrader 5 Conosci sicuramente questa sensazione. Passi molto tempo ad analizzare l’oro. Aspetti il punto d’ingresso corretto. Finalmente apri l’operazione e il prezzo inizia immediatamente a muoversi contro di te. Chiudi troppo presto, sposti lo Stop Loss o esiti per alcuni secondi. Successivamente il mercato raggiunge esattamente l’obiettivo che avevi previsto inizialmente, ma senza di te nella posizione. Il problema non era sempre la direzione.
M5 Sniper
MeanFX
5 (4)
Porta il tuo vantaggio nel trading sotto i riflettori! M5 Sniper è un nuovo indicatore di MeanFX. Combina segnali di trading precisi con livelli TP/SL adattivi , creando così le migliori operazioni statistiche possibili! Il prezzo aumenta ogni 5 acquisti, il prossimo prezzo è di 69$ Scrivimi dopo l'acquisto per ricevere consigli/guida e un EA bonus Cosa lo rende diverso? Performance statistica comprovata su Gold XAUUSD ( funziona su quasi ogni asset , concentrandosi sulla padronanza di un singol
SMC Intraday Formula
VividMind Digital Solutions
5 (26)
Cominciamo con la verità. Nessun indicatore da solo ti renderà profittevole. Se qualcuno ti dice il contrario, ti sta vendendo un sogno. Qualsiasi indicatore che mostra frecce perfette di acquisto/vendita può essere reso impeccabile — basta ingrandire la giusta sezione della storia e catturare solo i trade vincenti. Noi non lo facciamo.  SMC Intraday Formula è uno strumento. Legge la struttura del mercato per te, identifica le zone a più alta probabilità e ti mostra esattamente come appare la t
Gann Made Easy è un sistema di trading Forex professionale e facile da usare che si basa sui migliori principi del trading utilizzando la teoria di mr. WD Gann. L'indicatore fornisce segnali ACQUISTA e VENDI accurati, inclusi i livelli di Stop Loss e Take Profit. Puoi fare trading anche in movimento utilizzando le notifiche PUSH. CONTATTAMI DOPO L'ACQUISTO PER RICEVERE GRATUITAMENTE LE ISTRUZIONI DI TRADING E OTTIMI INDICATORI EXTRA! Probabilmente hai già sentito parlare molte volte dei metodi d
Ultra Indicator
Ihor Otkydach
5 (1)
ULTRA è un indicatore tecnico che funziona secondo un approccio “tutto in uno”: analizza autonomamente il mercato, genera segnali di trading, visualizza i livelli per l’impostazione degli ordini stop-loss e suggerisce quando chiudere le operazioni per realizzare profitti o ridurre al minimo le perdite. In altre parole, non importa se non sai come analizzare il mercato, determinare i livelli — dove impostare lo stop-loss — o se hai difficoltà con la gestione del capitale. ULTRA farà tutto questo
GoldenX Entry MT5
VividMind Digital Solutions
5 (17)
GoldenX Entry è un indicatore per MT5 con un algoritmo adattivo Smart Entry Trend, un sistema di scoring dei segnali, un rilevatore del regime di mercato e un filtro di volatilità. Ogni segnale include un livello di ingresso calcolato, tre livelli di Take-Profit (TP1, TP2, TP3) e un livello di Stop-Loss. È costruito su più livelli analitici progettati per adattarsi a diverse condizioni di mercato, combinando un sistema analitico multilivello con un ottimizzatore integrato e un sistema di traccia
Currency Strength Wizard   è un indicatore molto potente che ti fornisce una soluzione all-in-one per un trading di successo. L'indicatore calcola la potenza di questa o quella coppia forex utilizzando i dati di tutte le valute su più intervalli di tempo. Questi dati sono rappresentati in una forma di indice di valuta facile da usare e linee elettriche di valuta che puoi utilizzare per vedere il potere di questa o quella valuta. Tutto ciò di cui hai bisogno è collegare l'indicatore al grafico ch
Boba Analysis Suite
Trade Ready Solutions LLC
5 (2)
Boba Analysis Suite Boba Analysis Suite è un indicatore di analisi per MetaTrader 5. Riunisce la struttura del mercato, le zone di prezzo rilevanti e il contesto generale del mercato in un’unica visualizzazione del grafico. Sviluppato sulla base dell’esperienza pratica come trader e formatore di trading, supporta un processo di analisi strutturato: valutare la direzione del mercato, individuare livelli importanti e analizzare congiuntamente più intervalli temporali. Analisi nel contesto del merc
Auto Optimized SpeedAngle è un sistema di vettorizzazione del momento di livello istituzionale che elimina l'overfitting ( curve-fitting ) attraverso l'ottimizzazione continua Walk-Forward (WFO). Invece di affidarsi a input statici che si degradano quando i regimi di mercato cambiano, l'indicatore recalibra dinamicamente i suoi parametri utilizzando la validazione Out-of-Sample (OOS), assicurando che i segnali visualizzati rappresentino reali vantaggi statistici anziché anomalie storiche. Quadro
Gold Trend Coach MT5
Cristhian Alexander Gaibor Cuasquer
4.27 (11)
Segnali di acquisto e vendita senza repaint sull'oro (XAUUSD) per MetaTrader 5. Ogni segnale arriva con stop loss e tre take profit. Un filtro Smart Money Concepts con BOS e CHoCH, così operi a favore della struttura, non contro. Un Mentor live sul pannello che ti guida passo dopo passo dall'ingresso fino al TP3. E alert direttamente sul tuo telefono e sul tuo canale Telegram. Questo è Gold Trend Coach. Mai più da solo davanti al grafico. KIT ACQUIRENTE GRATIS con il tuo acquisto: 1. Telegram A
Indicatore multi-valuta di forza e momentum MT5 Dynamic Forex28 Navigator è l'evoluzione dei nostri indicatori popolari da lunga data, che riunisce la potenza di cinque in uno: Advanced Currency Strength28 Indicator (700 recensioni) Advanced Currency IMPULSE with ALERT (530 recensioni) Currency Strength EXOTICS GOLD Impulse with Alert CS28 Combo Signals (bonus attuale) Non serve acquistare quattro indicatori e impilarli sui grafici. Tutto è riunito in un solo indicatore potente: la forza delle 2
M1 Sniper MT5
Oleg Rodin
5 (7)
M1 SNIPER   è un sistema di indicatori di trading facile da usare. Si tratta di un indicatore a freccia progettato per l'intervallo temporale M1. L'indicatore può essere utilizzato come sistema autonomo per lo scalping sull'intervallo temporale M1 e come parte del tuo sistema di trading esistente. Sebbene questo sistema di trading sia stato progettato specificamente per il trading sull'intervallo temporale M1, può comunque essere utilizzato anche con altri intervalli temporali. Inizialmente ho p
Atomic Analyst MT5
Issam Kassas
4.52 (66)
Atomic Analyst — MetaTrader 5 Dopo l'acquisto, inviami un messaggio su MQL5 per ricevere GRATUITAMENTE Smart Universal Expert Advisor, insieme al corso online, al manuale PDF e all'accesso al gruppo privato. Atomic Analyst riunisce l’azione del prezzo, la direzione del trend, i segnali di entrata e uscita, lo Stop Loss e diversi livelli di Take Profit direttamente sul grafico. INDIVIDUA IL SEGNALE. COMPRENDI IL CONTESTO OPERATIVO. Atomic Analyst organizza la sua analisi in informazioni visive ch
Unix Scalper
Issam Kassas
4 (4)
Unix Scalper — MetaTrader 5 Dopo l'acquisto, inviami un messaggio su MQL5 per ricevere GRATUITAMENTE Smart Universal Expert Advisor, insieme al corso online, al manuale PDF e all'accesso al gruppo privato. Individua il setup. Esamina il piano. Scegli come operare. UNIX Scalper riunisce analisi di mercato, indicazioni BUY/SELL/WAIT e livelli Entry, Stop Loss, TP1 e TP2 in un unico pannello organizzato. VISUALIZZA IL SEGNALE E IL PIANO • Indicazioni chiare: BUY, SELL o WAIT. • Livelli definiti: E
Smc Pro ToolKit
Talal N Z Aljarusha
5 (13)
SMC PRO TOOLKIT — SMART MONEY ANALYSIS & STRUCTURED TRADE PLANNING SMC Pro ToolKit is a professional Smart Money Concepts analysis workspace for MetaTrader 5. It combines market structure, multi-timeframe analysis, institutional price zones, setup evaluation, confirmation tools, volume context, alerts, and risk planning inside one organized chart environment. One workspace. Multiple layers of confirmation. One structured trading plan. OPEN COMPLETE USER GUIDE MULTI-CONDITION SETUP ENGINE At
FX Power MT5 NG
Daniel Stein
5 (33)
FX Power: Analizza la Forza delle Valute per Decisioni di Trading Più Intelligenti Panoramica FX Power è lo strumento essenziale per comprendere la reale forza delle principali valute e dell'oro in qualsiasi condizione di mercato. Identificando le valute forti da comprare e quelle deboli da vendere, FX Power semplifica le decisioni di trading e rivela opportunità ad alta probabilità. Che tu segua le tendenze o anticipi inversioni utilizzando valori estremi di Delta, questo strumento si adatta
Azimuth Pro
Ottaviano De Cicco
5 (7)
Azimuth Pro V2: Synthetic Fractal Structure and Confirmed Entries for MT5 Overview Azimuth Pro is a multi-level swing structure indicator by Merkava Labs . Four nested swing layers, swing-anchored VWAP, ABC pattern detection, three-timeframe structural filtering, and closed-bar confirmed entries — one chart, one workflow from micro-swings to macro-cycles. This is not a blind signal product. It is a structure-first workflow for traders who care about location, context, and timing. 1. What Change
Prossimo aggiornamento — Versione 2.52 in arrivo! [NOVITÀ] Preparati a 4 nuove funzionalità principali progettate per migliorare la tua analisi di mercato e il tuo flusso di lavoro nel trading Portiamo l’analisi di mercato a un livello superiore con 4 nuove funzionalità progettate per soddisfare le tue esigenze di trading. Ecco le novità: 1. TRADE OVERVIEW DASHBOARD 2. CONFLUENCE AT ZONE 3. STRONG & WEAK HIGH/LOW 4. OTE 1. TRADE OVERVIEW DASHBOARD Una dashboard che ti aiuta a comprendere più fa
Gold Sniper Scalper Pro
Ich Khiem Nguyen
3.9 (10)
Gold Sniper Scalper Pro è un indicatore per MetaTrader 5 costruito specificamente per rilevare pattern di falsa rottura (false breakout) su XAUUSD. Identifica la struttura trappola a 4 barre dove il prezzo supera il confine di un range, attira i trader di rottura e poi inverte — confermando che il movimento era una falsa rottura. L'indicatore valuta ogni setup secondo 17 fattori di qualità, lo elabora attraverso un pipeline di confluenza a 4 livelli, lo verifica contro un motore di consenso di
Naked Forex Tweezer Pro Indicator Tweezer Pro Indicator is a pattern recognition indicator for Forex, Stocks, Indices, Futures, Commodities and Cryptos. The standard Tweezer is a two bar pattern. Our enhanced version is a multi-bar pattern. We filter the patterns for you so that you only get the     best and most effective patterns   and ignore the noise. The Tweezer pattern is a simple and effective pattern to trade. The strategy that comes with the Tweezer is based on price action. The Twe
Gold Entry Sniper
Tahir Mehmood
5 (23)
Gold Entry Sniper – Dashboard ATR Multi-Timeframe per Scalping e Swing Trading sull’Oro Gold Entry Sniper è un indicatore avanzato per MetaTrader 5 che offre segnali di acquisto/vendita precisi per XAUUSD e altri strumenti, basato sulla logica ATR Trailing Stop e l' analisi multi-timeframe . Caratteristiche e Vantaggi Analisi Multi-Timeframe – Visualizza trend su M1, M5, M15 in un'unica dashboard. Trailing Stop Basato su ATR – Stop dinamici che si adattano alla volatilità. Dashboard Professional
Power Candles MT5
Daniel Stein
4.58 (12)
Power Candles V3 - Indicatore di forza ad ottimizzazione automatica Power Candles V3 trasforma la forza delle valute e degli strumenti in un piano di trading attuabile su ogni grafico a cui è collegato. Invece di limitarsi a colorare le candele, esegue un'auto-ottimizzazione in tempo reale in background e ti fornisce i migliori valori di Stop Loss, Take Profit e soglia di segnale per il simbolo che hai davanti. Basta un clic per adottarlo nel trading live: i raggi di ingresso, Stop Loss e Take P
Adaptive Price Action Engine Acquista un indicatore, ricevi l'EA gratis Analisi Auto-Ottimizzata del Trend e dei Pattern Candlestick Multi-Timeframe I mercati cambiano continuamente e non tutti i pattern di Price Action hanno lo stesso valore in ogni condizione di mercato. Adaptive Price Action Engine è progettato per adattarsi alle condizioni di mercato in continua evoluzione, combinando struttura del trend, analisi Multi-Timeframe, pattern Candlestick e ottimizzazione statistica in un unico fr
Crystal Heikin Ashi Signals
Muhammad Jawad Shabir
5 (5)
Crystal Heikin Ashi Signals—Professional Trend & Signal Detection Indicator Advanced Heikin Ashi Visualization with Intelligent Signal System for Manual & Automated Trading Final Price: $149 ---------> Price goes up $10 after every 10 sales . Limited slots available — act fast . Overview User Guide PDF Crystal Heikin Ashi Signals is a professional-grade MetaTrader 5 indicator that combines pure Heikin Ashi candle visualization with an advanced momentum-shift detection system. Designed for both m
PZ Swing Trading MT5
PZ TRADING SLU
5 (5)
Protect against whipsaws: revolutionize your swing trading approach Swing Trading is the first indicator designed to detect swings in the direction of the trend and possible reversal swings. It uses the baseline swing trading approach, widely described in trading literature. The indicator studies several price and time vectors to track the aggregate trend direction and detects situations in which the market is oversold or overbought and ready to correct. [ Installation Guide | Update Guide | Tro
Altri dall’autore
Overview MACD Signal with Multi Filters is an advanced technical analysis indicator engineered for MetaTrader 5 (MT5). The software combines the classic Moving Average Convergence Divergence (MACD) oscillator architecture with a modular 14-filter confirmation engine (MultiFilterSuite). It is developed to assist manual traders, quantitative analysts, and algorithmic system developers in identifying momentum shifts, trend continuations, and structural turning points while filtering out sideways ma
Parabolic SAR Multi-Filter System MT5: Algorithmic Trend Reversal Engine 1. PRODUCT OVERVIEW & OPERATIONAL ARCHITECTURE Parabolic SAR Multi-Filter System MT5 is a professional multi-component technical analysis indicator engineered for the MetaTrader 5 terminal. The indicator combines J. Welles Wilder's classic Parabolic Time/Price System with an advanced modular filtering architecture comprising 17 distinct secondary validation engines. The primary objective of this software is to eliminate f
Hull Trend Arrows MT5 with Multi-Filter Suite - Technical Documentation 1. Overview and Analytical Purpose Hull Trend Arrows MT5 with Multi-Filter Suite is an algorithmic technical indicator for MetaTrader 5. It integrates the low-lag calculation engine of the Hull Moving Average (HMA) with fourteen modular confirmation filters to identify directional momentum transitions, calculate inflection points, and display non-repainting entry signals on the chart. Standard moving averages introduce sign
FREE
HA Signal MultiFilter MT5 - Technical Operational Manual & Architecture Guide 1. SYSTEM OVERVIEW & ARCHITECTURAL FOUNDATION HA Signal MultiFilter MT5 is a specialized analytical indicator developed for MetaTrader 5 terminal to identify directional momentum expansions and structural trend continuations[cite: 2]. By synthesizing smoothed Heiken Ashi candlestick price discovery with a modular 15-layer secondary confirmation filter suite, the system extracts high-probability market shifts while fil
FREE
Product Overview: Relative Vigor Index Multi-Filter Technical System The Relative Vigor Index (RVI) Multi-Filter Indicator is a comprehensive technical analysis engine developed for the MetaTrader 5 terminal. Designed to identify cyclical momentum shifts, trend continuations, and structural market turning points, this analytical system couples the classic Relative Vigor Index formula with an advanced multi-layered confirmation matrix consisting of 17 distinct technical filters. Rather than rely
FREE
1. OVERVIEW Harmonic Dashboard is a specialized multi-symbol and multi-timeframe analytical indicator designed for MetaTrader 5 (MT5). The software systematically scans financial instruments across multiple timeframes to identify six classical harmonic chart patterns: Gartley, Bat, Butterfly, Crab, Cypher, and Shark. The application consolidates multi-asset scanner results, trend filter validation metrics, price level projections, and interactive chart navigation controls into a single graphic
Overview The MA Cross Scanner Pro is an advanced, highly optimized multi-symbol and multi-timeframe analytical dashboard engineered specifically for the MetaTrader 5 terminal. Designed for technical analysts, systemic traders, and quantitative researchers, this utility serves as a comprehensive market surveillance engine. Its primary objective is to continuously monitor a customized array of financial instruments across numerous timeframes simultaneously, detecting precise moving average crosso
CCI MultiFilter Overbought Oversold Signal Pro MT5 Technical Specification & Operational Manual  1. Overview and System Identity CCI MultiFilter Overbought Oversold Signal Pro MT5 is an institutional-grade technical analysis indicator engineered natively for MetaTrader 5. Developed for quantitative analysts, systematic manual traders, and multi-asset operators, the system provides an objective algorithmic framework to identify cyclical market extremes, momentum shifts, and structural trend cont
WPR Williams Percent Range All Pair Timeframe Scanner Dashboard Overview WPR Scanner Dashboard Pro is a multi-symbol, multi-timeframe market scanning indicator and visual chart overlay utility built for MetaTrader 4 (MT4). The tool monitors Williams Percent Range (WPR) momentum exhaustion and threshold breakouts across multiple currency pairs, metals, indices, and CFDs simultaneously from a single chart window. In addition to its core WPR detection engine, the indicator incorporates an optiona
WAE Waddah Attar Explosion Multi Pair TimeFrame Scanner 1. Overview - WAE Scanner Dashboard is a technical analysis indicator and multi-symbol, multi-timeframe market scanner built for MetaTrader 4 (MT4). - It automates multi-chart monitoring by scanning volatility-driven momentum breakouts based on the Waddah Attar Explosion (WAE) methodology across multiple currency pairs, crosses, indices, or metals simultaneously. - Candidate signals are processed through a modular 15-filter technical conf
UT Bot Trend Multi Pair Timeframe Scan Dashboard Overview UT Bot Scanner Dashboard is a multi-pair and multi-timeframe technical indicator and market scanner developed natively for MetaTrader 4 (MT4). It continuously monitors selected Forex pairs, precious metals, indices, or active Market Watch symbols across multiple timeframes simultaneously to detect dynamic Average True Range (ATR) volatility trailing stop crossovers. Instead of manually cycling through dozens of individual charts to monit
TDI Traders Dynamic Index RSI Scanner All Pair TF Overview TDI & RSI Dynamic Line Dashboard Scanner is a multi-symbol and multi-timeframe analytical indicator designed for MetaTrader 4. The tool monitors multiple currency pairs, commodities, or indices across selected chart timeframes simultaneously to detect crossover events derived from the Traders Dynamic Index (TDI) and dual Relative Strength Index (RSI) Dynamic Lines. Every detected signal is evaluated against an optional 15-module technica
Stochastic Scanner Dashboard for MetaTrader 4 Stochastic Overbought Oversold Scanner Dashboard All Pair Time frame Overview - Stochastic Scanner Dashboard is a multi-symbol and multi-timeframe technical analysis indicator and market scanner built for MetaTrader 4 (MT4). - The tool continuously monitors user-defined currency pairs, metals, or Market Watch symbols across multiple timeframes from one chart. - It detects momentum shifts using configurable Stochastic Oscillator strategies and valida
SSL Channel Trend Scanner Dashboard Multi Pair Multi TimeFrame Overview SSL Channel Multi-Filter Dashboard is a technical analysis indicator and multi-symbol, multi-timeframe market scanner built for MetaTrader 4. It continuously monitors multiple currency pairs, commodities, or other broker instruments across user-selected timeframes to detect directional channel crossovers confirmed by an optional 15-module technical filter suite. Validated signals are organized in an interactive on-chart dash
Relative Vigor Index RVI All Pair and Timeframe Scanner Dashboard Overview RVI Scanner Dashboard is a multi-pair and multi-timeframe technical indicator and interactive scanner panel for MetaTrader 4 (MT4). Built around the Relative Vigor Index (RVI) oscillator, it continuously monitors multiple currency pairs, commodities, or indices across selected timeframes from one chart window. The tool detects directional momentum crossovers, validates setups through an optional 15-module technical conf
RSI Parabolic Overbought Oversold Multi pair Timeframe Scanner 1. Overview - RSI Parabolic Scanner Dashboard is a multi-symbol, multi-timeframe technical analysis indicator and real-time market scanner engineered for MetaTrader 4 (MT4). - It continuously monitors user-defined currency pairs, metals, or visible Market Watch instruments across multiple chart timeframes to identify momentum reversals and overbought or oversold market conditions. - The indicator combines two selectable RSI-based si
RSI Divergence Multi Pair Timeframe Scan Dashboard Overview - Product Type: Multi-symbol, multi-timeframe technical analysis indicator and interactive market dashboard scanner for MetaTrader 4 (MT4). - Core Purpose: Continuously monitors configured currency pairs, precious metals, indices, or active Market Watch symbols across multiple chart timeframes simultaneously to identify Regular and Hidden Relative Strength Index (RSI) divergence setups in one unified terminal window. - Structured Trade
Overview - Product Identity: Pola MultiCandle Scanner Dashboard is a multi-pair and multi-timeframe technical analysis indicator and market scanner developed for MetaTrader 4 (MT4). - Core Purpose: Continuously monitors user-defined currency pairs, precious metals, or Market Watch instruments across multiple timeframes to detect structured multi-candle price action formations, validate setups through a modular 15-indicator confluence suite, calculate volatility-adjusted Stop Loss (SL) and dual
MACD Signal Trend Cross Scanner All Pair Dashboard Overview MACD Scanner Dashboard is a technical analysis utility and multi-symbol, multi-timeframe dashboard indicator designed for MetaTrader 4[cite: 1]. Its primary objective is to monitor MACD crossover events across multiple currency pairs and chart timeframes simultaneously from a single active chart window[cite: 1]. Instead of manually switching between dozens of charts, traders can observe real-time market momentum, directional bias, calc
MA Moving Average Cross Scanner All Pair Timeframe Dashboard Overview MA Cross Scanner is an analytical multi-symbol and multi-timeframe technical indicator equipped with an interactive on-chart dashboard panel for MetaTrader 4[cite: 1]. The tool is engineered to monitor Moving Average (MA) crossover events across multiple currency pairs and timeframes simultaneously, consolidating signal detection, modular trend/momentum filtering, and Average True Range (ATR) risk-reward level calculations in
Ichimoku Tenkan Kijun Cross Scanner All Pair TimeFrame Overview TK Cross Scanner Dashboard is a technical analysis indicator and multi-asset market scanner engineered for the MetaTrader 4 platform. The utility monitors multiple currency pairs, commodities, and timeframes simultaneously to detect Ichimoku Tenkan-sen and Kijun-sen crossovers (TK Cross). In addition to automated signal scanning, the software calculates dynamic Stop Loss (SL) and dual Take Profit (TP1 and TP2) reference levels usin
Ichimoku Senkou Span B Scanner All Pair Timeframe Overview Senkou Span B Scanner Dashboard MT4 is a technical analysis indicator and multi-asset market scanner designed for MetaTrader 4. The tool monitors multiple currency pairs, commodities, and timeframes simultaneously from a single chart window to detect price interactions with the Ichimoku Kinko Hyo Senkou Span B boundary. In addition to scanning for signal candidates, the indicator integrates a 15-module secondary confirmation suite, calc
Heiken Ashi Multi Currency Pair Time Frame Scan Dashboard Overview Heiken Ashi Multi Timeframe Scanner Dashboard is a technical analysis utility and multi-symbol, multi-timeframe market scanner developed for the MetaTrader 4 platform. The tool is designed to monitor multiple currency pairs, commodities, or indices simultaneously from a single chart window. Instead of manually switching between dozens of charts and timeframes to inspect Heiken Ashi candle formations, traders can view active dire
Pro Harmonic Pattern Scanner All Pair Time Frame Dashboard Harmonic Pattern Scanner Dashboard MT4 is an analytical multi-symbol and multi-timeframe technical indicator designed for MetaTrader 4. It automatically scans price action across selected currency pairs, metals, or Market Watch instruments to identify classic XABCD harmonic structures, calculate Fibonacci-based entry, Stop Loss, and Take Profit zones, and validate setups through an integrated modular trend and momentum filter suite. Op
Fractal Breakout Scanner Multi Pair Timeframe Dashboard Overview Fractal Breakout Scanner Dashboard is a technical analysis indicator and multi-symbol, multi-timeframe scanning utility designed for MetaTrader 4. The tool monitors multiple currency pairs, commodities, and indices simultaneously to detect price breakouts beyond confirmed Bill Williams Fractal swing highs and swing lows. Rather than requiring manual chart switching across dozens of instruments, the indicator aggregates real-time b
Institutional Candle Price Engulfing Scan All Pair Timeframe Engulfing Scanner Dashboard is a technical analysis utility and multi-symbol, multi-timeframe candlestick pattern scanner for MetaTrader 4. It detects Bullish Engulfing and Bearish Engulfing setups across multiple currency pairs and timeframes simultaneously, displaying active signals in an interactive on-chart table alongside ATR-based Stop Loss and Take Profit reference levels. 1. Overview and Technical Purpose - Product Category:
Pinbar Marubozu Rejection Candlestick Scanner All Pair Timeframe Overview Candle Pattern Scanner Dashboard is a technical analysis utility and multi-pair, multi-timeframe scanner indicator designed for MetaTrader 4. The indicator continuously monitors multiple currency pairs, commodities, or indices across selected timeframes to detect specific Japanese candlestick price action formations—namely Candle Rejection, Full-Body Marubozu, and Classic Pin Bar structures. When a valid candlestick forma
Chaikin Oscillator Scanner All Pair Timeframe Dashboard Overview Chaikin Oscillator Scanner Dashboard is a technical analysis utility and multi-symbol, multi-timeframe market scanner designed for MetaTrader 4 (MT4)[cite: 1]. The indicator monitors multiple currency pairs, commodities, or indices simultaneously across selected chart timeframes to identify Chaikin Oscillator zero-line crossover events[cite: 1]. Detected setups are presented in an interactive on-chart table complete with automated
CCI Signal Trend Overbought Oversold Scanner All Pair TimeFrame Dashboard CCI Multi Timeframe Scanner Dashboard is a technical analysis utility and multi-symbol market scanner developed for MetaTrader 4. The indicator monitors multiple currency pairs and timeframes simultaneously using Commodity Channel Index (CCI) calculations combined with an optional multi-indicator confirmation suite and Average True Range (ATR) volatility projections. 1. Operating Principle and Signal Validity - Core Cal
BB Bollinger Bands Breakout Scanner All Pair Time Frame Bollinger Bands Breakout Scanner Dashboard is a technical analysis utility and multi-symbol, multi-timeframe market scanner engineered for MetaTrader 4 (MT4). The software continuously monitors multiple currency pairs, commodities, or indices across user-defined timeframes to detect confirmed Bollinger Bands breakout setups. Every detected signal is evaluated through an optional modular confirmation suite and automatically paired with vola
Filtro:
Nessuna recensione
Rispondi alla recensione