Gold Flow Seconds Chart
- Utilità
- Versione: 1.0
- Attivazioni: 10

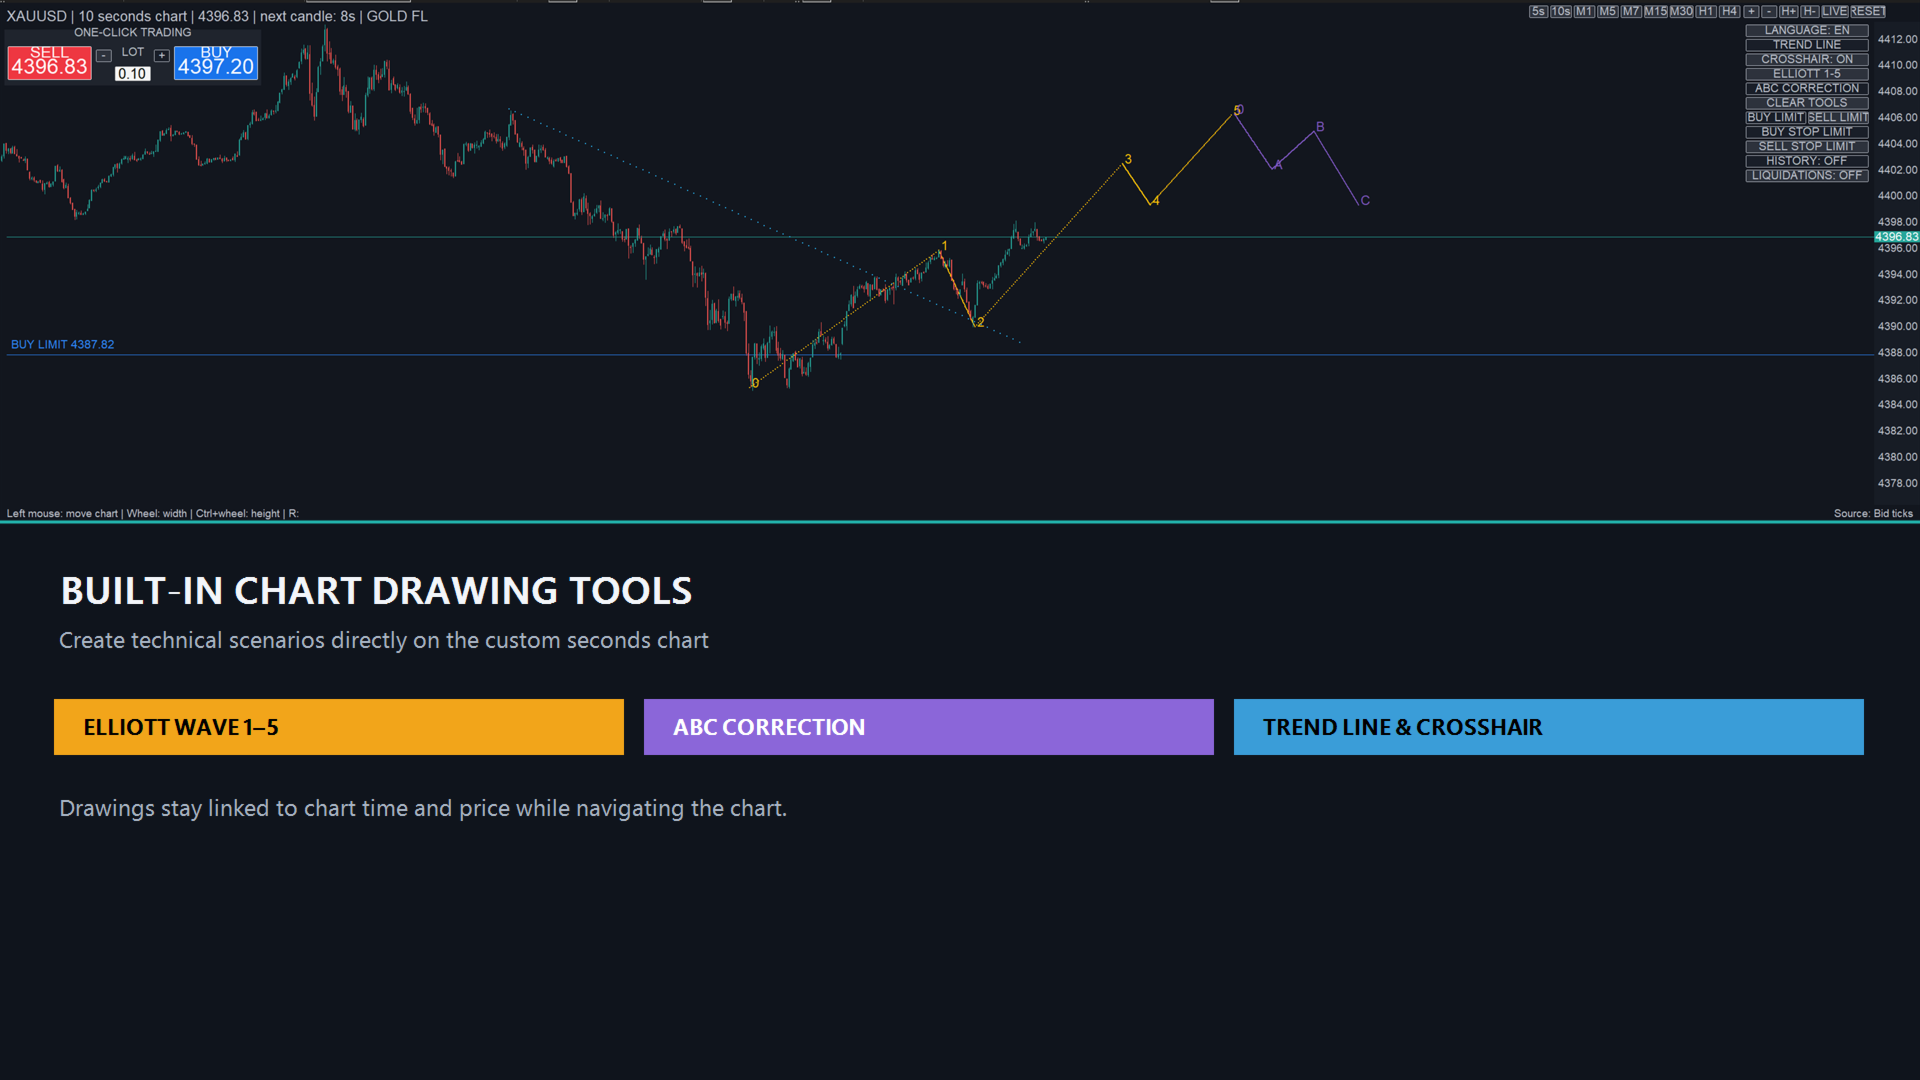
Gold Flow Seconds Chart transforms MetaTrader 5 into a fast and convenient workspace for manual trading.
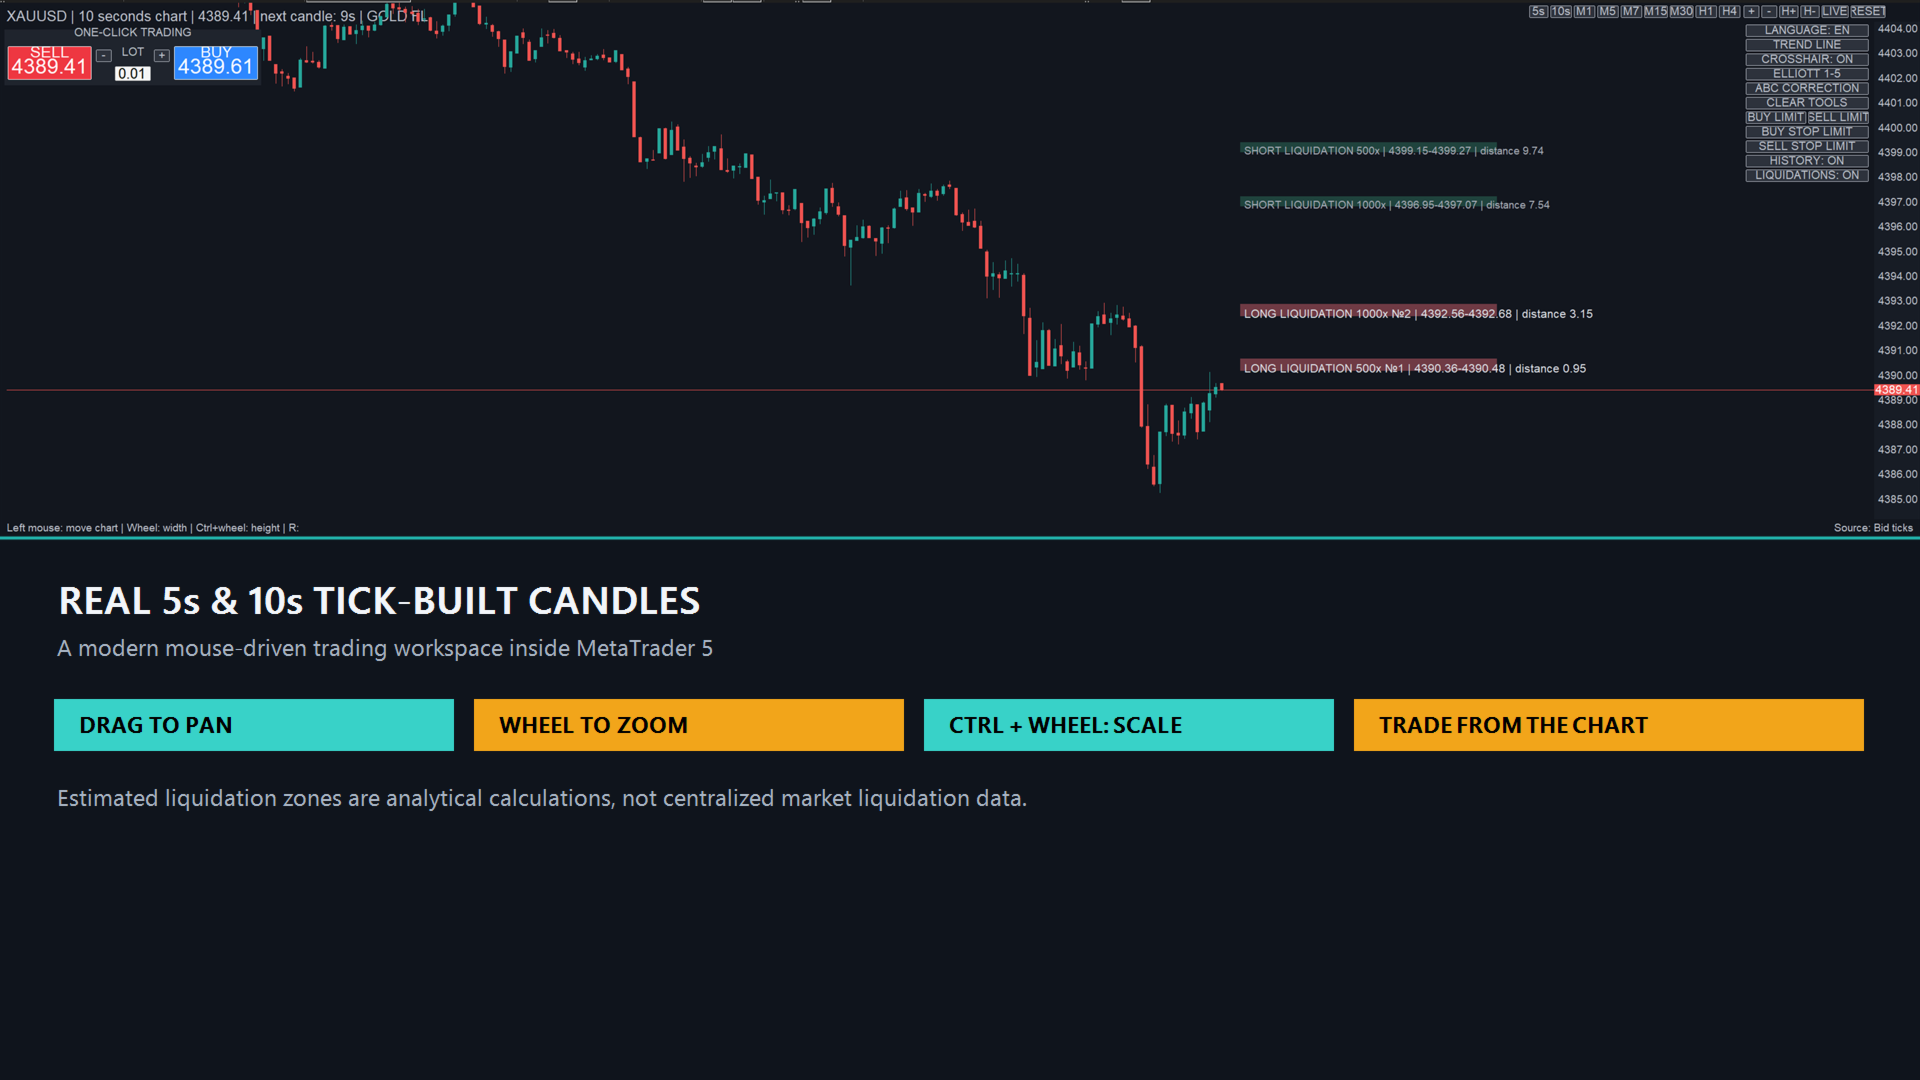
The utility builds 5-second and 10-second candles from the tick data provided by your broker. M1, M5, M7, M15, M30, H1 and H4 views are also available in the same interface.
MOUSE-DRIVEN CHART NAVIGATION
• Drag the chart horizontally and vertically with the left mouse button.
• Use the mouse wheel to change candle width.
• Use Ctrl + mouse wheel to adjust the vertical scale.
• Return to the latest market price with the LIVE button.
TRADING FROM THE CHART
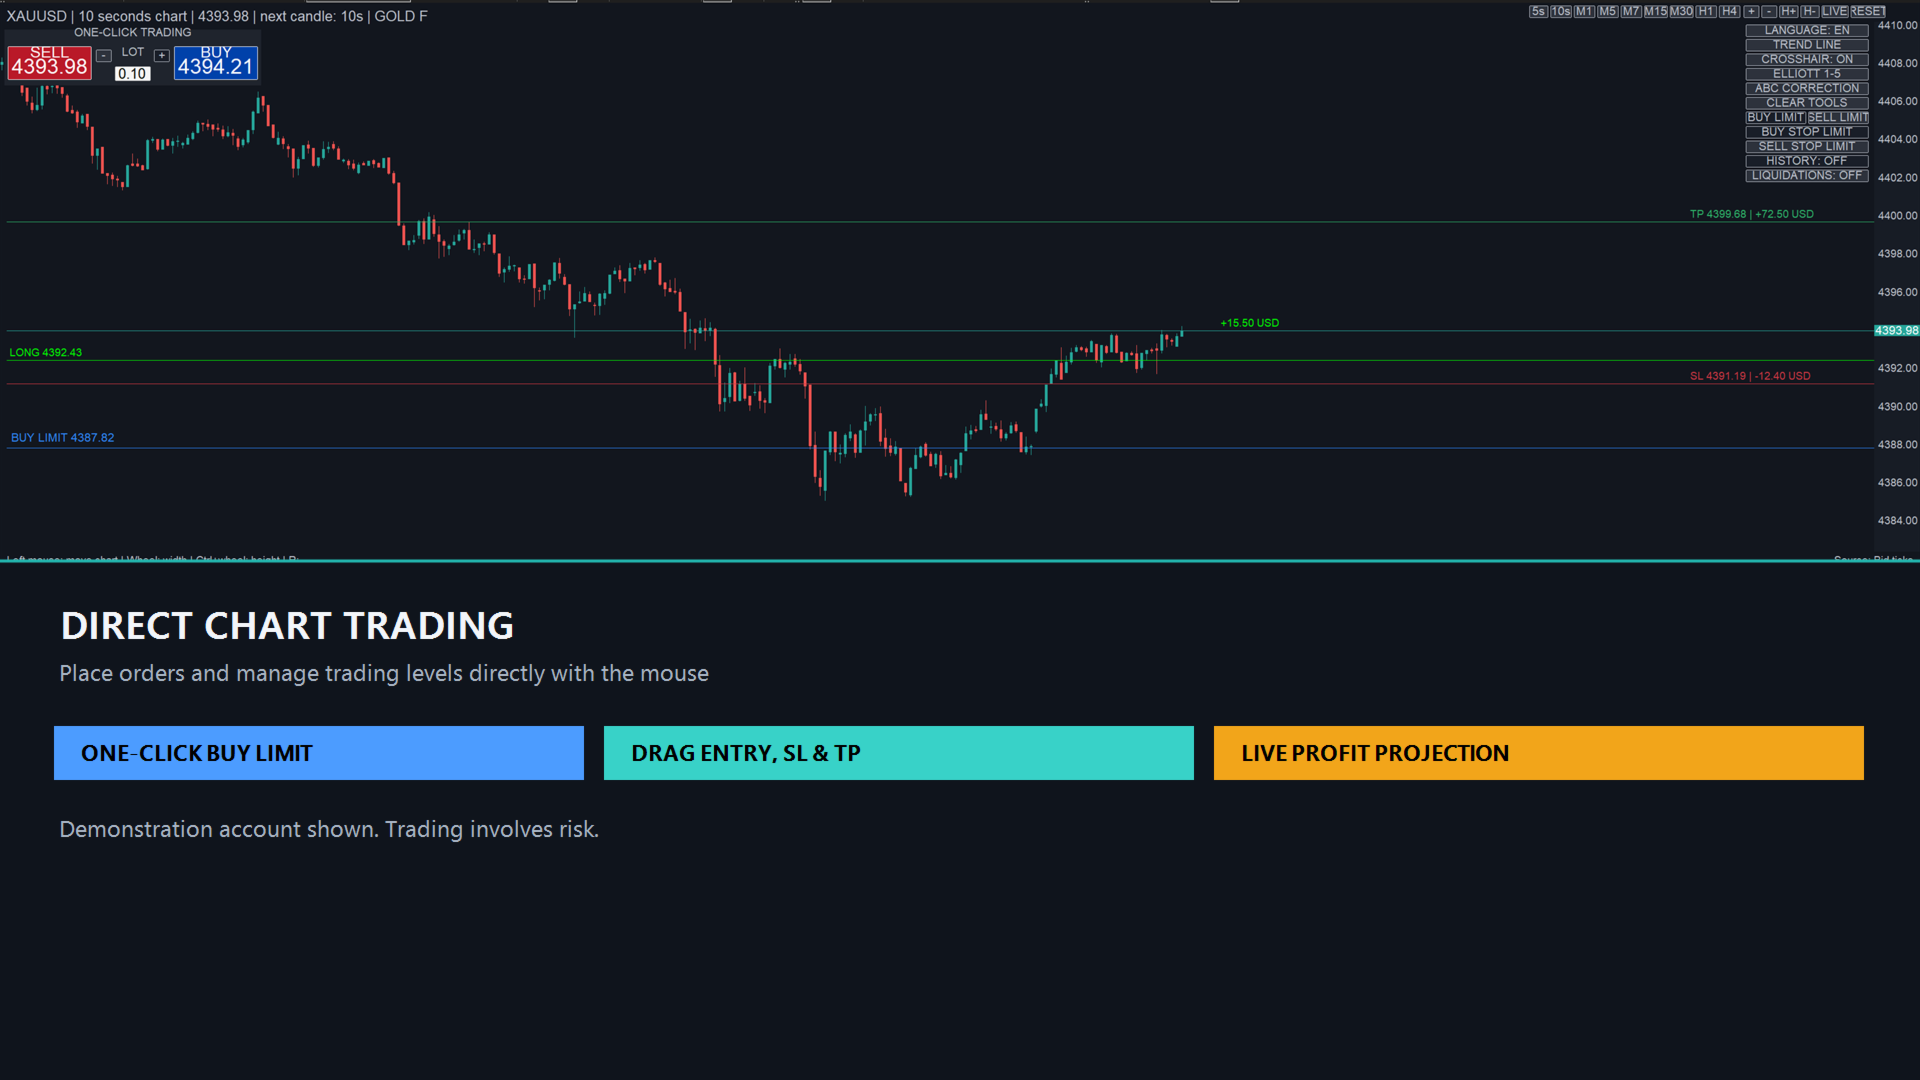
• Market Buy and Sell panel.
• Place Buy Limit and Sell Limit orders with one click at the selected chart price.
• Buy Stop Limit and Sell Stop Limit tools.
• Drag pending orders, entry levels, Stop Loss and Take Profit with the mouse.
• Display estimated profit near Take Profit levels.
• Adjustable lot size and allowed slippage.
ANALYSIS TOOLS
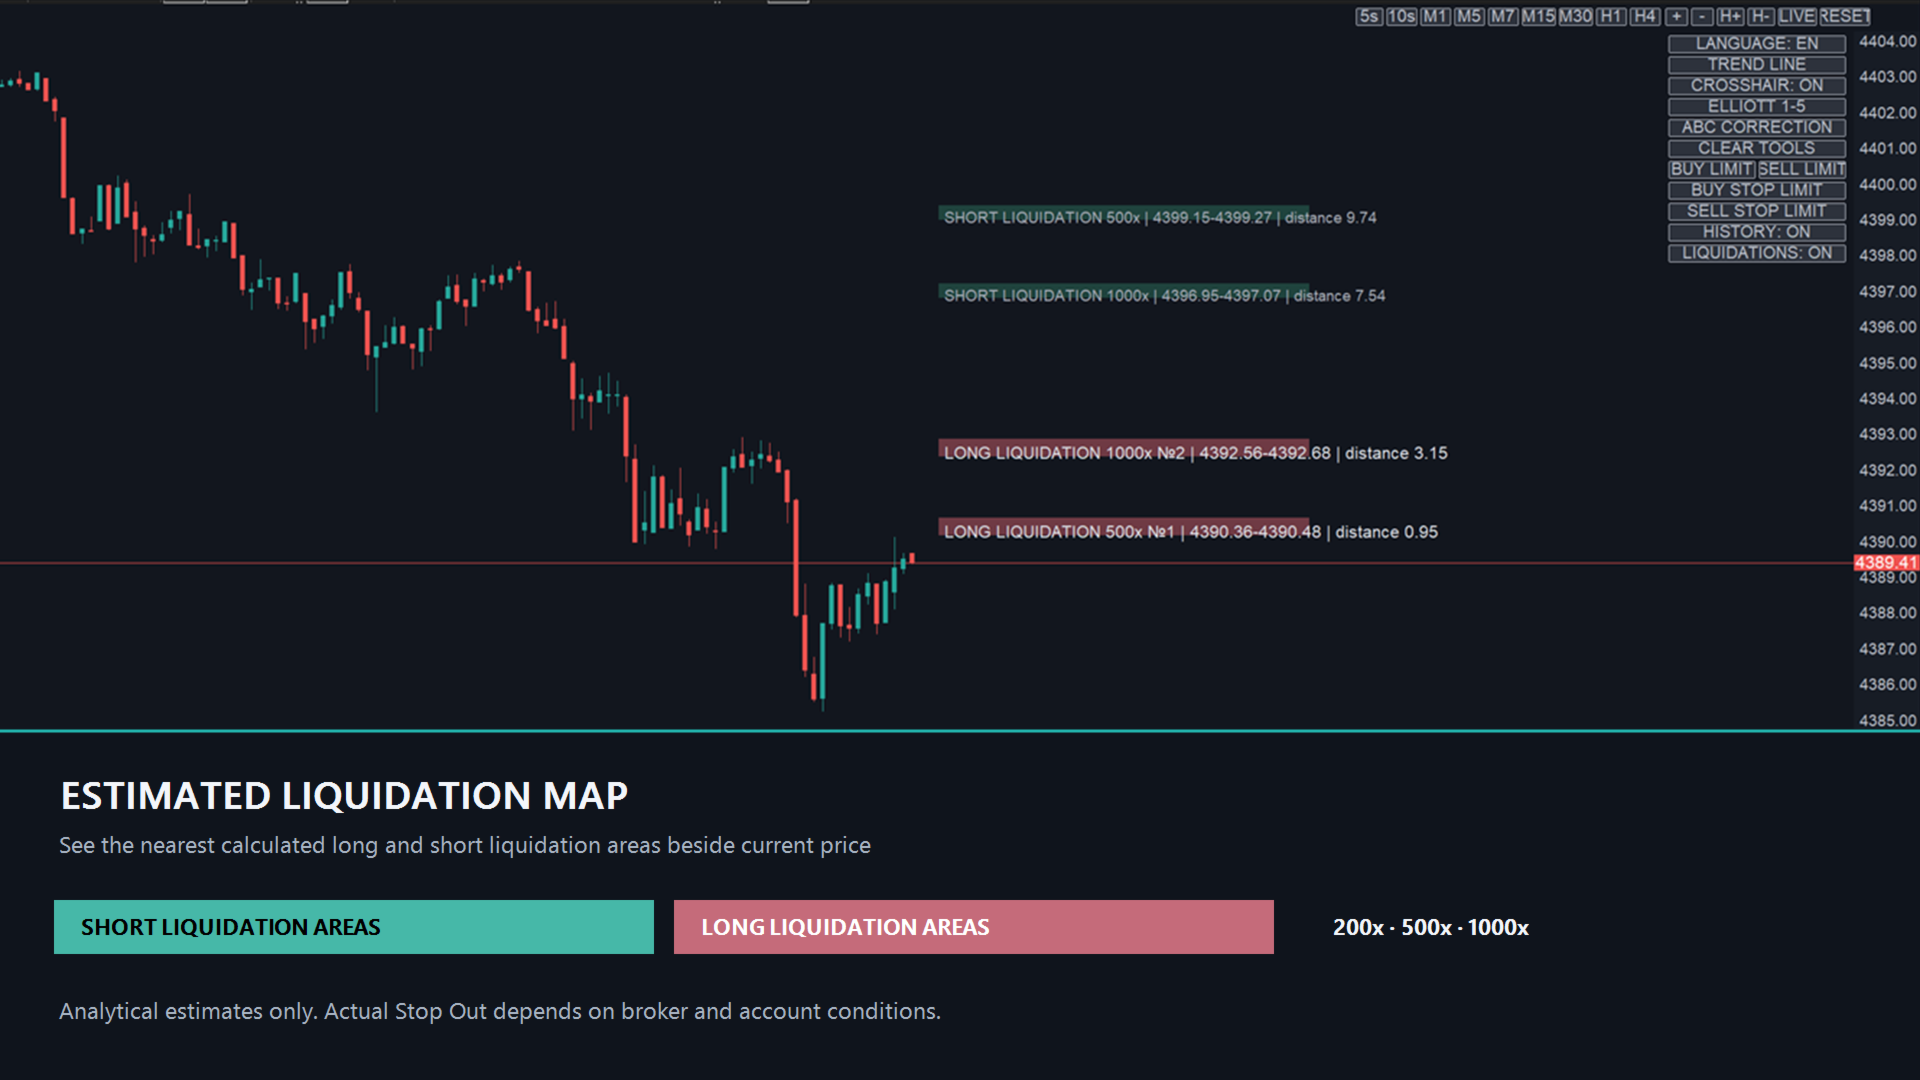
• Estimated long and short liquidation zones for multiple leverage levels.
• The three nearest liquidation areas are highlighted on the chart.
• Elliott Wave 1–5 and ABC correction drawing tools.
• Trend lines, crosshair and trade-history markers.
INTERFACE LANGUAGES
• English is enabled by default.
• Russian can be selected directly from the chart panel.
INSTALLATION AND TRADING PERMISSION
• Attach the utility to the required chart.
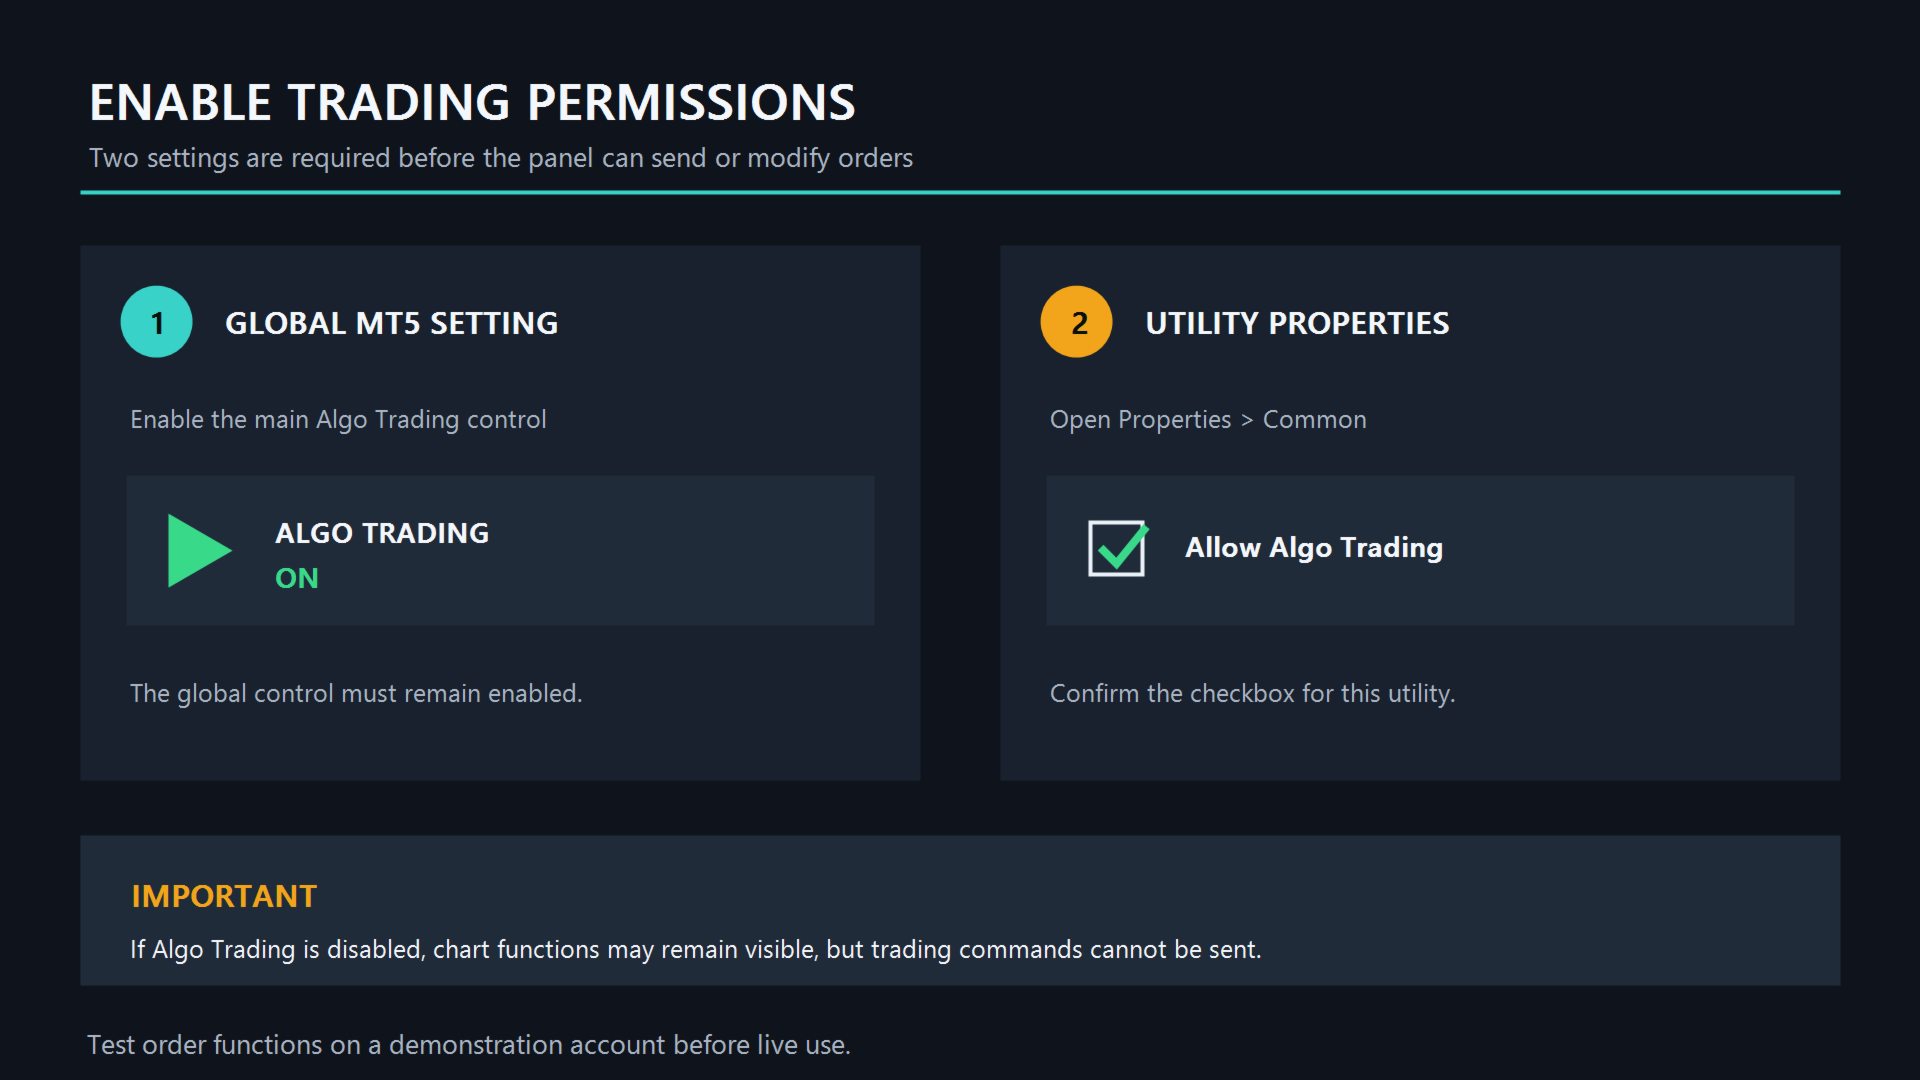
• Enable the global Algo Trading button in MetaTrader 5.
• In the utility properties, open the Common tab and enable Allow Algo Trading.
• Confirm that Algo Trading remains enabled whenever you want to place or modify orders from the panel.
• If Algo Trading is disabled, the chart and analysis functions can remain visible, but trading commands cannot be sent.
IMPORTANT INFORMATION
The depth and quality of the 5-second and 10-second history depend on the tick data available from your broker.
Liquidation zones are analytical estimates. Forex and CFD markets do not provide a centralized database containing the liquidation prices of all market participants. Actual Stop Out levels depend on the broker, account leverage, balance, open positions and margin requirements.
Gold Flow Seconds Chart is a manual trading and analysis utility. It does not guarantee trading results. Test all functions on a demo account before using them in live trading.