Takumi
- Experts
- Versione: 1.17
- Attivazioni: 10

Welcome to Takumi — a EURUSD system built on the same principle as the rest of the range: that a trading system should be able to survive being checked.
匠 Takumi is the Japanese word for a master craftsman. Not the fastest hand, but the one who has repeated the work long enough to know exactly when to act and when to leave it alone. Both halves of that matter here. Takumi enters on a measured stretch from the rolling mean, and then it waits — because on EURUSD, waiting is where the money is.
Two thirds of the time the first position is right and closes on target by itself. The other third, a capped averaging ladder does the work. Nothing closes at a loss. That is the whole system, stated plainly.
IMPORTANT: This is a grid system. It averages down and it has no stop-loss. Positions can stay open for days. Read the risk section before you buy. If that is a dealbreaker, we would rather tell you now than after you have paid.
After purchase, send me a private message for the setup manual
Launch pricing - The price rises by $50 with every 10 purchases.
Why Traders Choose Takumi
Most grid systems are sold by hiding what they are. We publish the point where ours breaks — and we tested every way we could think of to make it cleaner, so we can tell you why it looks the way it does.
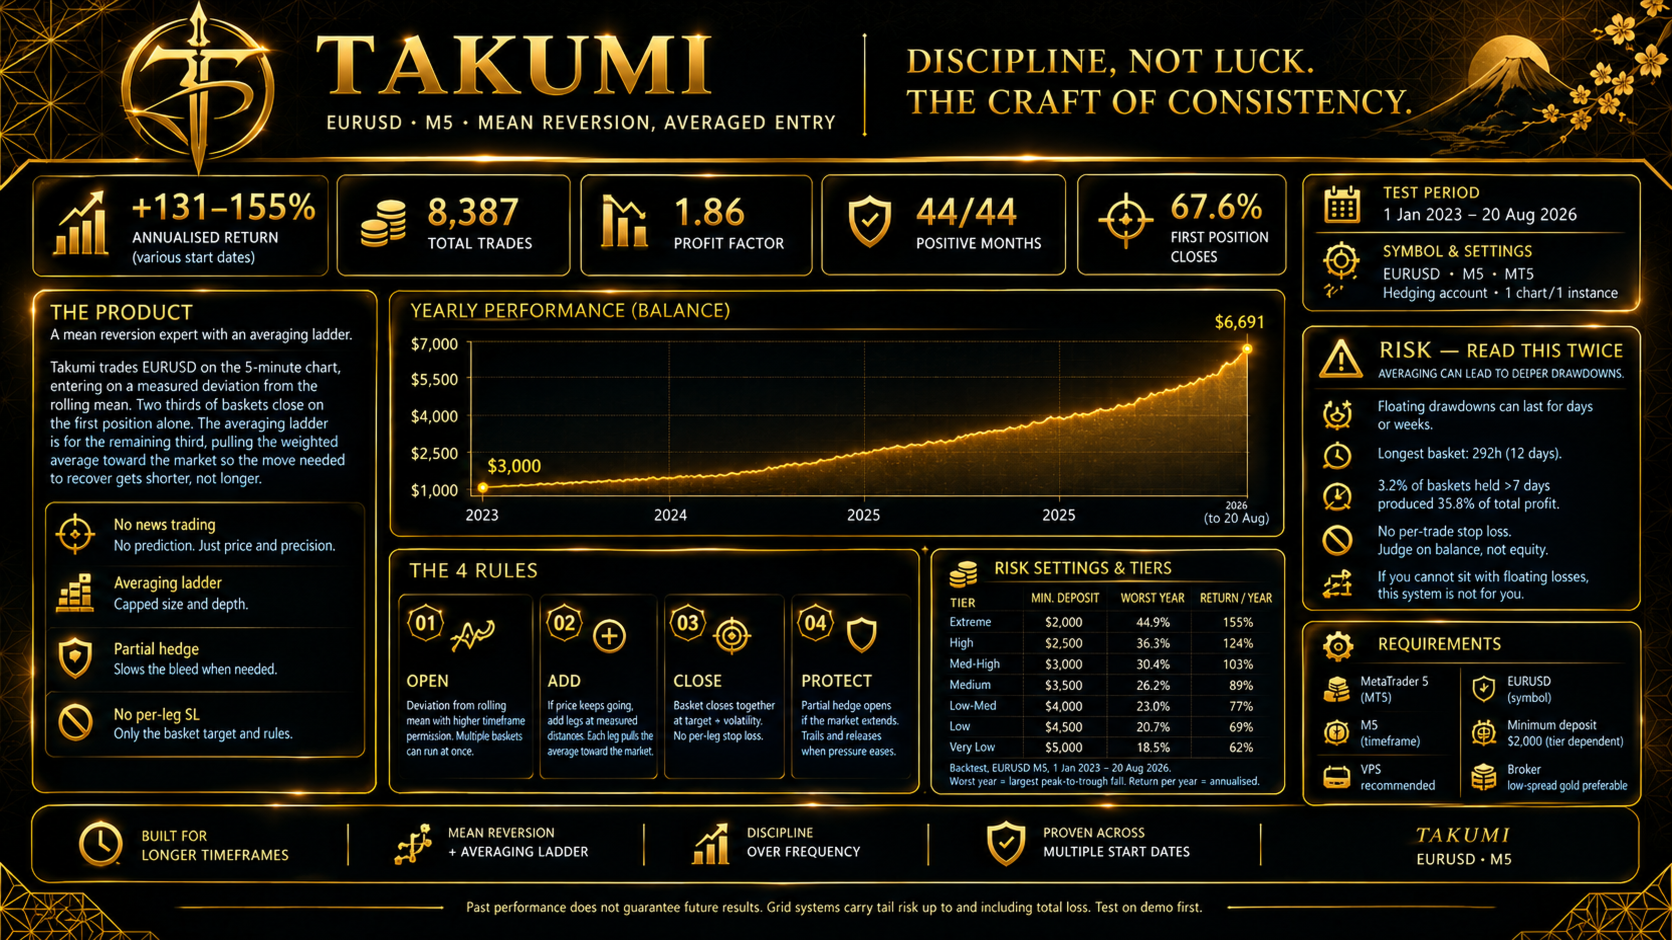
- Three years and eight months on 100% real tick data — 1 Jan 2023 to 20 Aug 2026, not modelled ticks, not "90% quality"
- Every calendar year profitable, including 2025, the weakest year for mean reversion on this pair in the record
- +590% from $2,000 at the Extreme tier, profit factor 1.80, worst equity drawdown 21%
- 9,569 trades — about seven a day, every day, around the clock
- 67.6% of baskets close on the first position alone. Run the same entries in reverse and the system loses money at a profit factor of 0.92 — the direction carries the edge, not the ladder
- Validated from fourteen separate start dates across the span. Every one finished up
- Two inputs control everything: your risk tier and your deposit. There is nothing else to set
- Reproducible on your own terminal in ten minutes, free, before you spend anything
Takumi is not selective in the way Kumiko is. It runs all day, every session, and it will hold a position through a weekend if the target has not come. That is not a flaw to be tuned out. We tuned it out nine different ways and every one of them made the system worse.
How Takumi Works
One strategy, running 24 hours, in three parts.
1. OPEN — When price stretches far enough from its rolling mean on M5, Takumi opens a small position in the direction of the expected return. Up to three baskets can run per side, each in its own slot with its own target. A trend filter on H1 refuses entries when the market is running rather than stretching.
2. CLOSE — Most of the time the stretch reverts and the basket closes on target. In testing, the median basket closed in a little over four hours and two thirds never needed a second position. The target is measured from the basket's weighted average and scaled to volatility, and the basket must be net positive after costs before it goes.
3. RECOVER — Sometimes price keeps going. Takumi adds legs at measured distances, each pulling the basket's average toward the market so the move needed to recover gets shorter, not longer. Leg size and depth are both capped. If a basket gets deep and the market keeps extending, a partial hedge opens to slow the bleed until the pressure comes off. When the combined basket reaches its target, everything closes together.
Open. Close or recover. Reset. Around the clock.
The Record
$2,000 · Extreme tier · 100% real ticks
One continuous run, 1 Jan 2023 to 20 Aug 2026: $2,000 to $13,810. Net +$11,810. Profit factor 1.80. 9,569 trades. Worst equity drawdown 21.2%. Margin level never below 1,000%.
Fourteen start dates across the period, from 2023 through 2026 — every one profitable, so the result does not depend on a lucky entry point.
One caveat we will state plainly: this backtest is in-sample. The settings were selected using this same data. Every vendor showing you a backtest is showing you a period they chose the settings on, whether they say so or not. Read these figures as evidence the risk is quantified — not as a forecast. A live account has been running alongside since launch; ask and we will show you the record.
Risk — Read This Twice
This is a grid with a multiplying ladder and no stop-loss. Losing positions are held and added to until they recover.
- Floating drawdowns run deep. Your equity will sit below your balance most of the time, sometimes far below, before a basket closes. Judge the account on balance. The gap is the cost of holding, not a realised loss — unless you close a basket by hand, which is the one thing that turns it into one.
- Baskets can stay open for weeks. Median holding time is four hours, but the longest single basket in the record ran 953 hours — forty days — before closing in profit. A basket sitting open is the system working, not the system stuck.
- Baskets stack. You will sometimes see three positions on the same side within a few pips of each other. Each has its own target and closes on its own. This looks untidy and it is load-bearing: removing it cost between 6% and 58% of net in every test we ran.
- Not suitable for prop-firm accounts with daily drawdown rules.
What the EA does give you: a capped ladder, a hard depth limit, an H1 trend filter on entries and on adds, a hedge overlay for deep baskets, restart adoption that picks up open baskets after any reboot, and an on-chart panel that prints the exact price every basket is waiting for — so you are never guessing why something is still open.
Only trade with money you can afford to lose entirely.
🖥️ Minimum Requirements & Recommendations
Symbol EURUSD, timeframe M5. One chart, one instance
Account type: Hedging — the EA will not start on netting
Leverage 1:500 or higher. EU retail accounts at 1:30 are not sufficient
Minimum deposit $2,000 (Extreme) to $5,000 (Very Low, the shipped default)
Low-spread account. If your broker bills commission, enter it in the one broker input so the exit gate knows the true cost
VPS mandatory — it trades around the clock and manages positions continuously
The tier does not change the strategy. It changes how much capital stands behind each position. A gentler tier does not make the system safer; it makes the same swing easier to sit through. Choose by the drawdown you can watch without interfering, not by the return you would like.
Before You Buy — Test It Yourself
That is not a courtesy line. It is the entire pitch.
1. Download the free demo from this page
2. Open the Strategy Tester (Ctrl+R) — EURUSD, M5, Every tick based on real ticks
3. Confirm the report says 100% history quality, set your deposit and tier, and run any span you like
4. Reproduce the figures above. Or disprove them
The results on your screen come from your terminal, not from our claims. Then run it on demo for as long as you need. The engine behaves identically whether the money is real or not.
Built for traders who would rather be told the truth than sold a dream.
DISCLAIMER
Trading leveraged products carries a high level of risk and can result in the loss of all capital. Past performance does not guarantee future results. Takumi is an automated trading tool, not a managed service and not financial advice.
Takumi uses a grid with a multiplying position ladder and no stop-loss. Losing positions are held and added to until they recover. A sustained directional move that does not retrace can cause loss of the entire account balance. Grid systems carry tail risk up to and including total loss.
All performance figures shown are from historical simulation on StarTrader EURUSD M5 data using real-tick modelling. The parameters were selected using that same data, so those results are in-sample and are not out-of-sample validation. Results on a different broker, spread model or period will differ. Drawdown figures describe the deepest decline recorded in the stated period; they are not a limit and actual drawdown may exceed them. Risk-tier figures are measured on separate tier runs on the same data.
Test on a demo account before trading live and trade only with capital you can afford to risk.