Oracle Trading ElliottWave

Oracle Trading Elliott Wave Balan — Indicatore di analisi delle onde di Elliott con conferme multiple

Basta indovinare in quale onda si trova il mercato. Vedetelo voi stessi.

Oracle Trading Elliott Wave Balan è un motore completo di analisi delle onde per MetaTrader 5, costruito sulle regole classiche della teoria di Elliott (secondo il libro di Balan) e arricchito da undici livelli indipendenti di conferma — dalla divergenza RSI ai Order Block istituzionali e Fair Value Gap.

L’indicatore disegna in tempo reale la struttura completa delle onde direttamente sul grafico: impulsi, correzioni, triangoli diagonali e griglia di Fibonacci — il tutto con il proprio score e le relative etichette, in modo che possiate vedere immediatamente quanto sia realmente solido il setup individuato.

Si tratta di uno strumento di analisi puro. Non apre operazioni, non tocca il vostro conto e non richiede autorizzazioni di trading: basta trascinarlo sul grafico e leggere il mercato.

Cosa calcola realmente l’indicatore

La maggior parte degli «indicatori Elliott» si ferma a un semplice zigzag di 5 onde. Questo va molto oltre:

  • Tre gradi di onde sovrapposte analizzati contemporaneamente — l’onda principale, la sotto-onda e la micro-onda. Ognuna viene analizzata in modo indipendente con la propria sensibilità e il proprio score di confluenza. Se la struttura superiore è «sporca», l’indicatore verifica automaticamente se all’interno si sta formando una struttura più pulita, anche se più piccola.
  • Regole complete dell’impulso — l’onda 2 non supera mai l’inizio dell’onda 1, l’onda 3 non è mai la più corta, la regola classica di non sovrapposizione per l’onda 4 — tutto viene verificato esattamente come descritto da Elliott (e da Balan).
  • Estensione di QUALSIASI onda motrice — non solo dell’onda 3. Il motore confronta le onde 1, 3 e 5 tra loro e determina correttamente quale di esse sia realmente estesa.
  • Troncatura dell’onda 5 («fallimento») — segnalata automaticamente quando l’onda 5 non rinnova l’estremo dell’onda 3 — classico segnale di un imminente inversione.
  • Regola di alternanza — le onde 2 e 4 vengono confrontate sia in profondità di ritracciamento che in durata, quindi un’onda 2 rapida e ripida associata a un’onda 4 piatta e laterale (e viceversa) viene riconosciuta correttamente.
  • Triangoli diagonali (iniziali e finali) — quella struttura in cui l’onda 4 è ufficialmente AUTORIZZATA a entrare nell’onda 1. Viene determinata verificando una vera compressione o espansione a cuneo su tutti e cinque i segmenti, e non semplicemente scartata come «non valida».
  • Tutti i principali tipi di correzione — zigzag, piatto, triangolo (convergente/divergente/ascendente/discendente), oltre alle correzioni combinate: doppio zigzag e doppio tre (strutture W-X-Y).
  • Griglia di Fibonacci completa su ogni struttura — i livelli di ritracciamento (dal 23,6% al 100%) e di estensione (dal 127,2% al 261,8%) vengono disegnati automaticamente dall’ultima onda completata, con i prezzi esatti nelle etichette.

Undici livelli di conferma — con score trasparente

Ogni struttura individuata riceve uno score di confluenza aperto, composto da fino a undici segnali indipendenti — non vi affiderete mai al parere di un solo indicatore:

  1. Divergenza RSI — classico segnale di esaurimento dell’onda 5 o dell’onda C
  2. MACD — conferma che l’onda 3 porta realmente l’impulso più forte
  3. Analisi del volume — verifica che l’onda 3 abbia la massima partecipazione, come prevede la teoria
  4. Nuvola Ichimoku — supporto/resistenza dinamico e contesto di trend del timeframe superiore
  5. Bande di Bollinger — evidenzia la compressione che di solito precede l’onda 4 / la rottura del triangolo
  6. Order Block — traccia istituzionale lasciata prima dei forti movimenti impulsivi
  7. Fair Value Gap (FVG) — squilibri di prezzo che il mercato torna spesso a colmare
  8. Liquidity Sweep — spazzata degli stop sopra/sotto i massimi e minimi uguali, particolarmente utile prima del completamento di una diagonale o dell’onda 5
  9. BOS / CHOCH — conferma che la struttura si è realmente rotta nella direzione attesa
  10. Divergenza multi-timeframe — la stessa verifica della divergenza RSI, ma sul timeframe superiore, per conferma tra le scale
  11. Filtro di sessione e regime di volatilità — evidenzia le zone «morte», a bassa volatilità con ADX basso, dove il conteggio delle onde è meno affidabile

Sul grafico — tutto è visibile immediatamente

  • Etichette numerate delle onde (1-2-3-4-5, A-B-C) per ogni grado
  • Canali di trend colorati e livelli di supporto/resistenza
  • Griglia di Fibonacci completa (ritracciamenti ed estensioni) con etichette di prezzo
  • Frecce di segnale che indicano i setup validi con lo score completo
  • Linea diagnostica opzionale sul grafico con lo score attuale di ogni grado — utile per capire perché l’indicatore segna (o non segna) un segnale proprio in quel momento

A chi è adatto

Ai trader che già comprendono la teoria delle onde di Elliott e vogliono un secondo parere disciplinato, basato su regole — un parere che non ignorerà la regola di non sovrapposizione solo perché il grafico «sembra rialzista», e che non chiamerà impulso qualsiasi sequenza di cinque candele consecutive.

L’indicatore è pensato per chi vuole vedere la struttura, valutare personalmente le conferme e prendere le proprie decisioni di trading sulla base di informazioni più complete.

Nota importante

L’indicatore esegue solo analisi e visualizzazione. Non esegue operazioni.

L’analisi delle onde è per natura interpretativa — nessun conteggio delle onde, score o insieme di conferme elimina il rischio di mercato.

Combinate sempre questo strumento con la vostra gestione del rischio e non rischiate mai più di quanto siete disposti a perdere.

Compatibile con qualsiasi strumento e timeframe in MetaTrader 5.

Tutti gli undici livelli di conferma, il motore di sotto-onda/micro-onda e ogni elemento visivo possono essere attivati e disattivati indipendentemente nelle impostazioni.


Prodotti consigliati
Ultimate Double Top & Bottom (Pro Volume Matrix) Stop trading retail breakouts. Start trading Institutional Traps. The   Ultimate Double Top & Bottom   is not a standard, lagging pattern scanner. It is a highly advanced, non-repainting structural engine equipped with a proprietary   3-Leg Volume Matrix . Designed exclusively for Smart Money Concepts (SMC) and order flow traders, this indicator mathematically dissects the tick volume inside M and W patterns to reveal true institutional intent:  
Exit Lab MT5 — EA Exit Comparison Display Compare 5 exit methods of your backtest in one panel. Exit Lab MT5 reads a MetaTrader 5 Strategy Tester HTML report and replays the same trades under 5 exit rules, showing the comparison at the top-left of your chart. How to use (2 steps): Run a backtest in the Strategy Tester and save the HTML report Put the file into MQL5\Files\ExitLabReports\ and drag Exit Lab MT5 onto the chart of the same symbol It then automatically: Scans the folder and picks the
WickExtreme Price Printer — Trade Where Price Tells the Truth Introducing the WickExtreme Price Printer , a precision tool designed for serious traders who believe that price wicks are not noise—they are signals . Built on the timeless principles of Jesse Livermore's price-reading tactics , this indicator reveals real-time market intent by printing key high and low wick prices directly on the chart, with clean, vintage-style visuals. Features: Wick Price Printing : Automatically prints the price
Fabulous Four FAB4 Indicator
Daniel Raimundo De Oliveira
The Exclusivissimo FAB4 (Fabulous Four) Indicator is an institutional-grade chart analysis tool designed for MetaTrader 5. Built for professional traders who demand precision, this indicator automatically maps the most critical liquidity zones and momentum shifts in the market, keeping your chart clean and your entries surgical. Whether you are trading Forex, Indices, or Stocks, the FAB4 Indicator provides a complete institutional roadmap right on your screen, highlighting true market intent wit
ADAPTIVE REGIME DASHBOARD — professional multi-symbol market state scanner with real-time regime alerts. Most indicators answer "buy or sell?". This one answers the two questions professionals ask first: 1) WHAT is this market doing right now? 2) WHICH tactic fits it — and when should I stay out? WHAT YOU SEE (up to 10 symbols on any chart): • Market regime: Bullish / Bearish / Range / Breakout / Volatile / Quiet • Best-fit tactic hint: Trend, Range, Breakout — or an honest WAIT • Volatility
TIF – Trend Integrity Filter Trade With the Trend. Filter the Noise. TIF (Trend Integrity Filter) is a professional trend-analysis indicator designed to help traders identify the dominant market direction and filter out lower-quality trades that go against the prevailing trend. TIF can be used as a standalone trend filter or combined with your existing trading strategy, entry indicator, price action system or Expert Advisor. KEY FEATURES Trend Integrity Analysis Helps identify the cur
An all‑in‑one trading assistant that blends AI candle synthesis with a 15‑pattern Heat Map, ATR‑scaled S/R & pivots, and a Vigilant risk monitor (LOC/TF/SR/PAT gates, Ready%, EM points, SR‑distance bar). The Opportunity Advisor adds ETAs, checklists and gate status; Multi‑TF Confluence confirms alignment from M1–D1. The Professional Trade Suggestion panel shows regime, session filter, R:R presets, Partials and Quality Pause. Clean, readable UI with one‑click S/R toggles, scanners and a built‑in,
The Rainbow Multiple Moving Average (MMA) is a technical analysis tool used to identify trends and potential reversal points in financial markets. It is based on a system of moving averages that are designed to be used together, with each moving average having a different time frame. The Rainbow MMA consists of multiple exponential moving averages (EMAs) of different lengths, with each EMA plotted in a different color. Typically, the Rainbow MMA includes EMAs of 2, 3, 4, 5, 6, 7, 8, 9, 10, 11, a
Emotions are a weakness. QHO mathematics is the future of your trading! You know what really truly frustrating?  Information garbage and noise. All those legacy, lagging indicators on the charts look like an attempt to steer a rocket ship with a steam engine. They are useless. They look at the past while the market is already flying forward on next-gen tech. We created QHO. This is not just another indicator. This is pure mathematics crushing market chaos right on your chart. Imagine completely
Market Ticker Pro MT5
John Louis Fernando Diamante
The only Market Ticker on the market! Add a professional novelty to your workspace, with built in mini-charts A scrolling Market Ticker that displays price changes from all symbols in the Market Watch list. Provides an easy snapshot of symbol prices, and keeps scrolling automatically while you trade and analyse the chart. The ticker color (+/- price changes) are based on either the current or completed candle, and the previous candle. Options include: - MTF, eg choose to show price changes of t
TTMM – "Time To Make Money" – Time When Traders Makes Money on the Stock Exchanges The ТТММ trade sessions indicator displays the following information: Trade sessions: American, European, Asian and Pacific. (Note: Sessions are displayed on the previous five days and the current day only. The number of days may change depending on the holidays - they are not displayed in the terminals. The sessions are also not displayed on Saturday and Sunday). The main trading hours of the stock exchanges (tim
Indicatore Crypto_Forex "Double Hammer pattern" per MT5, senza ricalcolo e senza ritardo. - L'indicatore "Double Hammer pattern" è un indicatore molto potente per il trading basato sulla Price Action, ideale per i mercati in trend rialzista. - L'indicatore rileva pattern rari ma efficaci: i Double Hammer rialzisti sul grafico: - Double Hammer pattern rialzista - Segnale con freccia blu sul grafico (vedi immagini). - Include avvisi integrati per PC e dispositivi mobili. - L'indicatore "Double Ha
XFlow
Maxim Kuznetsov
XFlow shows an expanding price channel that helps determine the trend and the moments of its reversal. It is also used when accompanying transactions to set take profit/stop loss and averages. It has practically no parameters and is very easy to use - just specify an important moment in the history for you and the indicator will calculate the price channel. DISPLAYED LINES ROTATE - a thick solid line. The center of the general price rotation. The price makes wide cyclical movements around the
--- StudentK Sync Chart --- 1. Move charts at the same time 2. Cross check among different Symbols and Timeframes 3. Plan your own trading strategies --- Context --- StudentK is not indicated as a master or K Sir for knowledgeable person who claims for winning all the time. (But lots of traders should know the fact that it is rarely truth, especially in fluctuated period of time) StudentK is a group of years-experienced traders who want to share amazing tools in Free and Paid versions. Aiming
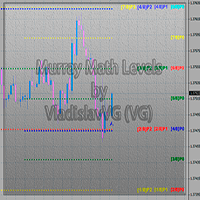
This indicator calculates and displays Murrey Math Lines on the chart. This MT5 version is similar to the МТ4 version: It allows you to plot up to 4 octaves, inclusive, using data from different time frames, which enables you to assess the correlation between trends and investment horizons of different lengths. In contrast to the МТ4 version, this one automatically selects an algorithm to search for the base for range calculation. You can get the values of the levels by using the iCustom() funct
Gann S9 Pro Signals and Star
Mohamed Amr Mohamed Osama Abdelwahab
5 (1)
**Quadrato del Nove di Gann 2 — Previsione Avanzata di Prezzo e Tempo** Il Quadrato del Nove è uno degli strumenti di previsione più potenti di W.D. Gann. Questo indicatore è una completa implementazione di seconda generazione per MetaTrader 5, basata direttamente sul libro di Patrick Mikula. Aggiunge: barra degli strumenti interattiva, pannello segnali, diagramma stella di Gann, zone di canale, statistiche degli angoli, sovrapposti di zone medie e interfaccia in 12 lingue. Da un singolo prez
Argent Aegis
Muhammad Okasha Razaq
Introducing Argent Aegis , a market-structure and fractal breakout indicator that combines confirmed fractal levels with HH, HL, LH and LL analysis to identify potential BUY/SELL opportunities. Argent Aegis identifies confirmed swing highs and lows, analyzes market structure and generates BUY signals when price closes above the latest upper fractal with higher-low confirmation, and SELL signals when price closes below the latest lower fractal with lower-high confirmation. It combines breakout co
Overview The RSI Scanner Dashboard is a comprehensive technical analysis utility and multi-symbol, multi-timeframe monitoring indicator designed for the MetaTrader terminal. The primary objective of this tool is to scan market instruments continuously to identify specific Relative Strength Index (RSI) crossover conditions based on defined overbought and oversold thresholds. By aggregating data across user-defined currency pairs and timeframes into a single graphical user interface (GUI), this d
SmartFlow Consensus
Jackson Mukurani Wanguthi
SmartFlow Consensus is a chart overlay indicator designed for traders who need a clean, structural view of price action without clutter. It filters market noise through an internal consensus engine and renders the result directly onto the chart as intuitive color-coded candles, price zones, and trend structure lines. Built for traders who make decisions from structure rather than guesswork, it combines fractal-based zone detection, multi-layer consensus filtering, and market structure tracking
is a versatile analytical tool designed for both advanced traders and beginners. It combines classic trend line analysis with automatic Fibonacci level plotting to deliver precise market entries and structural clarity. Built as an intuitive and clean on-screen dashboard, this indicator simplifies multi-timeframe analysis without cluttering your main workspace. Technical Analysis and Entry Points The indicator automates the most critical aspects of price action and structural trading: Trend L
LevelsFib DTZ
Vitaliy Davydov
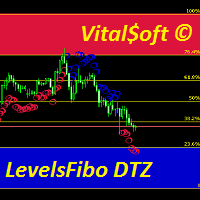
The combined Levels Ib DTZ indicator helps to determine the trend direction when trading. Displaying signals on the chart about a possible upcoming trend change. The indicator is a combination of Fibonacci levels with overbought and oversold zones and a trend indicator based on ZigZag and ATR indicators. The Levels Ib DTZ indicator helps traders predict future price movements and adjust their strategy accordingly. It works on all timeframes.
The Market Structures Pro indicator finds and displays 5 (five) patterns of the Smart Money Concepts (SMC) system on the chart, namely: Break Of Structures (BoS)       Change of character (CHoCH) Equal Highs & Lows Premium, Equilibrium and Discount zones with Fibo grid High-high, Low-low, High-low and Low-high extremes Patterns are displayed for two modes - Swing and Internal and are easily distinguished by color on the chart. Internal mode features higher contrast colors, finer lines, and smal
Simba Price Signal
Emmanuel Ndacyayisenga
SIMBA Price Signal  Rule of Seven + DeMark Forecast & Market Structure Dashboard See the market. Plan the trade. Track the outcome. SIMBA Price Signal is a non-trading analytical indicator for MetaTrader 5 designed to help traders analyze market direction, potential price targets, supply and demand zones, market exhaustion, risk-to-reward, and overall setup quality from one dashboard. The indicator combines Rule of Seven projections, DeMark Sequential analysis, H1 supply and demand zones, Fibona
The indicator is designed to close positions on the market in time. For example: to take profits ahead of schedule if the price has not reached TakeProfit, and the market is turning around. The indicator analyzes the momentum, not the trend. He does not give any information about the trend. The indicator is well suited for finding divergence. The Ershov 38 Parrots indicator dynamically adjusts to the market and detects price movement impulses of medium and high amplitude. It almost does not rea
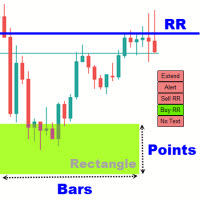
Rectangle Trading Custom is a powerful technical analysis tool designed for price action and range-based traders. It allows users to define consolidation zones and receive alerts when the price breaks out of these zones or approaches trendlines drawn on the chart. Rectangles and Trendlines will be extended into future with one click. Rectangle point size, name and prices will be displayed around rectangle. Key Features: Draw Trading Zones (Rectangle Zones) Users can manually draw rectangles to
Smoothed Candles
Mostafa Saad Saeed Shawara
MQLTeam Smoothed Candles disegna su un grafico MetaTrader 5 candele più leggibili del movimento spezzato del prezzo. Le candele originali si possono nascondere oppure lasciare sotto. Al posto dei brevi saliscendi si vedono tratti continui di rialzo e di ribasso. La chiusura di ogni candela resta la chiusura reale di quella barra. Il prezzo non viene sostituito: si calma solo l’ampiezza della candela. Non è Heikin Ashi e non è un’unione di candele di un timeframe superiore. È lo stesso mercato, d
UT Bot Alert Indicator
Gabriel Quiros Mourente
UT Bot Alerts for MetaTrader 5 A faithful MQL5 port of the legendary UT Bot Alerts indicator, originally created for TradingView by @Yo_adriiiiaan and @HPotter, with the alerts version by @QuantNomad. This indicator plots a dynamic ATR-based trailing stop line and generates buy/sell signals when price crosses it, making it one of the most popular and versatile trend-following tools in the trading community. Features: ATR-based trailing stop line Buy and sell arrow signals Heikin Ashi mode option
FREE
This easy to setup indicator shows you the market volumes in a different way, with support and resistance as showed. You can setup: - Backdays volume to show - Heiken Ashi candle view It works for every kind of graph and every kind of period. The program shows the volumes based on the number of candles displayed in the chart: the more candles the more volumes. Enjoy this very useful indicator. Please feel free to message me to report any kind of improvements! :D
Footprint MT5
Mahmoud Ahmed Abdou Ali
Footprint charts in MetaTrader 5 (MT5) provide traders with a detailed view of market activity, allowing for better analysis of price movements and trading decisions. What is a Footprint Chart? A footprint chart is a specialized visualization tool that displays market data beyond traditional candlestick or bar charts. It reveals how volume was distributed at each price level within a specific time frame, often segmented by bid and ask activity. This level of detail helps traders understand the
ARIPoint is a powerful trading tool designed to generate high-probability entry signals with dynamic TP/SL/DP levels based on price volatility. The integrated performance tracking function displays win/loss statistics, number of PP1/PP2 hits, and success rate, all updated in real time. Key Features: Buy/sell signals with adaptive volatility range Real-time TP/SL/DP levels based on ATR Integrated MA filter with ATR/StdDev volatility option. Performance statistics table (Success, Profit/Loss,
Gli utenti di questo prodotto hanno anche acquistato
Trend Sniper X
Sarvarbek Abduvoxobov
4.87 (46)
Trend Sniper X è un indicatore trend-following multi-timeframe per MetaTrader 5 che aiuta i trader a identificare la direzione del trend e i potenziali punti di inversione con chiarezza e precisione. per MT4: https://www.mql5.com/en/market/product/193245 Informazioni sul prezzo: Il prezzo attuale è promozionale ed è soggetto a modifiche con il rilascio di futuri aggiornamenti e nuove funzionalità. Offerta Bonus: Per ricevere GRATIS l'Auto-Trade Assistant EA per questo indicatore, invia un messa
SuperScalp Pro
Van Minh Nguyen
4.5 (38)
SuperScalp Pro - Professional Multi-Layer Confluence Scalping System SuperScalp Pro è un indicatore di scalping avanzato che potenzia il Supertrend classico con diversi filtri intelligenti di conferma. Aiuta a individuare opportunità di trading Buy/Sell con una maggiore probabilità di successo, riducendo significativamente i falsi segnali. Le frecce Buy e Sell vengono visualizzate chiaramente direttamente sul grafico, insieme ai livelli di Stop Loss e Take Profit basati sull’ATR, calcolati autom
Un nuovo Re in città - Indicatore + Gestione ordini (TP1 + TP2 + TP3) + Invio opzionale di segnali Telegram INCLUSO (GRATIS) (SISTEMA COMPLETO DI TRADING e SEGNALI) Il nostro miglior EA per l’Oro: Gold Slayer Questo indicatore include una strategia avanzata, un sistema di trading con gestione ordini personalizzabile e un sistema mean reversion che combina estensioni di envelope, supportato da molteplici filtri intelligenti di conferma come RSI per individuare ingressi di inversione ad alta proba
Entry Points Pro è un indicatore per MT5 che non si ridisegna e vi mostra il prezzo di ingresso, lo stop loss, la dimensione del lotto e il rischio stimato in denaro prima di piazzare un ordine. Impostate il vostro deposito e il rischio per operazione. Il pannello calcola la dimensione del lotto al posto vostro. Nello screenshot, 4357.65 è il livello di ingresso in rottura, 4324.53 è lo stop e con 0.04 lotti il rischio stimato è di $132. Provatelo gratis nel tester di strategia di MT5. Seleziona
Gann Made Easy è un sistema di trading Forex professionale e facile da usare che si basa sui migliori principi del trading utilizzando la teoria di mr. WD Gann. L'indicatore fornisce segnali ACQUISTA e VENDI accurati, inclusi i livelli di Stop Loss e Take Profit. Puoi fare trading anche in movimento utilizzando le notifiche PUSH. CONTATTAMI DOPO L'ACQUISTO PER RICEVERE GRATUITAMENTE LE ISTRUZIONI DI TRADING E OTTIMI INDICATORI EXTRA! Probabilmente hai già sentito parlare molte volte dei metodi d
SMC Intraday Formula
VividMind Digital Solutions
5 (26)
Cominciamo con la verità. Nessun indicatore da solo ti renderà profittevole. Se qualcuno ti dice il contrario, ti sta vendendo un sogno. Qualsiasi indicatore che mostra frecce perfette di acquisto/vendita può essere reso impeccabile — basta ingrandire la giusta sezione della storia e catturare solo i trade vincenti. Noi non lo facciamo.  SMC Intraday Formula è uno strumento. Legge la struttura del mercato per te, identifica le zone a più alta probabilità e ti mostra esattamente come appare la t
Ultra Indicator
Ihor Otkydach
5 (1)
ULTRA è un indicatore tecnico che funziona secondo un approccio “tutto in uno”: analizza autonomamente il mercato, genera segnali di trading, visualizza i livelli per l’impostazione degli ordini stop-loss e suggerisce quando chiudere le operazioni per realizzare profitti o ridurre al minimo le perdite. In altre parole, non importa se non sai come analizzare il mercato, determinare i livelli — dove impostare lo stop-loss — o se hai difficoltà con la gestione del capitale. ULTRA farà tutto questo
Currency Strength Wizard   è un indicatore molto potente che ti fornisce una soluzione all-in-one per un trading di successo. L'indicatore calcola la potenza di questa o quella coppia forex utilizzando i dati di tutte le valute su più intervalli di tempo. Questi dati sono rappresentati in una forma di indice di valuta facile da usare e linee elettriche di valuta che puoi utilizzare per vedere il potere di questa o quella valuta. Tutto ciò di cui hai bisogno è collegare l'indicatore al grafico ch
Auto Optimized SpeedAngle è un sistema di vettorizzazione del momento di livello istituzionale che elimina l'overfitting ( curve-fitting ) attraverso l'ottimizzazione continua Walk-Forward (WFO). Invece di affidarsi a input statici che si degradano quando i regimi di mercato cambiano, l'indicatore recalibra dinamicamente i suoi parametri utilizzando la validazione Out-of-Sample (OOS), assicurando che i segnali visualizzati rappresentino reali vantaggi statistici anziché anomalie storiche. Quadro
RelicusRoad Pro MT5
Relicus LLC
4.96 (25)
Basta andare a intuito nei tuoi trade. Sai quando entrare, dove uscire e da che parte va il mercato, tutto su un solo grafico. RelicusRoad Pro riunisce quasi venti strumenti in un unico indicatore, e attivi quelli che si adattano al tuo modo di operare. Ingressi chiari. Uscite chiare. Un piano su ogni grafico. Ti suona familiare? Compri, e un minuto dopo il prezzo ti va contro. Chiudi troppo presto, poi guardi il movimento proseguire senza di te. Cinque indicatori sul grafico, cinque risposte di
Indicatore multi-valuta di forza e momentum MT5 Dynamic Forex28 Navigator è l'evoluzione dei nostri indicatori popolari da lunga data, che riunisce la potenza di cinque in uno: Advanced Currency Strength28 Indicator (700 recensioni) Advanced Currency IMPULSE with ALERT (530 recensioni) Currency Strength EXOTICS GOLD Impulse with Alert CS28 Combo Signals (bonus attuale) Non serve acquistare quattro indicatori e impilarli sui grafici. Tutto è riunito in un solo indicatore potente: la forza delle 2
Gold Trend Coach MT5
Cristhian Alexander Gaibor Cuasquer
4.27 (11)
Segnali di acquisto e vendita senza repaint sull'oro (XAUUSD) per MetaTrader 5. Ogni segnale arriva con stop loss e tre take profit. Un filtro Smart Money Concepts con BOS e CHoCH, così operi a favore della struttura, non contro. Un Mentor live sul pannello che ti guida passo dopo passo dall'ingresso fino al TP3. E alert direttamente sul tuo telefono e sul tuo canale Telegram. Questo è Gold Trend Coach. Mai più da solo davanti al grafico. KIT ACQUIRENTE GRATIS con il tuo acquisto: 1. Telegram A
Prossimo aggiornamento — Versione 2.52 in arrivo! [NOVITÀ] Preparati a 4 nuove funzionalità principali progettate per migliorare la tua analisi di mercato e il tuo flusso di lavoro nel trading Portiamo l’analisi di mercato a un livello superiore con 4 nuove funzionalità progettate per soddisfare le tue esigenze di trading. Ecco le novità: 1. TRADE OVERVIEW DASHBOARD 2. CONFLUENCE AT ZONE 3. STRONG & WEAK HIGH/LOW 4. OTE 1. TRADE OVERVIEW DASHBOARD Una dashboard che ti aiuta a comprendere più fa
M1 Sniper MT5
Oleg Rodin
5 (7)
M1 SNIPER   è un sistema di indicatori di trading facile da usare. Si tratta di un indicatore a freccia progettato per l'intervallo temporale M1. L'indicatore può essere utilizzato come sistema autonomo per lo scalping sull'intervallo temporale M1 e come parte del tuo sistema di trading esistente. Sebbene questo sistema di trading sia stato progettato specificamente per il trading sull'intervallo temporale M1, può comunque essere utilizzato anche con altri intervalli temporali. Inizialmente ho p
FX Power MT5 NG
Daniel Stein
5 (33)
FX Power: Analizza la Forza delle Valute per Decisioni di Trading Più Intelligenti Panoramica FX Power è lo strumento essenziale per comprendere la reale forza delle principali valute e dell'oro in qualsiasi condizione di mercato. Identificando le valute forti da comprare e quelle deboli da vendere, FX Power semplifica le decisioni di trading e rivela opportunità ad alta probabilità. Che tu segua le tendenze o anticipi inversioni utilizzando valori estremi di Delta, questo strumento si adatta
Azimuth Pro
Ottaviano De Cicco
5 (7)
Azimuth Pro V2: Synthetic Fractal Structure and Confirmed Entries for MT5 Overview Azimuth Pro is a multi-level swing structure indicator by Merkava Labs . Four nested swing layers, swing-anchored VWAP, ABC pattern detection, three-timeframe structural filtering, and closed-bar confirmed entries — one chart, one workflow from micro-swings to macro-cycles. This is not a blind signal product. It is a structure-first workflow for traders who care about location, context, and timing. 1. What Change
Boba Analysis Suite
Trade Ready Solutions LLC
5 (2)
Boba Analysis Suite Boba Analysis Suite è un indicatore di analisi per MetaTrader 5. Riunisce la struttura del mercato, le zone di prezzo rilevanti e il contesto generale del mercato in un’unica visualizzazione del grafico. Sviluppato sulla base dell’esperienza pratica come trader e formatore di trading, supporta un processo di analisi strutturato: valutare la direzione del mercato, individuare livelli importanti e analizzare congiuntamente più intervalli temporali. Analisi nel contesto del merc
Gold Sniper Scalper Pro
Ich Khiem Nguyen
3.9 (10)
Gold Sniper Scalper Pro è un indicatore per MetaTrader 5 costruito specificamente per rilevare pattern di falsa rottura (false breakout) su XAUUSD. Identifica la struttura trappola a 4 barre dove il prezzo supera il confine di un range, attira i trader di rottura e poi inverte — confermando che il movimento era una falsa rottura. L'indicatore valuta ogni setup secondo 17 fattori di qualità, lo elabora attraverso un pipeline di confluenza a 4 livelli, lo verifica contro un motore di consenso di
Non repaint MT5
Yan Zhen Du
5 (1)
This is a professional chart indicator designed for traders focused on stability and clear price action. It helps filter market noise and provides clear visual entry and exit zones for your trading decisions. Price Information: The current price is promotional and is subject to change as upcoming updates and new features are released. MQL5 public channel:  CLICK HERE for MT4:  Non-repainting MT4 version Core Features: Strictly Non-Repainting:   The system is built with strict non-repaint logic.
Power Candles MT5
Daniel Stein
4.58 (12)
Power Candles V3 - Indicatore di forza ad ottimizzazione automatica Power Candles V3 trasforma la forza delle valute e degli strumenti in un piano di trading attuabile su ogni grafico a cui è collegato. Invece di limitarsi a colorare le candele, esegue un'auto-ottimizzazione in tempo reale in background e ti fornisce i migliori valori di Stop Loss, Take Profit e soglia di segnale per il simbolo che hai davanti. Basta un clic per adottarlo nel trading live: i raggi di ingresso, Stop Loss e Take P
Fx Levels Premium Indicator Support and Resistance are important concepts in trading. Fx Levels Premium was created to easily draw important levels of support and resistance for the active trader. The indicator will give you all important levels (support/resistance) to watch for a wide range of assets. Trading without these levels on your chart is like driving a car for a long journey without a roadmap. You would be confused and blind. Support and resistance levels should be used as guideline
FiboSniper Pro
Van Minh Nguyen
4.6 (5)
FiboSniper Pro – Multi-Filter Fibonacci System with Auto SL/TP and Control Panel FiboSniper Pro è un indicatore tecnico che combina Fibonacci Envelopes dinamici con diversi filtri di conferma per generare segnali Buy e Sell selezionati. I livelli di Fibonacci vengono calcolati sulla base di Moving Average e ATR e successivamente filtrati tramite ADX, EMA, RSI, ATR, Volume, Time e struttura delle candele. L’indicatore visualizza direttamente sul grafico i livelli automatici di Stop Loss e Take Pr
HyperPOWER
Alfred Charano
HyperPOWER — See the Power. Ride the Trend. Stop guessing direction. See which currency is driving the move, ride the trend and get clean BUY/SELL arrows — all in one beautiful indicator. Full PDF Setup Guide is available :    https://www.mql5.com/en/blogs/post/779799 HyperPILOT EA :  https://www.mql5.com/en/blogs/post/781404 Description Too many indicators. Too many signals. Still no idea where to enter? HyperPOWER replaces the clutter with one clear answer: who is strong, who is weak, and wh
OrderFlux – Indicatore Orderflow Footprint Chart, Volume Profile e Market Profile per MetaTrader 5 OrderFlux è un indicatore Footprint di Order Flow per MetaTrader 5 che permette di osservare direttamente cosa accade all’interno di ogni candela. Mostra il volume scambiato a ogni livello di prezzo, distinguendo gli acquirenti aggressivi dai venditori aggressivi. A partire dai tick, costruisce in tempo reale un grafico Footprint completo con delta, squilibri, assorbimento, Volume Profile, Market P
Meridian Pro
Ottaviano De Cicco
4 (3)
Meridian Pro 2.00: Professional Multi-Timeframe Trend Matrix for MT5 Meridian Pro 2.00 is a professional adaptive trend matrix for MetaTrader 5. It combines the original Meridian trend engine, a clean chart ribbon, closed-bar signal arrows, an 8-timeframe dashboard, Fuel momentum, weighted consensus, synthetic HTF processing and chart-native higher-timeframe context lines. The goal is simple: read current trend, multi-timeframe structure, strength, momentum and EA-ready state from one discipline
PZ Swing Trading MT5
PZ TRADING SLU
5 (5)
Protect against whipsaws: revolutionize your swing trading approach Swing Trading is the first indicator designed to detect swings in the direction of the trend and possible reversal swings. It uses the baseline swing trading approach, widely described in trading literature. The indicator studies several price and time vectors to track the aggregate trend direction and detects situations in which the market is oversold or overbought and ready to correct. [ Installation Guide | Update Guide | Tro
Crystal Heikin Ashi Signals
Muhammad Jawad Shabir
5 (6)
Crystal Heikin Ashi Signals—Professional Trend & Signal Detection Indicator Advanced Heikin Ashi Visualization with Intelligent Signal System for Manual & Automated Trading Final Price: $149 ---------> Price goes up $10 after every 10 sales . Limited slots available — act fast . Overview User Guide PDF Crystal Heikin Ashi Signals is a professional-grade MetaTrader 5 indicator that combines pure Heikin Ashi candle visualization with an advanced momentum-shift detection system. Designed for both m
FX Trend MT5 NG
Daniel Stein
5 (6)
FX Trend NG: La Nuova Generazione di Intelligenza di Trend Multi-Mercato Panoramica FX Trend NG è uno strumento professionale di analisi del trend multi-timeframe e monitoraggio dei mercati. Ti consente di comprendere la struttura completa del mercato in pochi secondi. Invece di passare tra numerosi grafici, puoi identificare immediatamente quali strumenti sono in trend, dove il momentum sta diminuendo e dove esiste un forte allineamento tra i timeframe. Offerta di Lancio – Ottieni FX Trend NG
Neuro Poseidon MT5
Daria Rezueva
4.68 (53)
Neuro Poseidon is a new indicator by Daria Rezueva. It combines precise trading signals with adaptive TP/SL levels - creating best possible trades as a result! Message me and get  Neuro Poseidon Assistant  as a gift to automize your trading process! What makes it stand out? 1. Proven profitability on all assets and timeframes 2. Only confirmed BUY and SELL signals present on the chart 3. Adaptive TP & SL levels generated by the software for each trade 4. Easy to understand - suitable for al
Trend Lines PRO MT5
Roman Podpora
5 (1)
LINEE DI TENDENZA PRO       Aiuta a capire dove il mercato sta realmente cambiando direzione. L'indicatore mostra reali inversioni di tendenza e punti in cui i principali attori rientrano. Vedi  Linee BOS   Cambiamenti di tendenza e livelli chiave su timeframe più ampi, senza impostazioni complesse o rumore inutile. I segnali non vengono ridisegnati e rimangono sul grafico dopo la chiusura della barra. VERSIONE MT 4     -      Svela il suo massimo potenziale se abbinato all'indicatore   RFI LEVE
Altri dall’autore
OracleTrading Candlestick Reversal Signals — Smart Search for Reversal Patterns with Multi-Level Confirmation The indicator detects 18 classic candlestick reversal patterns on the chart. Instead of simply drawing an arrow, it assigns each signal a strength rating from 1 to 10 , based on trend alignment and confirmation from 10 popular indicators . This is not another basic “arrow” indicator. It is a confluence analysis tool that filters out random formations and retains only those signals confir
FREE
Oracle Trading v1.0 Final è un sistema di trading professionale multi-strategia per MetaTrader 5 che integra i migliori metodi di analisi classici e moderni in un potente sistema decisionale. Il sistema si basa su un'alta confluenza di più fattori indipendenti. Invece di generare segnali basati su un singolo indicatore o pattern, Oracle Trading calcola la forza complessiva del segnale (fino a 100 punti) e mostra solo le configurazioni ( setup ) in cui convergono contemporaneamente più fattori p
Oracle Harmonic Patterns rileva automaticamente l’intera famiglia dei pattern armonici di Gartley su qualsiasi timeframe, con un filtro di qualità integrato. Vedrai solo i setup convalidati da una vera confluenza — non pattern che semplicemente “sembrano simili”. Identificare manualmente i pattern armonici è estremamente dispendioso in termini di tempo: cinque punti di inversione, rapporti di Fibonacci precisi e una Zona di Inversione Potenziale (PRZ) che ha senso solo quando più segnali indipen
Oracle Ratchet Gold M15 Expert Advisor di trend-following per XAUUSD M15. Senza griglia. Senza martingala. Senza averaging. Si basa su un’unica regola verificata da cinque anni di storia: Ogni nuovo acquisto viene aperto solo al di sopra del precedente. Ogni vendita viene aperta solo al di sotto della precedente. L’advisor non cerca di indovinare i ribaltamenti e non aggiunge alle posizioni in perdita. Aumenta la posizione solo dopo che il mercato ha confermato che l’ingresso precedente era corr
Oracle Super Elliott Wave Elliott Wave chart helper for MetaTrader 5. The indicator reads swing pivots on three independent degrees (micro, intermediate, major) and tries to classify the latest structure as an impulse 1-2-3-4-5, a leading or ending diagonal, a zigzag or flat A-B-C, or a horizontal triangle A-B-C-D-E. Labels, channels, Fibonacci levels and optional entry arrows are drawn on the chart. A small panel can show the current count and the oscillator verdict. This is an analytical tool.
Filtro:
Nessuna recensione
Rispondi alla recensione