AlphaGrid Pro
- Indicatori
-
Farhad Kia
 I have extensive experience as an algo-trader and a skilled MT4/5 tool developer. I have created over 1000 EAs, indicators, and scripts for MT4/5, and have won several Forex contests. Apart from programming, I also possess valuable expertise as a successful algo-trader, which allows me to provide
 - Versione: 1.0
- Attivazioni: 5
AlphaGrid Pro
See the market in full dimension.
Built for traders who demand more than a single indicator can tell them.
AlphaGrid Pro is a professional-grade signal intelligence dashboard that monitors 8 technical indicators across 8 timeframes simultaneously, giving you a single, weighted net bias score that tells you exactly where the market is leaning and how strongly.
Stop flipping between charts. Stop second-guessing conflicting signals. AlphaGrid Pro does the heavy lifting and delivers a clean, color-coded verdict — always live, always on your chart.
Key Features
- 8 Indicators: Bollinger Bands, RSI, Stochastic, MACD, Parabolic SAR, CCI, EMA Cross, Williams %R
- 8 Timeframes: M1, M5, M15, M30, H1, H4, D1, W1 — all tracked simultaneously
- Weighted Net Bias Engine — not a simple vote count, but a statistically meaningful score
- 6-Level Bias Classification: Strong Buy → Buy → Lean Buy → Lean Sell → Sell → Strong Sell
- Smart Alerts — fires only on meaningful net bias state changes, no noise
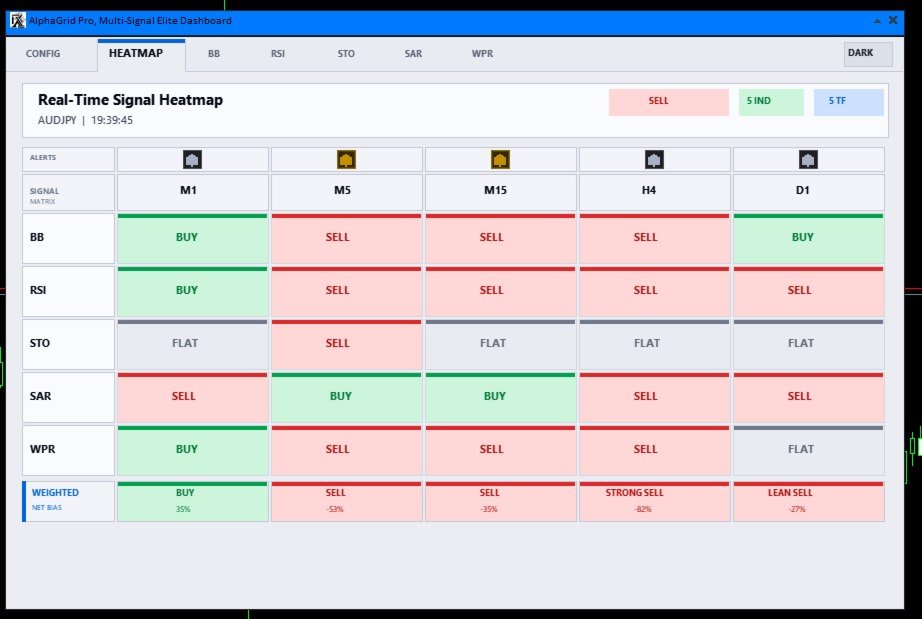
- Dark & Light themes, fully editable parameters, persistent settings
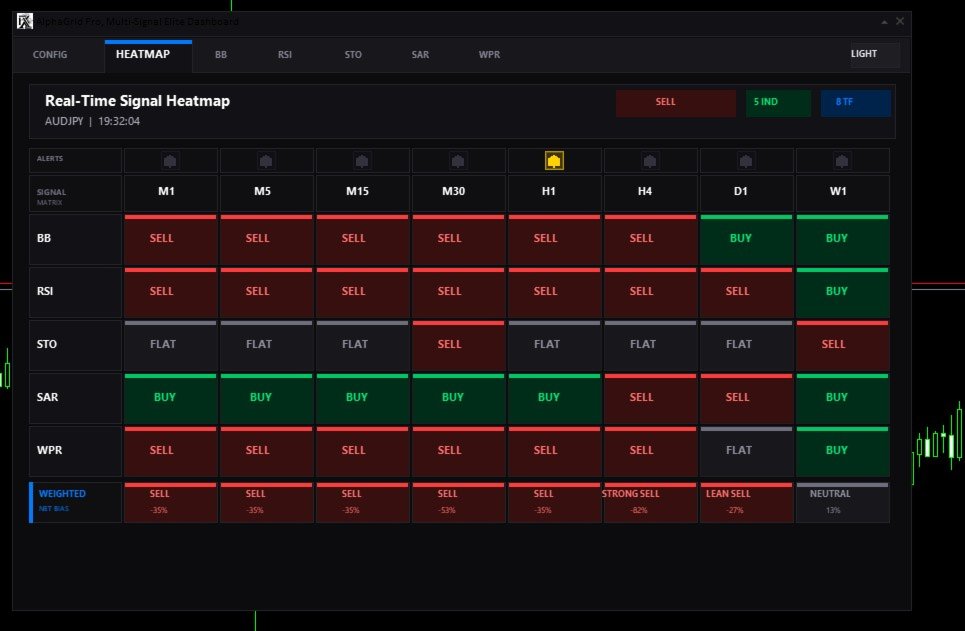
Reading the Heatmap
The HEATMAP tab is the core of AlphaGrid Pro. Each cell in the matrix shows one indicator's verdict on one timeframe:
The NET BIAS row at the bottom of each timeframe column is your primary decision tool, a weighted score combining all active indicators:
| Label | Score Range | Meaning |
| STRONG BUY | Score > +60% | Overwhelming bullish consensus — highest confidence |
| BUY | +30% to +60% | Clear bullish bias — trade with confirmation |
| LEAN BUY | +15% to +30% | Mild bullish lean — watch for entry trigger |
| NEUTRAL | -15% to +15% | No clear direction — stay out |
| LEAN SELL | -15% to -30% | Mild bearish lean — watch for entry trigger |
| SELL | -30% to -60% | Clear bearish bias — trade with confirmation |
| STRONG SELL | Score < -60% | Overwhelming bearish consensus — highest confidence |
How to Use AlphaGrid Pro
Step 1 — Install
- Drag AlphaGrid Pro onto any chart from the Navigator panel
- The dashboard appears instantly — drag it anywhere on screen
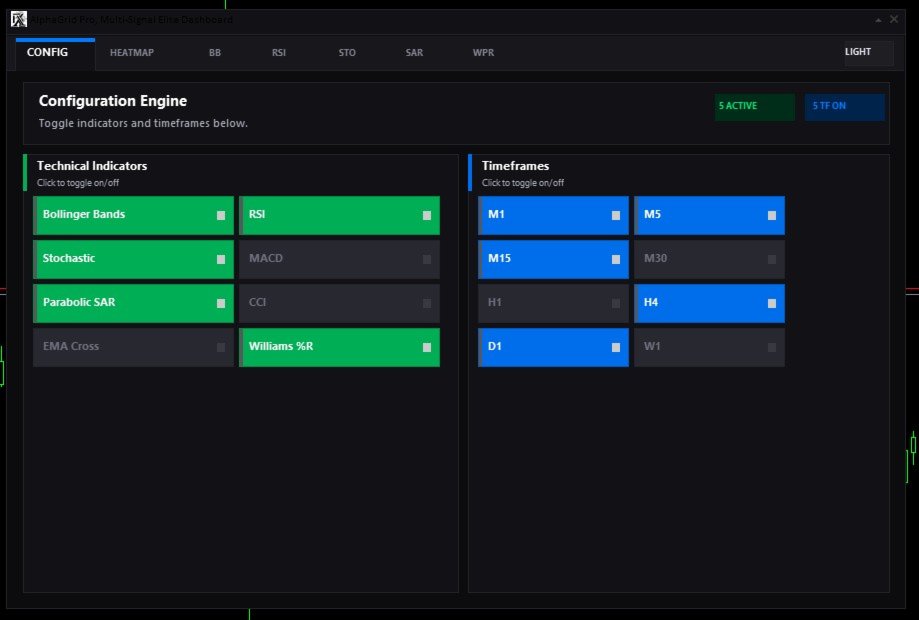
Step 2 — Configure (CONFIG Tab)
- Toggle indicators ON/OFF — Green = active, Gray = inactive
- Toggle timeframes ON/OFF — Blue = active, Gray = inactive
- More active indicators + timeframes = higher confidence NET BIAS scores
Step 3 — Read the HEATMAP
- Look at the NET BIAS row at the bottom — this is your primary signal
- The Overall Bias badge (top right) shows the global bias across all active indicators and timeframes
- Green cells = bullish, Red cells = bearish, Gray = neutral
- STRONG BUY / STRONG SELL are the highest confidence setups
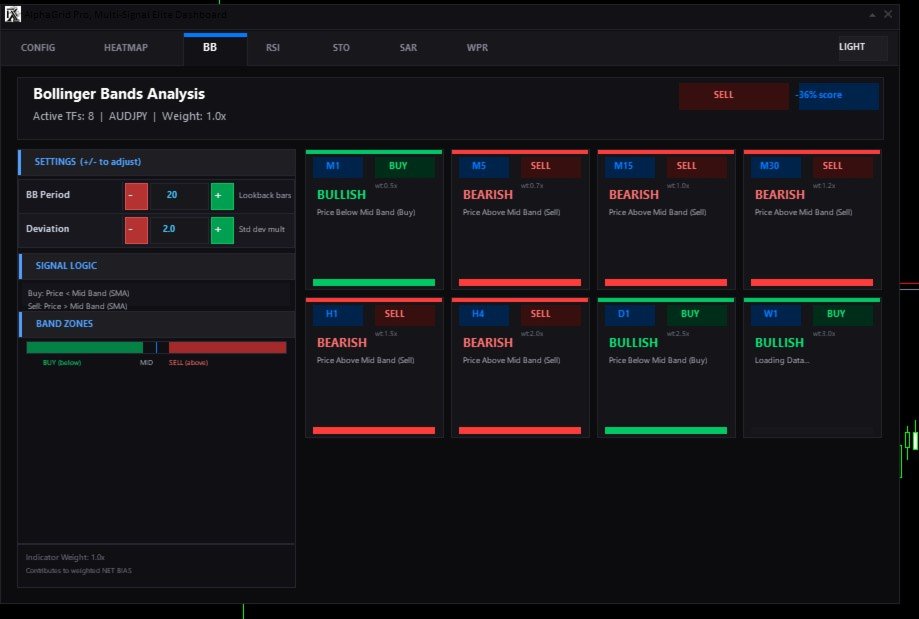
Step 4 — Deep Dive (Indicator Tabs)
- Click any indicator tab (BB, RSI, MACD, etc.) to see its signal on every active timeframe
- Adjust indicator parameters with + / - buttons — changes apply immediately and are saved automatically
Step 5 — Set Alerts
- In the HEATMAP tab, click the bell icon above any timeframe column to enable alerts
- Gold bell = alerts active. Alerts fire only on meaningful NET BIAS state changes; no spam
- Recommended: enable H1, H4, D1 for swing trading. Enable M5, M15 for intraday
| Style | Indicators | Timeframes |
| Scalping | MACD, EMA Cross, RSI, SAR | M1, M5, M15 |
| Day Trading | All 8 | M15, M30, H1, H4 |
| Swing Trading | BB, MACD, RSI, EMA, SAR | H4, D1, W1 |
| Position Trading | BB, RSI, CCI, EMA Cross | D1, W1 |
- The NET BIAS row is your primary signal — everything else gives context.
- STRONG BUY / STRONG SELL are highest confidence. LEAN signals need additional confirmation.
- NEUTRAL is a signal too — it means stay out of the market.
- If D1 and W1 are SELL but M5 shows BUY, the overall bias still leans SELL. Respect higher timeframes.
- To reset all settings to factory defaults, delete MSE_Dashboard_Settings.json from the MQL5 Common folder.