Pullbacks on Trend 5

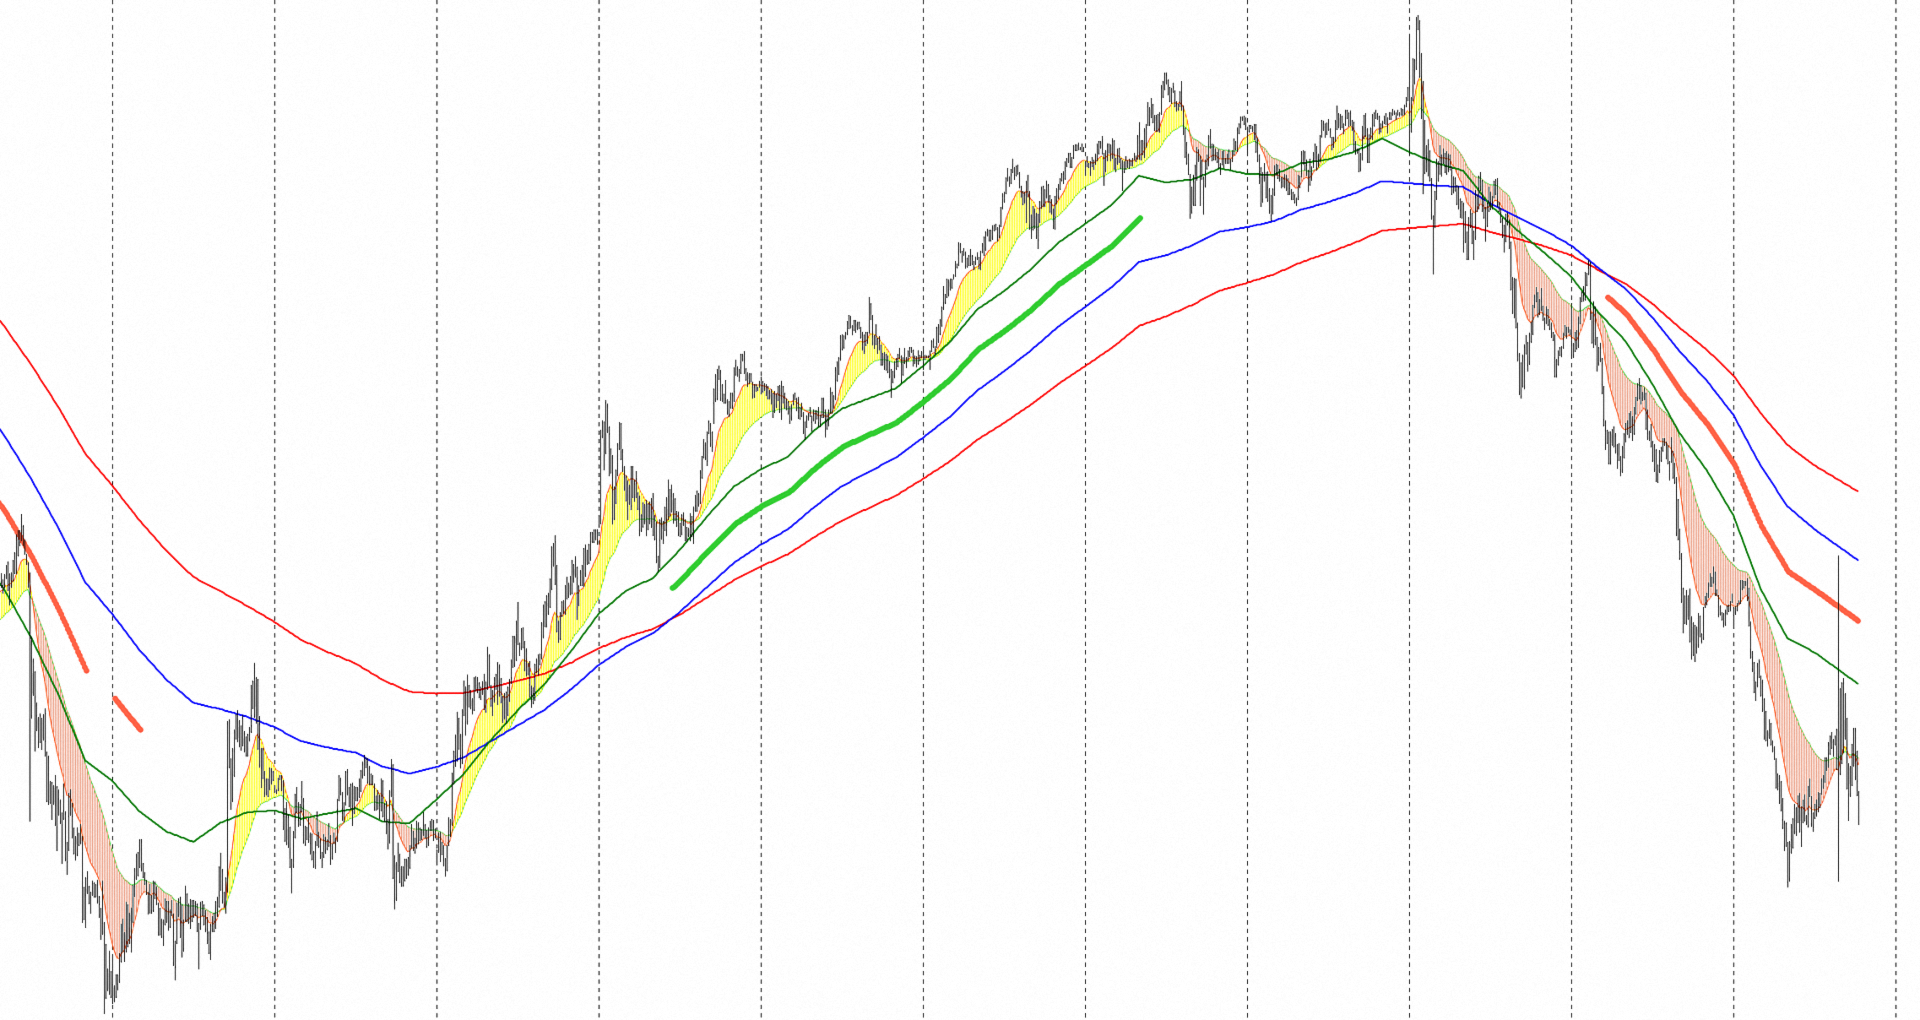
"Pullbacks on Trend 5" is designed to help traders navigate the market situation. The indicator displays three multi-time frame moving averages that describe the "Trend" of price movements of financial instruments. Depending on the time frame you choose to display the trend, you can automatically see the structure of the trend on a lower time frame from its price movements and pullbacks using the histogram between two additional moving averages. Additionally, filters have been added to show the acceleration or deceleration of the "Trend".

Attention: The indicator is set by default to work on the M15 time frame!

The indicator uses exponential moving averages with calculation parameters of 24, 16 and 8 bars. These moving averages describe the trend of the price movement of a given financial instrument. Additionally, on a lower time frame, smoothed moving averages with a calculation period of 24 and 8 bars are visualized, as well as a bearish or bullish histogram between these two moving averages.

- When the "Fast" (calculated for 8 bars) moving average is above the "Medium" (calculated for 16 bars), and the "Medium" is above the "Slow" (calculated for 24 bars) moving average, there is an "Uptrend".

- When the "Fast" (calculated for 8 bars) moving average is below the "Medium" (calculated for 16 bars), and the "Medium" is below the "Slow" (calculated for 24 bars) moving average, there is a "Downtrend".

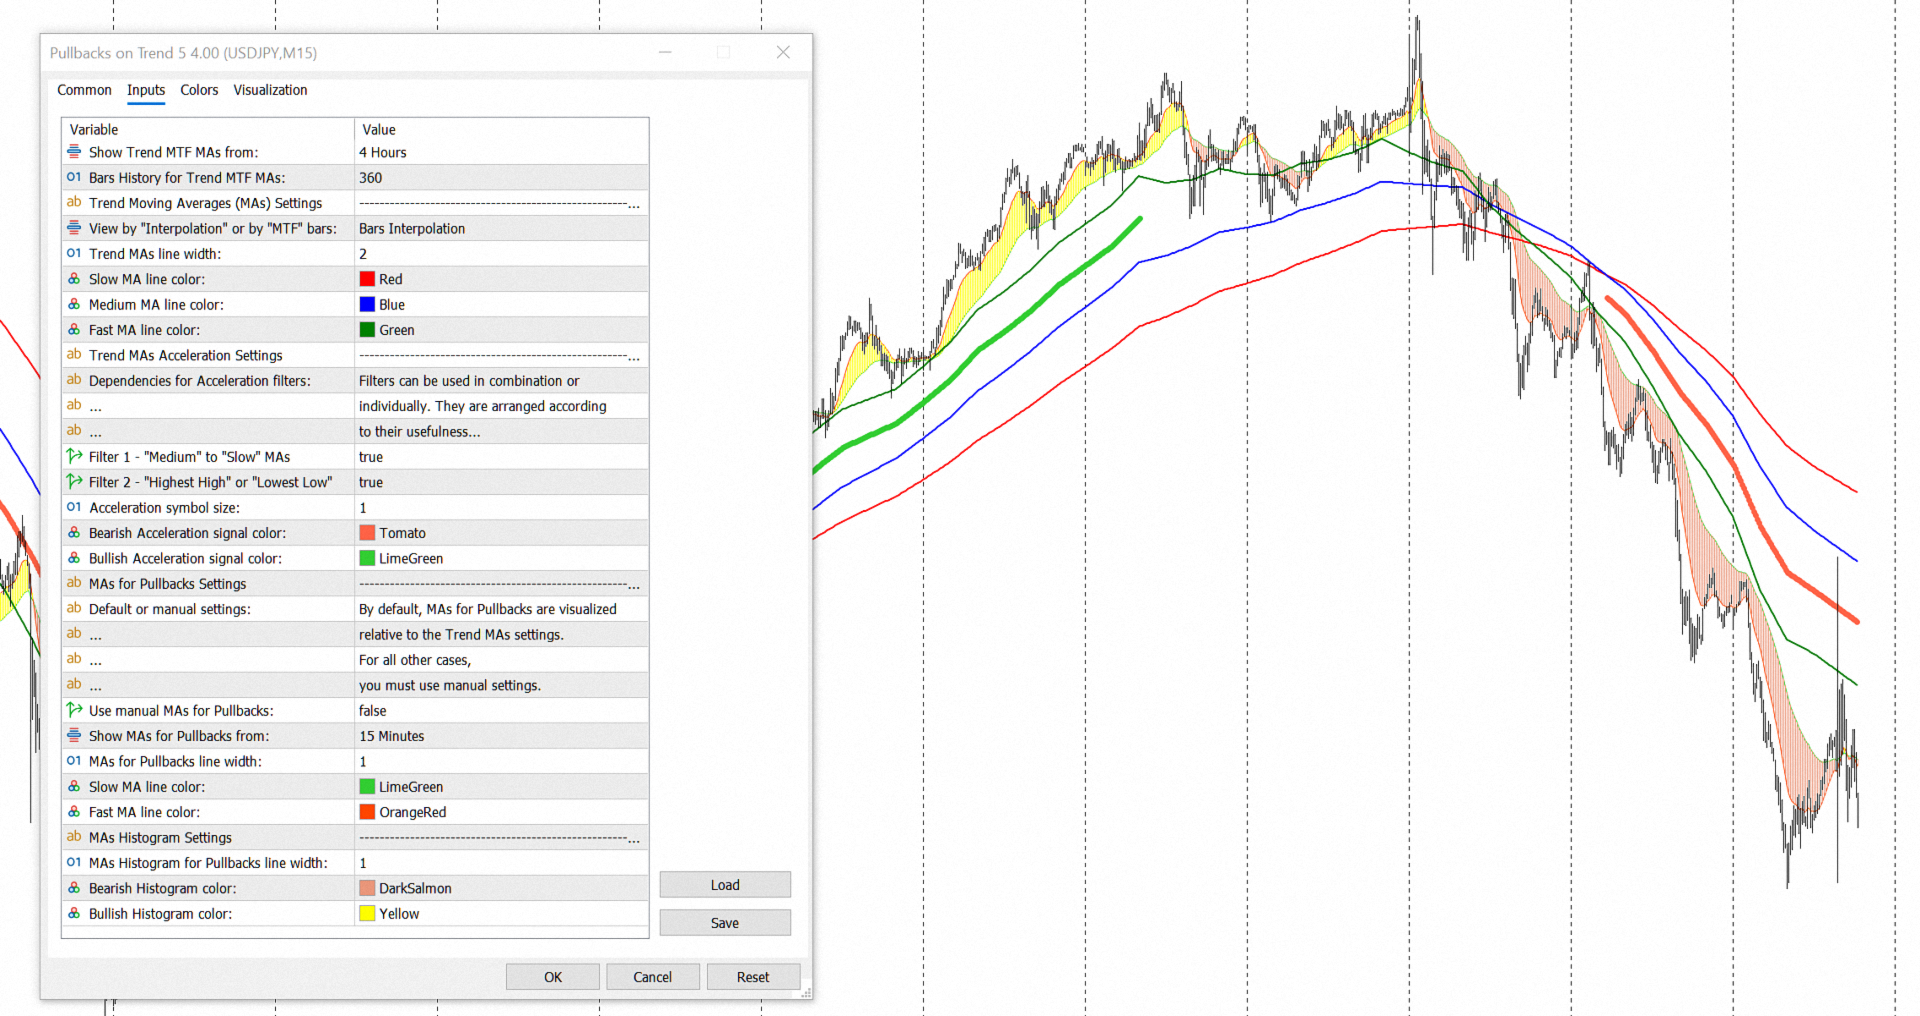
The "Pullbacks on Trend 5" indicator provides two types of visualization of trend moving averages:

- The first option is through "Linear interpolation" for the number of intermediate bars between two bars of a higher time interval at the "Close" price. In this variant, the curves look in the classic way we are used to seeing them. The problem with this visualization is that since the last zero bar is not complete, the linear interpolation is performed between the previous bar 1 and the zero bar, and this leads to rewriting the result until the formation of the zero bar is completed.

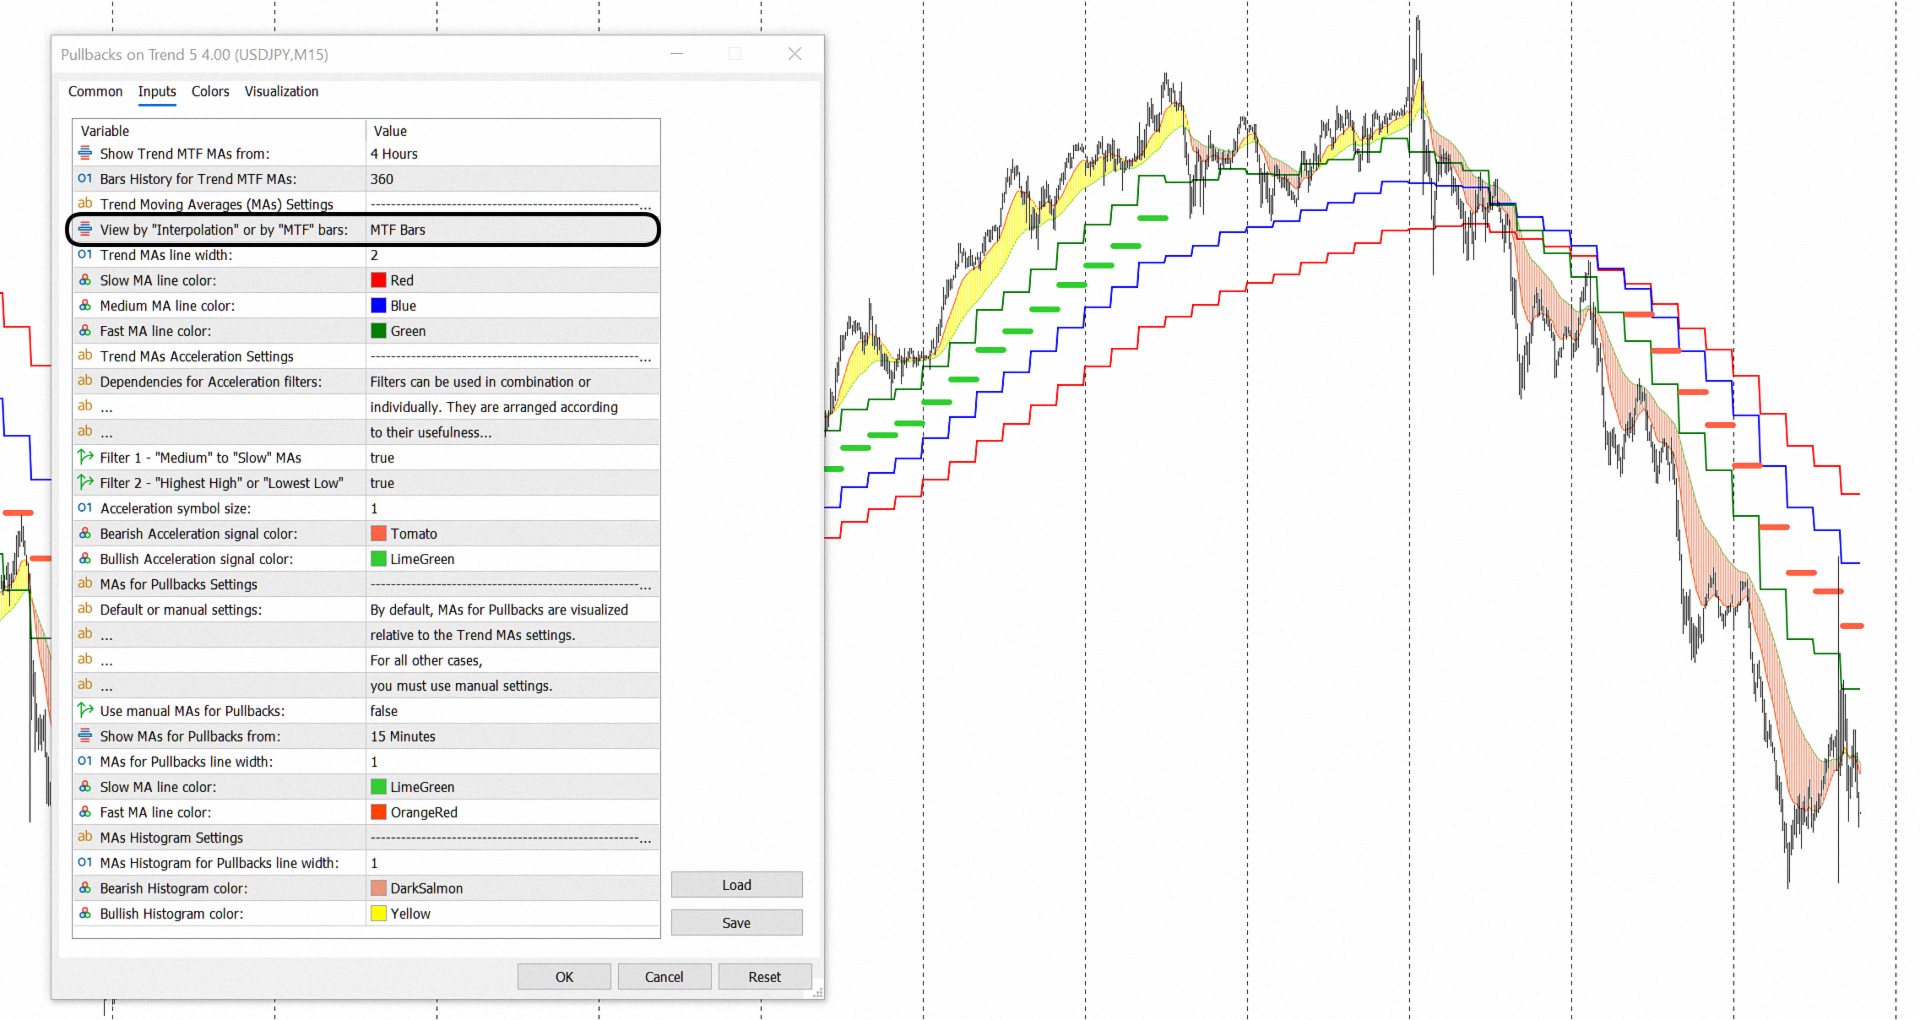
- The second option is to visualize the moving averages by drawing a line at the "Close" price between two bars of a higher time interval. In this variant, the result is rewritten only for the last zero bar. However, the graphical visualization is more unusual.

"Moving Аverages Acceleration" is the result of analyzing the dependencies between trend moving averages. This analysis shows the "Acceleration" of the price movement of financial instruments, as well as the places where the price movement slows down. Visually, the "Acceleration" of the price movement is represented in the form of dots between the "Fast" and "Medium" moving averages. "Moving Averages Acceleration" is equivalent to the term "Trend Acceleration" because it is derived from the signals received from trend moving averages.

- If there are "Acceleration" signals, traders can look for entry points into a trade or consider holding an open position. 

- If there are no "Acceleration" signals, but the three moving averages have not yet crossed, traders can look for a partial closure of an open position or an exit point.

For "Trend Acceleration", two filters have been developed:

Filter 1 - Shows dependencies between the "Medium" and the "Slow" moving averages. This filter analyzes the divergence of the "Medium" and "Slow" moving averages. When they converge, it is said that the "Trend Acceleration" slows down. This filter is suitable for moving stop losses.

Filter 2 - Shows updates of new "Highest High" or new "Lowest Low". This filter is quite simple, but it shows well where the corrections or ranges occur in the price movement.

Both filters are enabled by default. They can be used together or separately. Each financial instrument has its own characteristics, that's why some filters work well on a given financial instrument, and others don't.

Finally, the indicator shows the structure of the price movement on the trend. This can be seen on a lower time frame than the one selected for displaying the trend. For the standard time frames in the MetaTrader Terminal, from which you can choose to display trend moving averages, two moving averages and a histogram built between them are set to be automatically displayed on lower time frames. It is on these lower time frames, and through these two additional moving averages and the histogram between them, that you can visually see the price movement and pullbacks on the trend. This helps to search for justified points for entering a position, holding an already opened position, as well as for fixing the profit or loss.

- If you choose a monthly (MN1) time frame to display the trend, then the structure of the price movement and pullbacks will be visualized on a daily (D1) or lower time frame.

- If you choose a weekly (W1) time frame to display the trend, then the price movement structure and pullbacks will be visualized on a 4-hour (H4) or lower time frame.

- If you choose a daily (D1) time frame to display the trend, then the structure of the price movement and pullbacks will be visualized on an hourly (H1) or lower time frame.

- If you choose a 4-hour (H4) time frame to display the trend, then the structure of the price movement and pullbacks will be visualized on a 15-minute (M15) or lower time frame.

- If you choose a one-hour (H1) time frame to display the trend, then the structure of the price movement and pullbacks will be visualized on a 5-minute (M5) or lower time frame.

- Finally, if you choose a 15-minute (M15) time frame to display the trend, then the structure of the price movement and pullbacks will be visualized on a one-minute (M1) or lower time frame.

The 30-minute (M30) time frame is not included in the default settings because it does not match the proportions for trend and pullbacks. Therefore, the indicator provides the option to manually select a time frame based on your chosen time frame for displaying the trend.

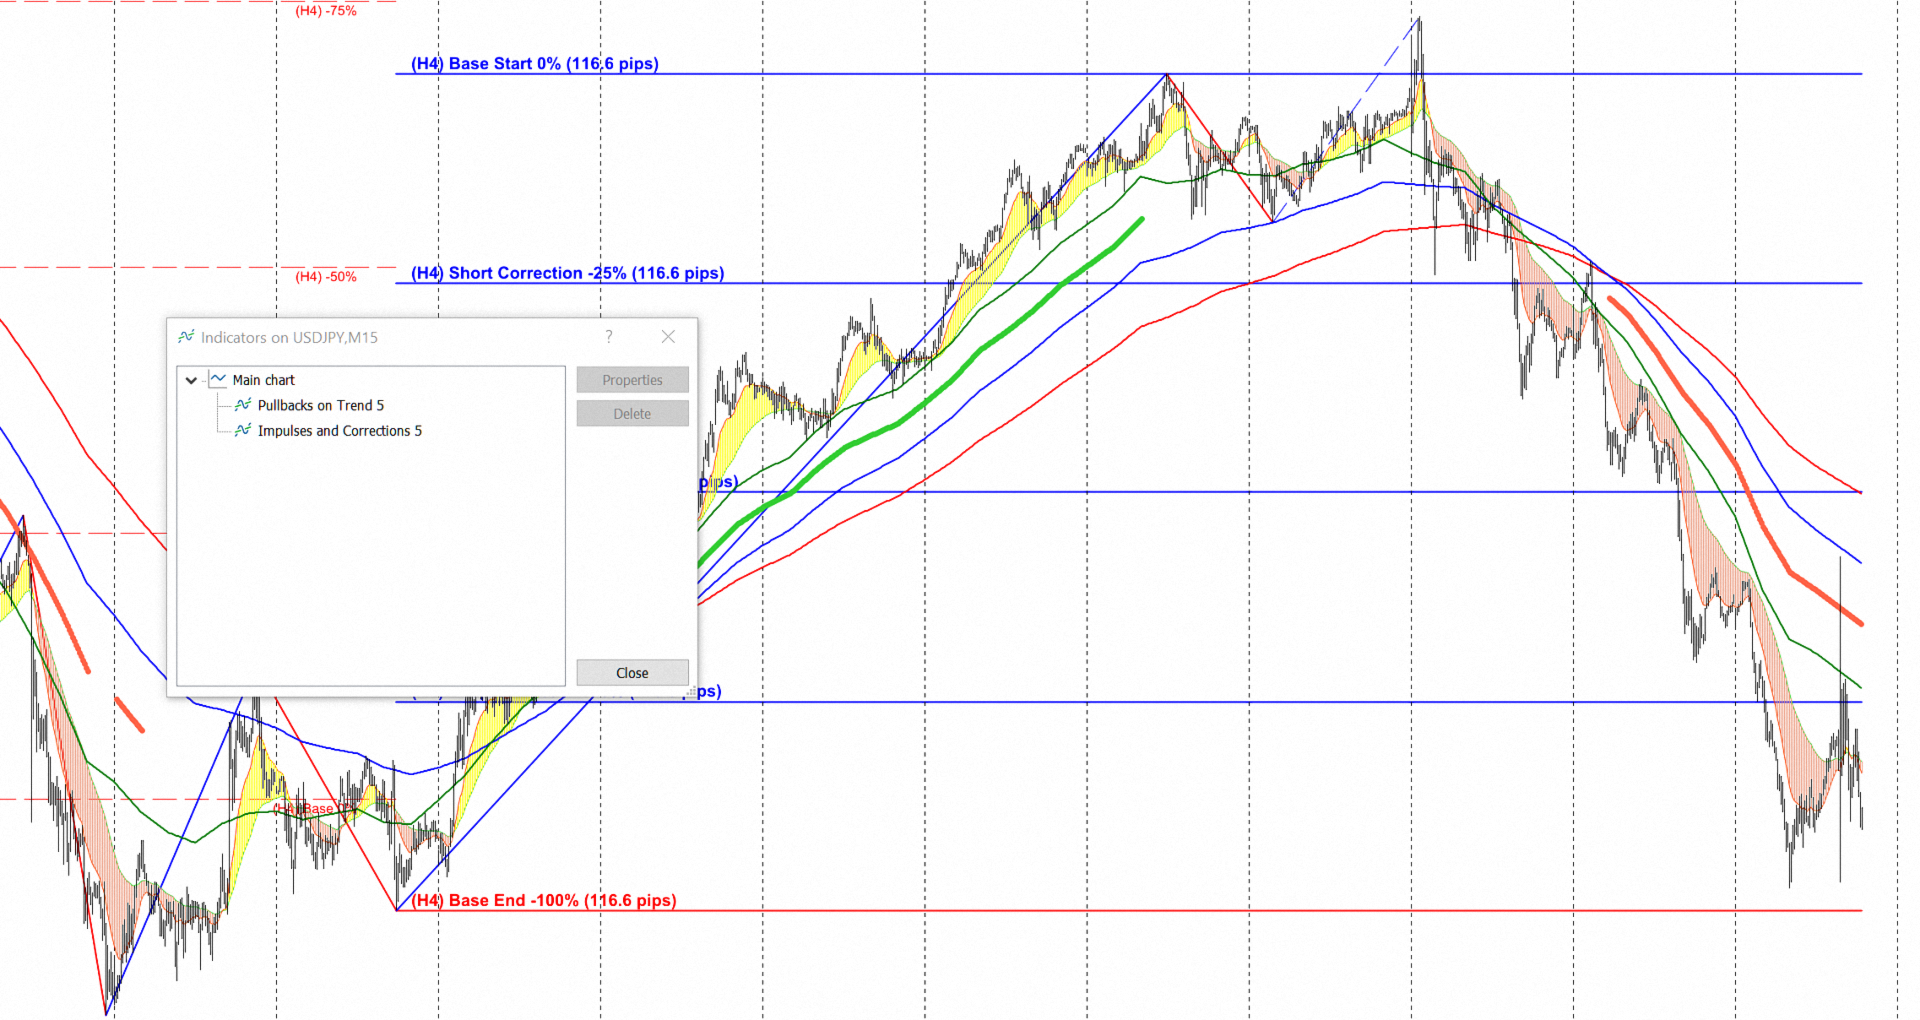
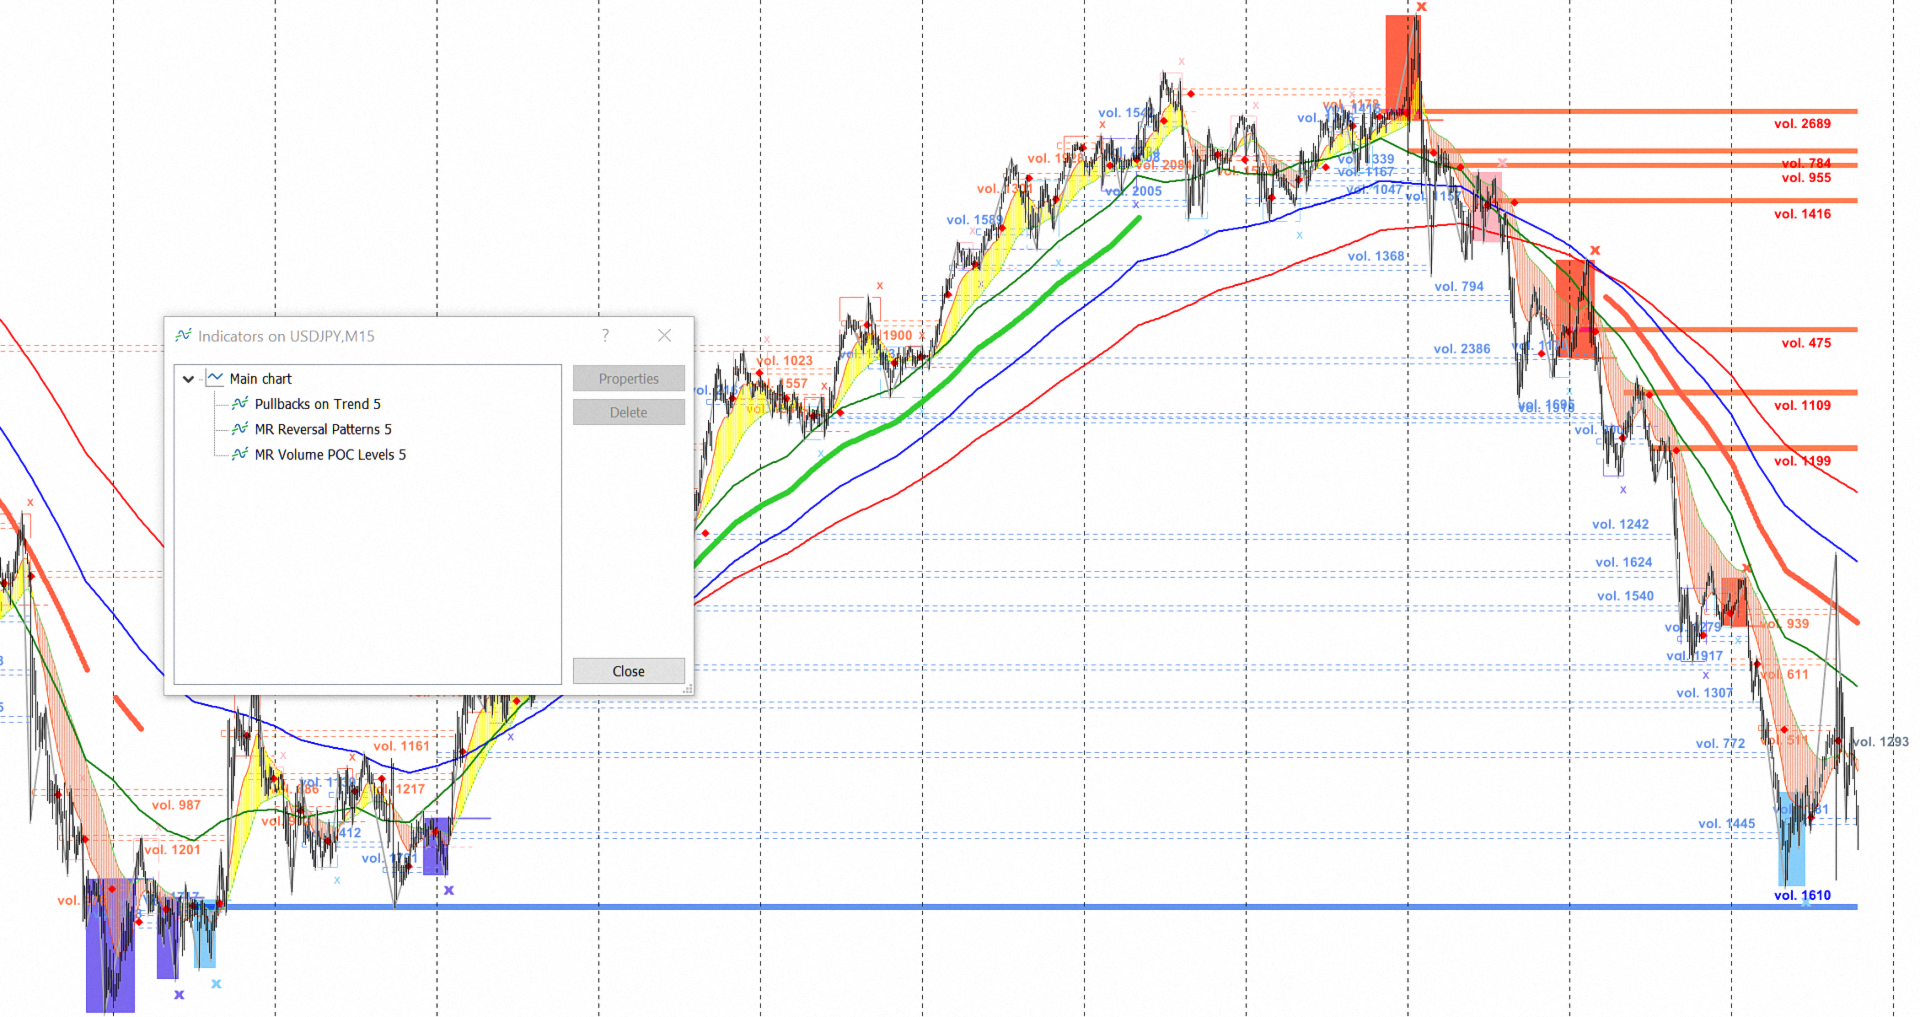
The "Pullbacks on Trend 5" indicator is synchronized with the "Impulses and Corrections 5" indicator. In combination, the two indicators will help traders determine the current situation in the financial markets to the greatest extent. When combined with the "Volumes and Sentiments 5" indicator, you can track when major players are preparing their positions for a trend reversal.

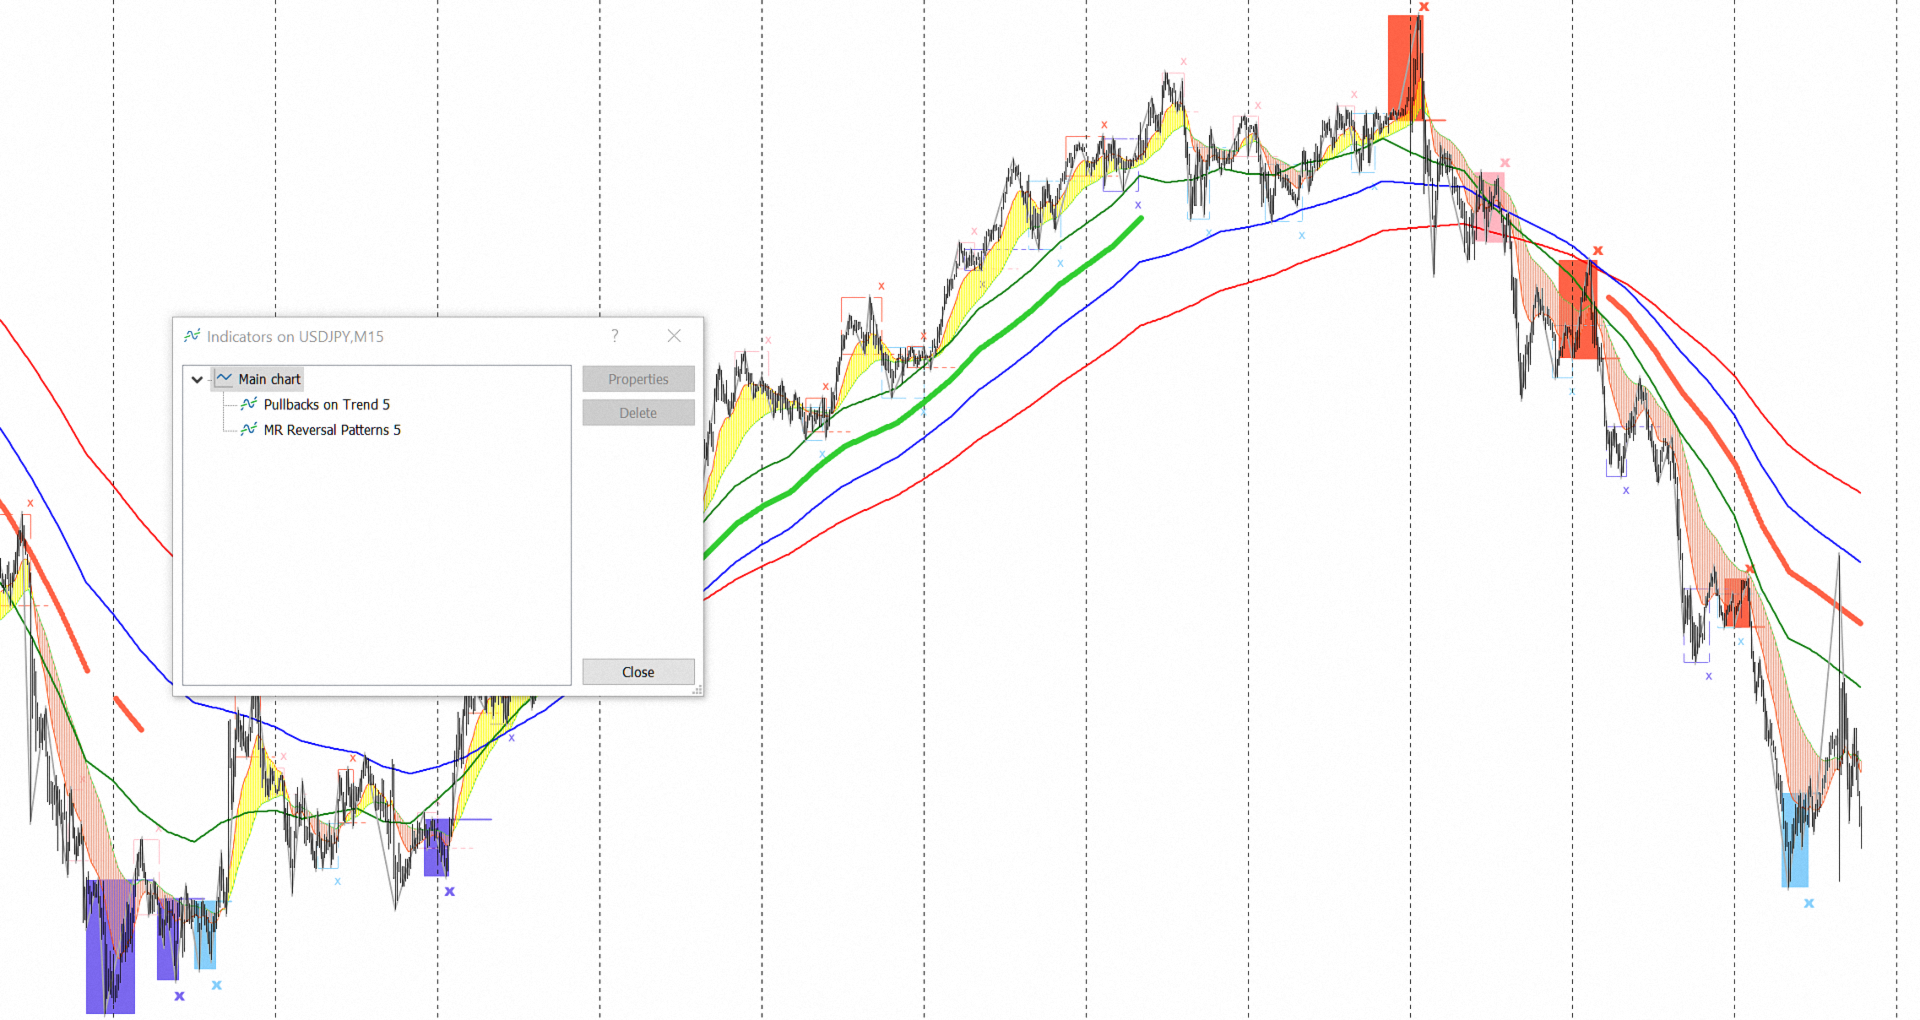
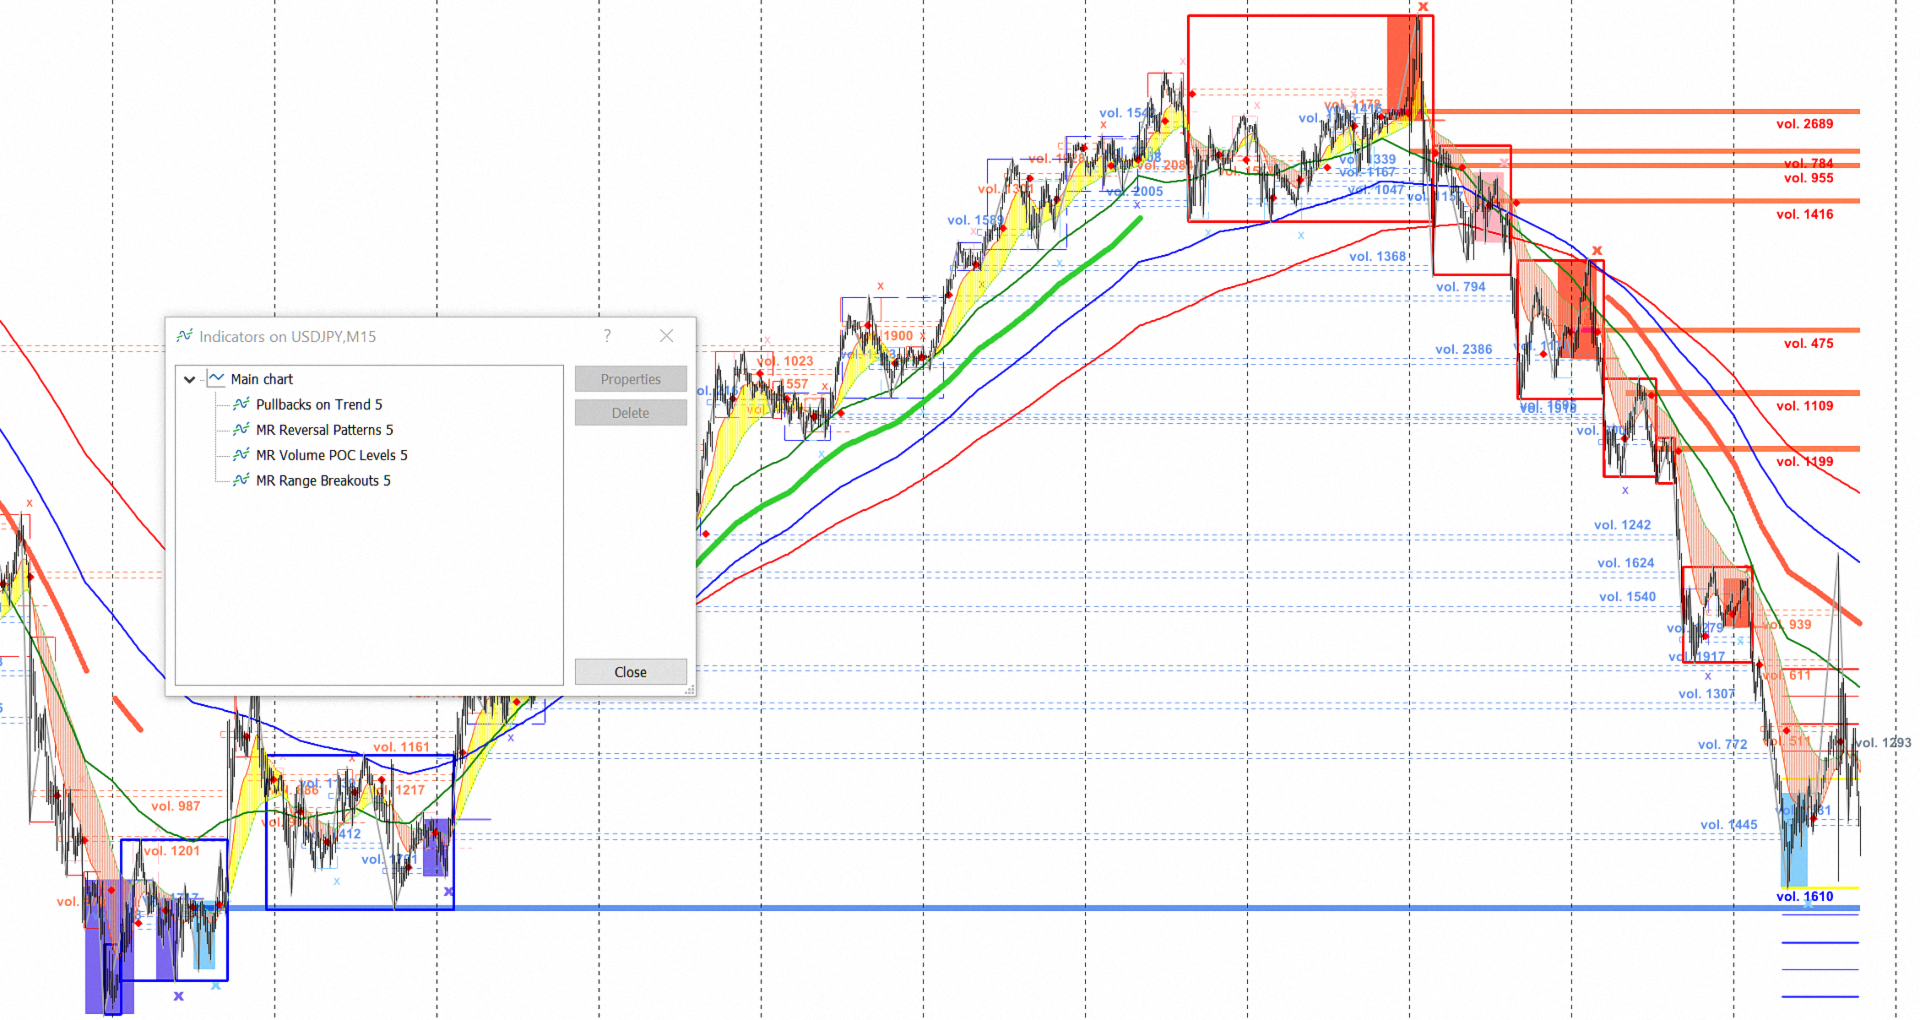
In combination with the “MR Reversal Patterns 5” indicator, you can accurately determine entry points in the direction of the trend, correctly place stop-losses, and lock in profits. The same applies to combinations with other indicators from the "Masters of Risk" ("MR Volume POC Levels 5", "MR Range Breakouts 5") series.


If you liked the indicator, please support our work by giving it 5 stars!

For MetaTrader 4 https://www.mql5.com/en/market/product/165103

How to use indicators - Article
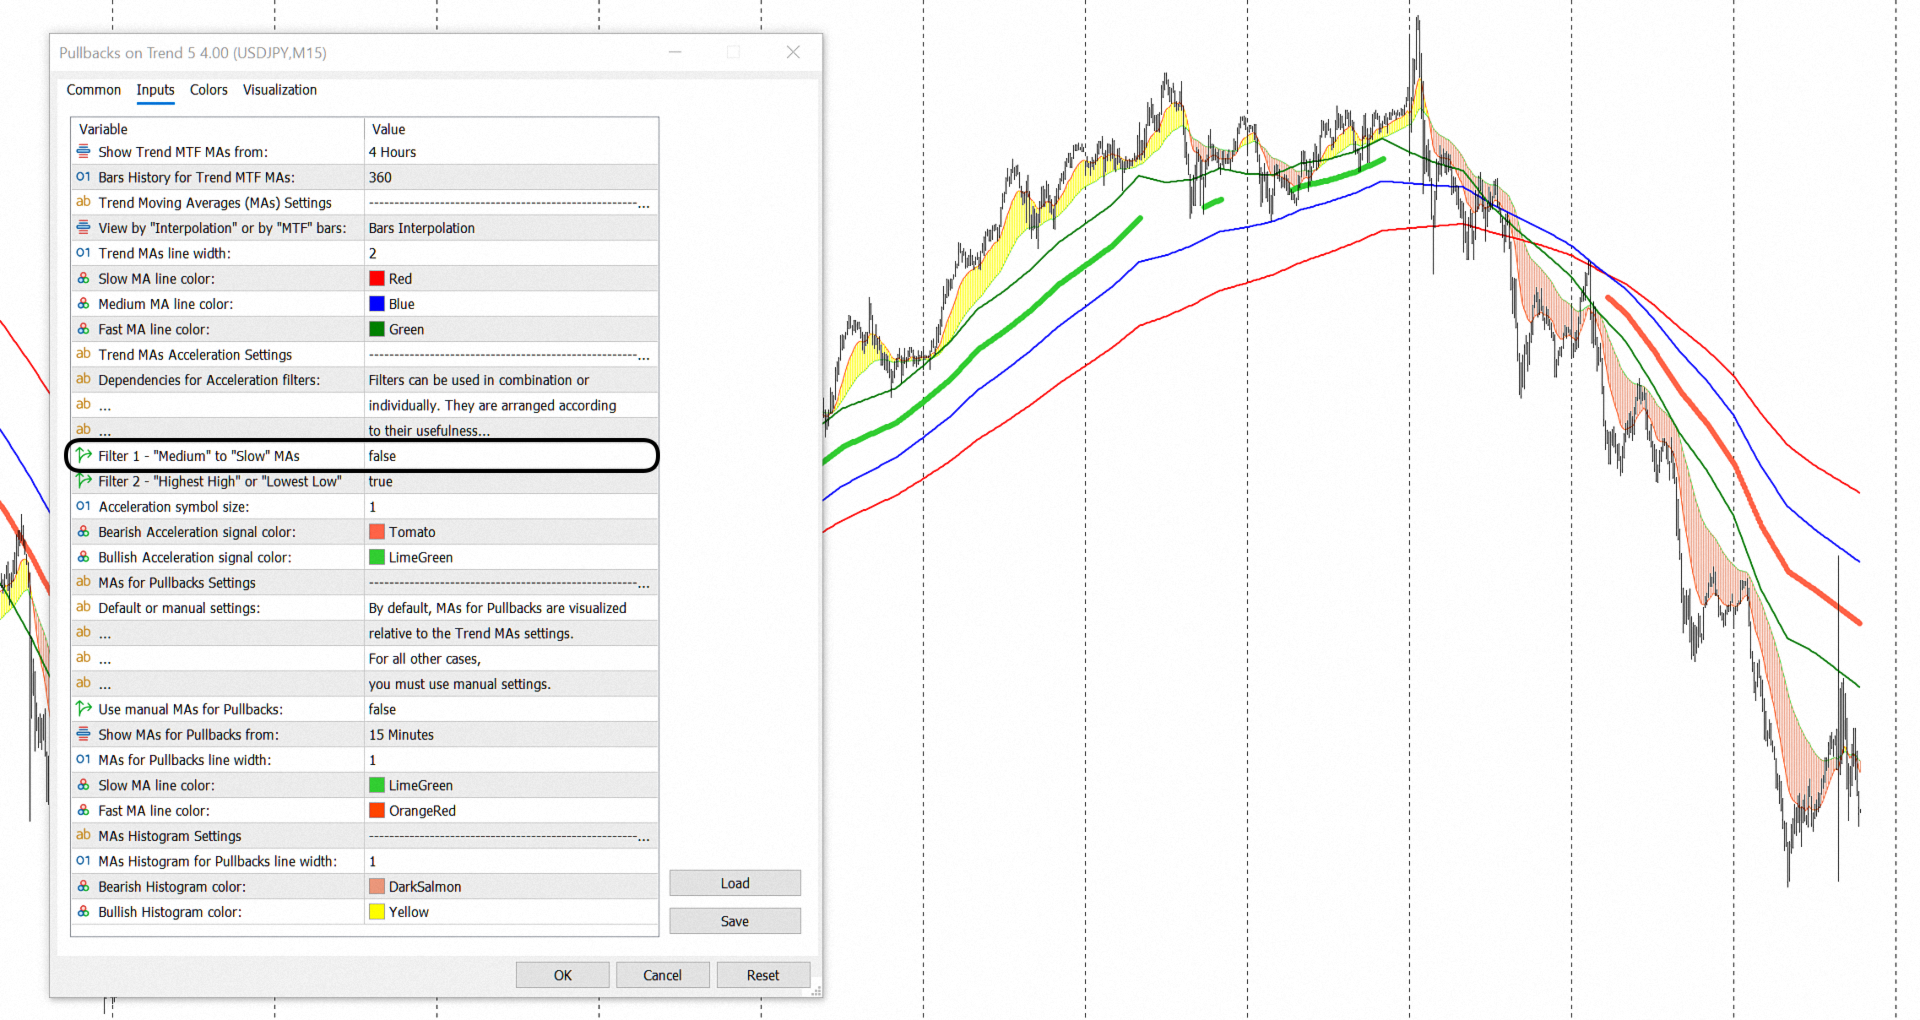
Indicator settings:

Show Trend MTF MAs from: - Multi-time frame on which the "Trend" Moving Averages (MAs) are calculated. By default, the indicator shows a "Trend" from the H4 time frame.
Bars History for Trend MTF MAs: - Number of bars on which the indicator works from multi-time frame H4.

Section Trend Moving Averages (MAs) Settings
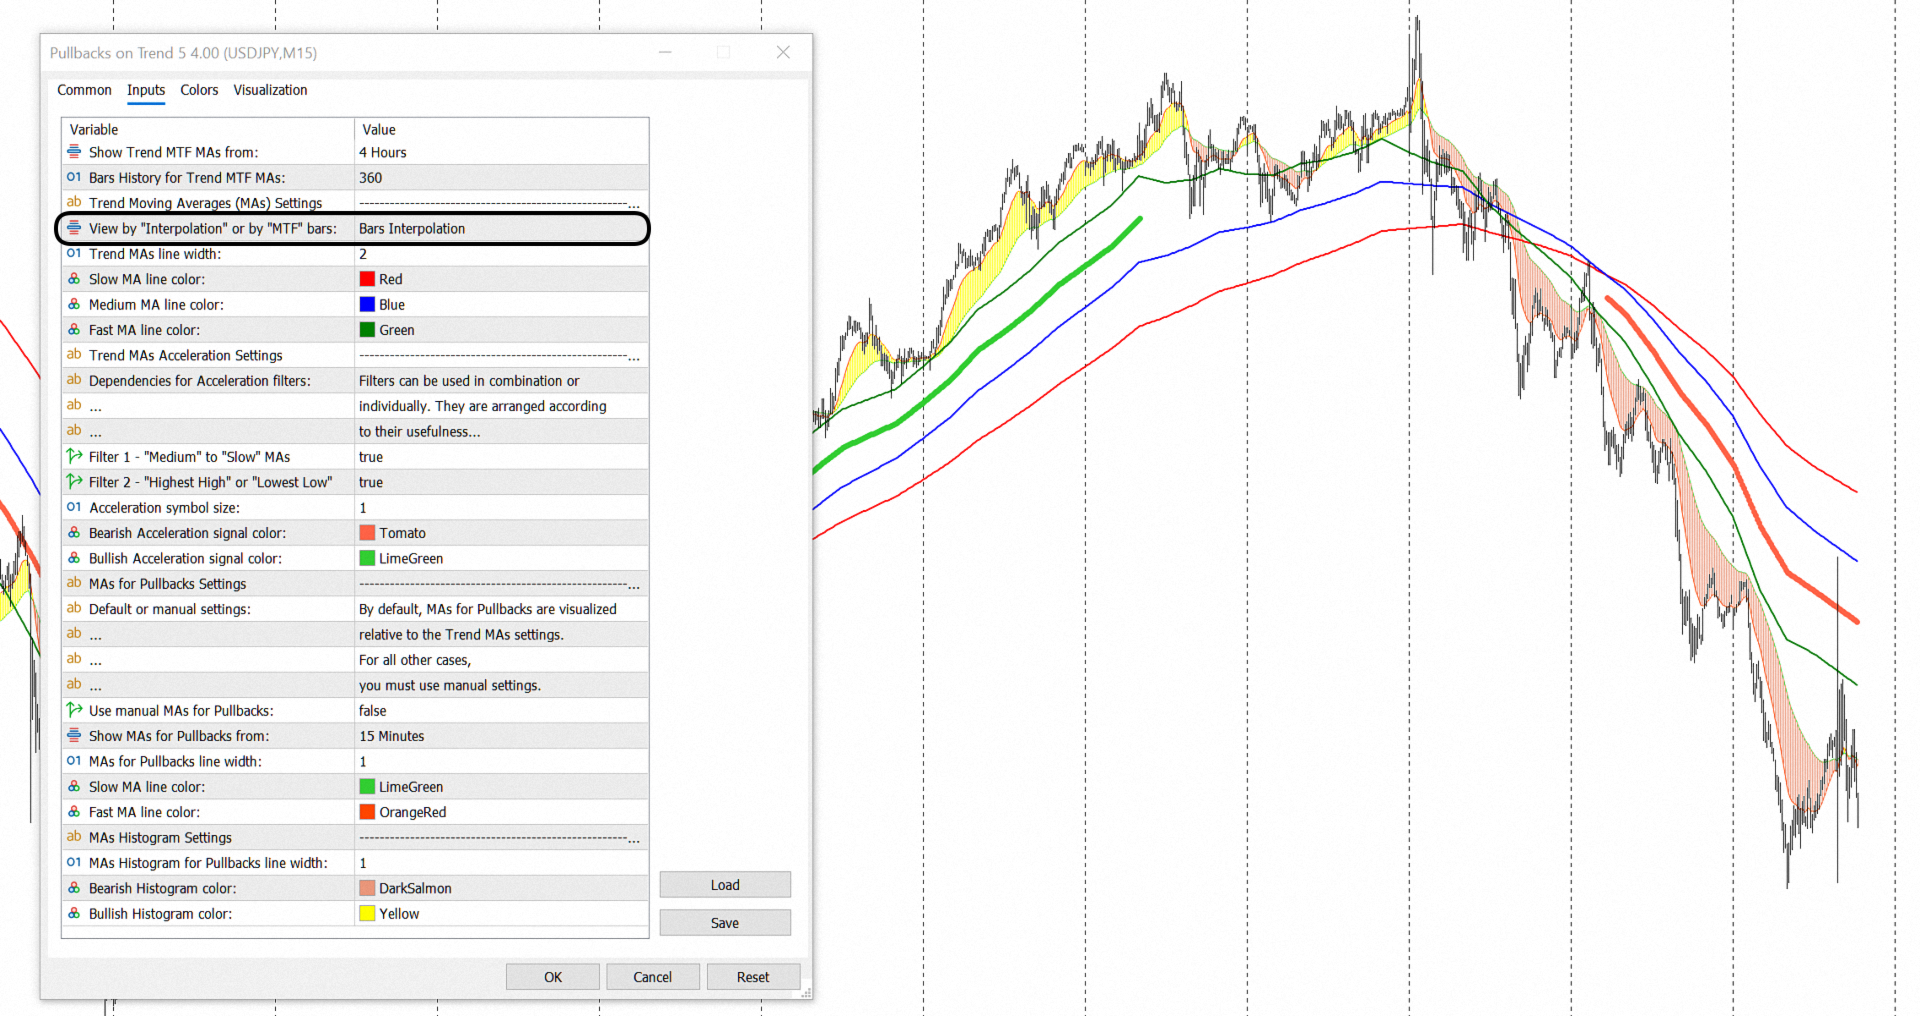
View by "Interpolation" or by "MTF" bars: - You choose the visualization method for moving averages. "Interpolation" view shows moving averages with smoothed lines. The "MTF" bars view displays moving averages, with stepped lines corresponding to the bars of the H4 time frame.
Trend MAs line width: - Width of the trend moving average line.
Slow MA line color: - Color of the Slow moving average line.
Medium MA line color: - Color of the Medium moving average line. 
Fast MA line color: - Color of the Fast moving average line.

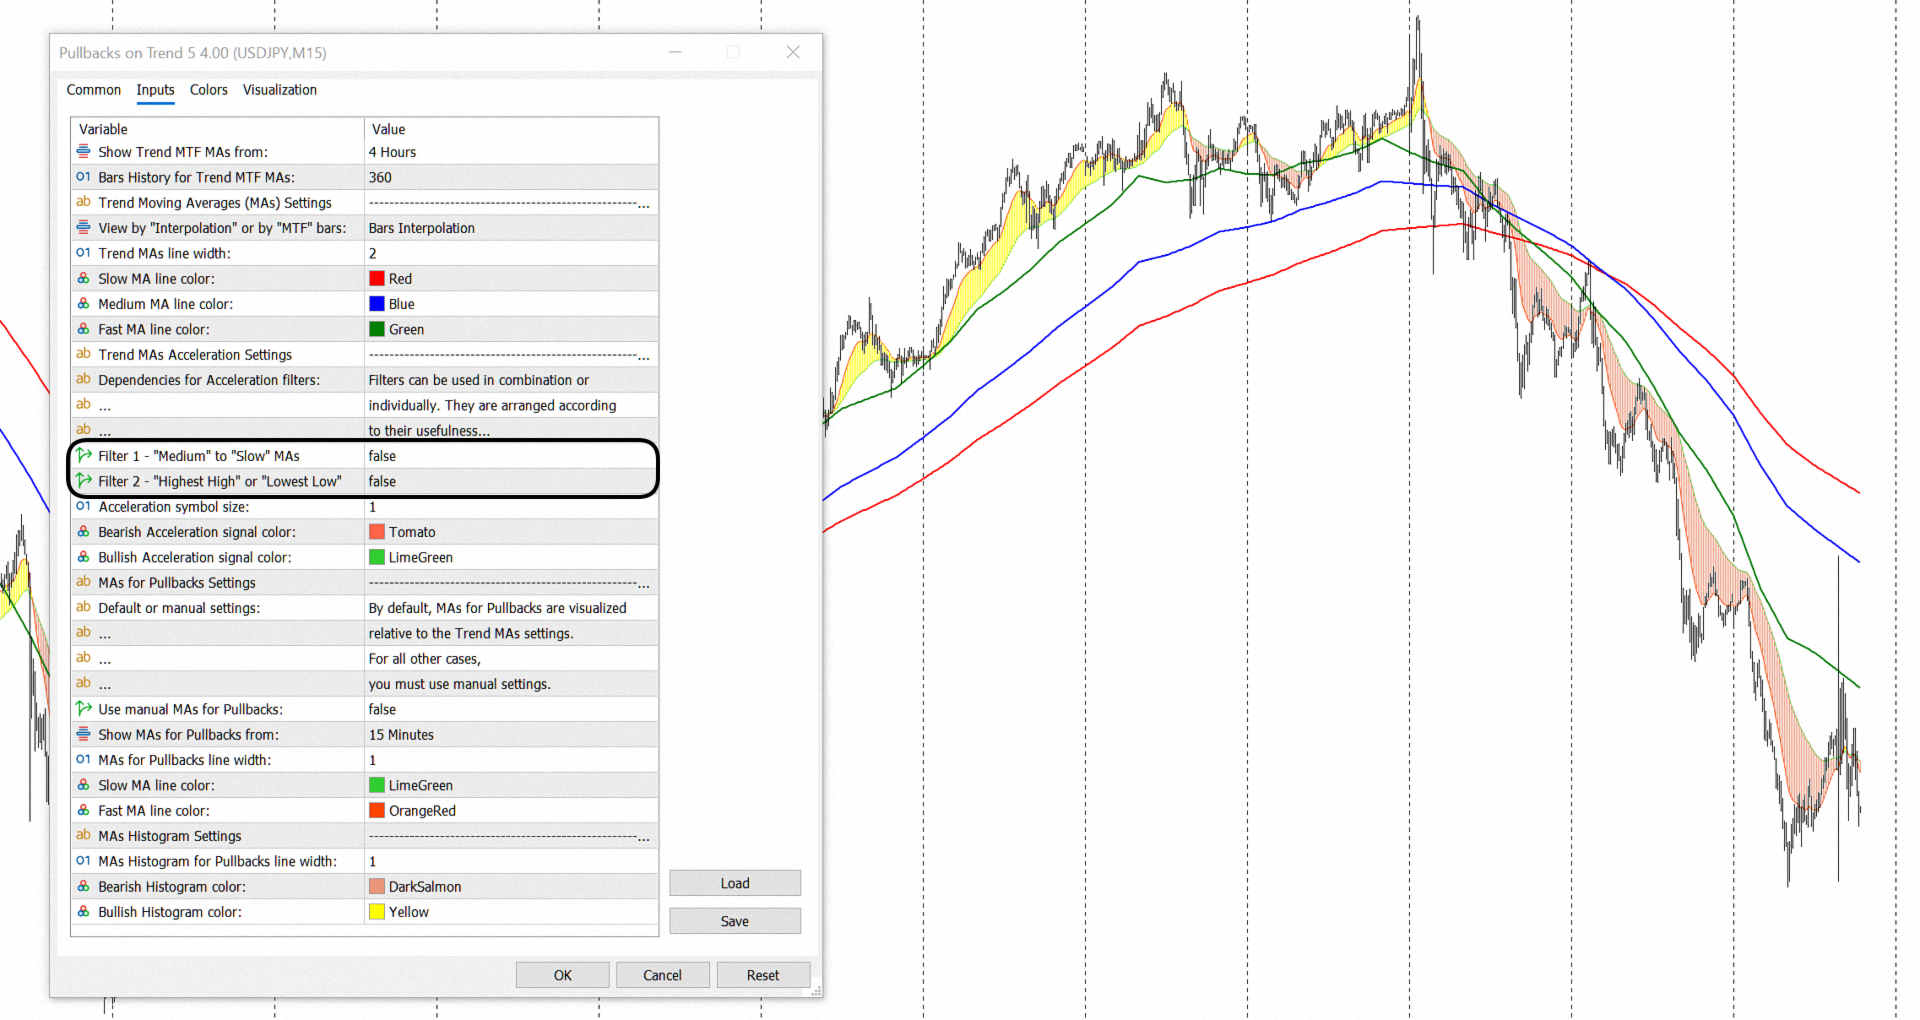
Section Trend MAs Acceleration Settings
Filter 1 - "Medium" to "Slow" MAs - Uses or does not use "Filter 1".
Filter 2 - "Highest High" or "Lowest Low" - Uses or does not use "Filter 2".
Acceleration symbol size: - Symbol size for "Acceleration" of moving averages.
Bearish Acceleration signal color: - Bearish "Acceleration" signal color.
Bullish Acceleration signal color: - Bullish "Acceleration" signal color. 

Section MAs for Pullbacks Settings
Use manual MAs for Pullbacks: - By default, the time frames for displaying moving averages that visualize the "Pullbacks" on the trend are set to the standard time frames in the MetaTrader terminal from which the trend is visualized. If you decide to use non-standard time frames in the terminal, then you will need to manually set the time frame for the moving averages for "Pullbacks".
Show MAs for Pullbacks from: - Multi-time frame on which the moving averages for "Pullbacks" are calculated.

Section MAs Settings
MAs for Pullbacks line width: - Width of the moving average line for "Pullbacks".
Slow MA line color: - Color of the Slow moving average line.
Fast MA line color: - Color of the Fast moving average line.

Section MAs Histogram Settings
MAs Histogram for Pullbacks line width: - Width of the "Histogram" line for "Pullbacks".
Bearish Histogram color: - Color of the bearish "Histogram".
Bullish Histogram color: - Color of the bullish "Histogram".

Prodotti consigliati
RBreaker
Zhong Long Wu
RBreaker Gold Indicators is a short-term intraday trading strategy for gold futures that combines trend following and intraday reversal approaches. It not only captures profits during trending markets but also enables timely profit-taking and counter-trend trading during market reversals. This strategy has been ranked among the top ten most profitable trading strategies by the American magazine   Futures Truth   for 15 consecutive years. It boasts a long lifecycle and remains widely used and st
Kingtrend
Antonio Blazquez
KingTrend — Price Action Trend Analysis Tool KingTrend is a trend-following indicator based on long-standing price action principles involving Highs, Lows, Open, and Close. The logic behind this tool comes from concepts passed on to me by my mentor and translated into code for consistent structure recognition. Features: Identifies market structure using price action logic Detects trend direction and key turning points Marks Higher Highs, Lower Lows, and extensions Suitable for discretionary or
##   ONLY GOLD ##   Тiльки Золото ## **Mercaria Professional Trading Zones - Complete Guide** ## **Mercaria Professional Trading Zones - Повний посібник** ### **How Mercaria Zones Work / Як працюють зони Mercaria** **English:** Mercaria Zones is an advanced trading indicator that identifies high-probability support and resistance areas using ZigZag extremes combined with mathematical zone calculations. The indicator works on multiple timeframes simultaneously, providing a comprehensive view
Inguz
Maxim Kuznetsov
Ing (inguz,ingwar) - the 23rd rune of the elder Futhark ᛝ, Unicode+16DD. Add some runic magic to your trading strategies. The correct marking of the daily chart will indicate to you the successful moments for counter-trend trading. Simple to use, has high efficiency in volatile areas. Be careful in lateral movements. Signals ᛝ are generated when the main lines of construction intersect. Red arrow down - recommended sales Blue up arrow - recommended purchases rare purple arrows indicate exce
Strumenti per il guadagno e la ricerca. Il nucleo dei segnali e della strategia di trading si basa sull'algoritmo dell'autore per la formazione di modelli di previsione dei prezzi. Applicabile a qualsiasi strumento! Integrato con un sistema di controllo basato sull'MA "Volpe a nove code" , aggiornando e regolando il segnale nel modo più accurato possibile per il mercato, lo strumento e il periodo di lavoro. Idoneo: tutti gli strumenti in tutti i mercati (ci sono eccezioni). A chi è rivolto: h
Gold Trader Pro is an advanced analytical tool specifically engineered for professional trading on XAUUSD (Gold). It provides an immediate comprehensive overview of market structure across 7 different timeframes, allowing traders to identify flow direction and signal strength through a modern, draggable, and interactive interface. Key Features Multi-Timeframe Analysis: Real-time monitoring of M1, M5, M15, M30, H1, H4, and D1. Two Operational Modes: MODE_SCALPING: Optimized for fast-paced analys
FREE
Italian Questo indicatore funge da assistente avanzato per l'analisi dei grafici per i trader che amano operare con i Pattern Grafici (Chart Patterns). È progettato per ridurre il carico dell'analisi visiva e aumentare la precisione nell'ottenere profitti. Caratteristiche principali di questo indicatore dal punto di vista dell'utilizzo pratico: 1. Rilevamento automatico dei pattern (Automated Pattern Detection) Risparmia tempo e riduce le distorsioni (Bias): Non è necessario tracciare manualment
Trade Extender
Loncey Duwarkah
5 (1)
Autonomously executes trades, overseeing the entire process from initiation to completion.  Free support via chat, email and remote assistance Originally built for XAUUSD (Gold). Settings changes for other symbols Powerful rules management Enhanced positioning features Risk Management / Dynamic lot sizing Quick Setup Symbols : XAUUSD Investment for all: Our trading bot is crafted to serve traders of all investment levels, ensuring accessibility to the forex market even for those with limited fu
WanaScalper
Isaac Wanasolo
1 (1)
A scalping indicator based on mathematical patterns, which on average gives signals with relatively small SL, and also occasionally helps to catch big moves in the markets (more information in the video) This indicator has three main types of notifications: The first type warns of a possible/upcoming signal on the next bar The second type indicates the presence of a ready signal to enter the market/open a position The third type is for SL and TP levels - you will be notified every time price re
Master Osi
Norapan Tonphim
OSS ULTIMATE ELITE 2026 – Institutional Smart Money System Stop chasing price. Start trading like smart money.  Why Traders Are Switching to OSS Elite Most indicators react after the move. OSS ULTIMATE ELITE is designed to help you position before the move happens. This is not just another signal tool — it’s a complete trading framework combining momentum, structure, and liquidity behavior.  What Makes This Different? Not lagging signals Not random arrows Not overfitted strategies  Built
L'indicatore costruisce le quotazioni attuali, che possono essere confrontate con quelle storiche e su questa base fanno una previsione del movimento dei prezzi. L'indicatore ha un campo di testo per una rapida navigazione fino alla data desiderata. Opzioni: Simbolo - selezione del simbolo che visualizzerà l'indicatore; SymbolPeriod - selezione del periodo da cui l'indicatore prenderà i dati; IndicatorColor - colore dell'indicatore; HorisontalShift - spostamento delle virgolette disegnate d
ALIEN Dashboard
Youssef Esseghaiar
ALIEN DASHBOARD FULL EDITION – Professional ICT & Precision Trading Dashboard for MT5 ( HYBRID ENGINE ) Overview The   Alien Dashboard Full Edition   is a comprehensive, all‑in‑one technical indicator for MetaTrader 5 that merges the most powerful concepts from Inner Circle Trader (ICT) methodology with advanced precision‑entry logic, multi‑timeframe analysis, and an intuitive on‑chart dashboard. Designed for serious traders who want to visualise institutional order flow, identify high‑probabili
Engulfing with EMAs Indicator Unlock the power of advanced candlestick pattern detection with the Engulfing with EMAs Indicator , a cutting-edge tool designed for MetaTrader 5. This futuristic indicator combines the precision of engulfing pattern analysis with the trend-following strength of Exponential Moving Averages (EMA 21 and EMA 50), empowering traders to identify high-probability setups across all currency pairs and timeframes. Key Features: Comprehensive Engulfing Detection : Detects b
Il livello Premium è un indicatore unico con una precisione superiore all'80% delle previsioni corrette! Questo indicatore è stato testato dai migliori Specialisti di Trading per più di due mesi! L'indicatore dell'autore che non troverai da nessun'altra parte! Dagli screenshot puoi vedere di persona la precisione di questo strumento! 1 è ottimo per il trading di opzioni binarie con un tempo di scadenza di 1 candela. 2 funziona su tutte le coppie di valute, azioni, materie prime, criptovalu
Multi-Timeframe PO3 Projection Multi-Timeframe PO3 Projection is a clean and practical MetaTrader 5 indicator designed to project multiple higher-timeframe candles directly on your active chart. Instead of switching between H1, H4, D1, and other higher timeframes, this indicator lets you view their live candle structure side by side. It helps traders track the current higher-timeframe open, high, low, close, and candle direction while staying on the chart timeframe they are actively trading. The
# DRAWDOWN INDICATOR V4.0 - The Essential Tool to Master Your Trading ## Transform Your Trading with a Complete Real-Time Performance Overview In the demanding world of Forex and CFD trading, **knowing your real-time performance** isn't a luxury—it's an **absolute necessity**. The **Drawdown Indicator V4.0** is much more than a simple indicator: it's your **professional dashboard** that gives you a clear, precise, and instant view of your trading account status. --- ## Why This Indicator
DAILY OH/OL SDEV QUANT MODEL - STATISTICAL TRADING WITH PRECISION RISK MANAGEMENT TRADE WITH MATHEMATICAL CERTAINTY - KNOW YOUR EXACT STOP-LOSS AND TAKE-PROFIT BEFORE YOU ENTER This indicator analyzes 5,000+ days of price history to give you: Exact entry levels (sigma bands locked at daily open) Exact stop-loss distance (from M
STRICTLY FOR BOOM INDEX ONLY!!!!! Here I bring the Maximum Trend Arrows OT1.0 MT5 indicator. This indicator is made up of a combination of different trend indicators for entries and exits, for entries an orange arrow will paint on the chart below the current market and a red flag for closing of trades and it produces buy arrows only. When the orange arrow appears, it will appear along with it's sound to notify you. The 1H timeframe is recommended, don't use it anywhere else than on the 1H timefr
MercariaPattern1-2-3 відстежує рух ціни, знаходить трьоххвильові структури 1-2-3 та підсвічує момент, коли сценарій підтверджується пробоєм ключового рівня. MercariaPattern1-2-3 tracks price movement, detects three-leg 1-2-3 structures and highlights the moment when the scenario is confirmed by a key level breakout. Індикатор збирає локальні свінги в компактну фігуру 0–1–2–3 , чекає підтвердженого пробою та будує стрілку входу з готовими рівнями SL/TP. The indicator combines local swings into a
Market Maestro: Your Ideal Partner for Automated Forex Trading If you're looking for a reliable assistant for trading in the currency market, Market Maestro is exactly what you need. This modern Forex bot is built using the latest technologies and algorithms, allowing it to effectively analyze market data and make informed trading decisions in real-time. Key Features of Market Maestro 1. Multicurrency Capability for Broad Opportunities Market Maestro can work with a wide range of currency pairs,
PipFinite Trend PRO MT5
Karlo Wilson Vendiola
4.84 (557)
Breakthrough Solution For Trend Trading And Filtering With All Important Features Built Inside One Tool! Trend PRO's smart algorithm detects the trend, filters out market noise and gives entry signals with exit levels. The new features with enhanced rules for statistical calculation improved the overall performance of this indicator. Important Information Revealed Maximize the potential of Trend Pro, please visit www.mql5.com/en/blogs/post/713938 The Powerful Expert Advisor Version Automatin
HAS RSI Signal — Indicatore di Tendenza Professionale con Calcolo SL/TP HAS RSI Signal è un potente strumento di trading che combina classici intramontabili con moderni algoritmi di filtraggio del rumore. L'indicatore analizza il mercato attraverso le candele Heiken Ashi Smoothed (HAS) e l'oscillatore RSI , fornendo al trader segnali di ingresso chiari durante le inversioni di tendenza o l'uscita dalle zone di ipercomprato/ipervenduto. Vantaggi Principali: Doppio Filtraggio: L'uso di Heiken Ashi
Connors PercentB
MATTHEW STAN WILLS
Larry Connors TPS – PercentB - (Bollinger Band %) A professional implementation of Larry Connors' Percent B strategy, designed to systematically capture high-probability short-term reversals in equity markets. This system uses the Bollinger Band %b indicator to identify when price has moved to a statistical extreme relative to its recent volatility envelope. When %b drops near zero, price is at or below the lower Bollinger Band — a quantified oversold condition that this EA captures with discipl
The Hybrid Trend Impulse indicator is an advanced tool that combines modern approaches to trend and impulse analysis, offering unique capabilities for effective deposit management. Key advantages of the HybridTrendImpulse_indicator: Nonlinear dynamics: The method of interaction between opening prices forms a unique nonlinear model that is particularly sensitive to significant price fluctuations, increasing their significance and making the indicator ideal for working in high volatility conditio
# RSI Pro Alert - Advanced RSI Indicator A powerful professional-grade RSI indicator with intelligent alerts, scheduled snapshots, and multi-dimensional notifications to help you capture market opportunities with precision! --- ## Key Features ### Smart Signal Detection - **Precision Cross Detection** : Automatically identifies critical moments when RSI crosses overbought/oversold levels - **State Tracking Mechanism** : Real-time monitoring of market state changes (Overbought/Overso
AltoX Spirol Indicator
Lesley Mthandazo Khulumo
AltoX Capital Spirol Indicator brings professional‐grade, pattern‐based signals to your MT5 charts in a single, easy-to-use tool. Advantages & Key Benefits •   Clear, Actionable Signals Automatically plots buy/sell arrows when your custom Spirol pattern completes on a closed bar—no guessing whether a signal is valid. •   Built-In Trend Filter •   Automatic Reference Levels Draws Retracement lines  for quick visual pullback targets. •   Real-Time Alerts Popup alerts in MT5 plus mobile push noti
https://youtu.be/JJanqcNzLGM ,  https://youtu.be/l70MIHaQQa4 ,  https://youtu.be/pg0oiT5_8y0   Automated Supply and Demand Trading Edge MT5. These videos demonstrate how we apply the supply and demand system to our latest trading review and market analysis Enhance your Trading Strategy with the Supply and Demand Trading Edge MT5. Gain a competitive market advantage with the Supply and Demand Trading Edge MT5 indicator, a powerful tool that combines MACD signals with supply and demand zones. By
PipFinite Exit EDGE MT5
Karlo Wilson Vendiola
4.88 (32)
Did You Have A Profitable Trade But Suddenly Reversed? In a solid strategy, exiting a trade is equally important as entering. Exit EDGE helps maximize your current trade profit and avoid turning winning trades to losers. Never Miss An Exit Signal Again Monitor all pairs and timeframes in just 1 chart www.mql5.com/en/blogs/post/726558 How To Trade You can close your open trades as soon as you receive a signal Close your Buy orders if you receive an Exit Buy Signal. Close your Sell orders if
Naked Forex Big Shadow indicator for MT5
Renaud Herve Francois Candel
5 (1)
Naked Forex Big Shadow Indicator Big Shadow Indicator is a pattern recognition indicator for Forex, Stocks, Indices, Futures, Commodities and Cryptos. When you have a Big Shadow on your chart then this is a strong signal meaning that you might be ahead of a reversal. You can take other elements (momentum, trend, volatility, price action, fundamentals) to build a complete strategy and confirm your entries. Beware that you might not make money just following the arrows generated by the pattern re
Candle Pattern Finder MT5
Pavel Zamoshnikov
4.2 (5)
This indicator searches for candlestick patterns. Its operation principle is based on Candlestick Charting Explained: Timeless Techniques for Trading Stocks and Futures by Gregory L. Morris. If a pattern is detected, the indicator displays a message at a bar closure. If you trade using the MetaTrader 4 terminal, then you can download the full analogue of the " Candle Pattern Finder for MT4 " indicator It recognizes the following patterns: Bullish/Bearish (possible settings in brackets) : Hammer
Gli utenti di questo prodotto hanno anche acquistato
ARIPoint
Temirlan Kdyrkhan
ARIPoint is a powerful trading companion designed to generate high-probability entry signals with dynamic TP/SL/DP levels based on volatility. Built-in performance tracking shows win/loss stats, PP1/PP2 hits, and success rates all updated live. Key Features: Buy/Sell signals with adaptive volatility bands Real-time TP/SL/DP levels based on ATR Built-in MA Filter with optional ATR/StdDev volatility Performance stats panel (Success, Profit/Loss, PP1/PP2) Alerts via popup, sound, push, or email Cu
SignalTech MT5 is a fully rule based trading system for EURUSD, USDCHF, USDJPY, AUDUSD, NZDUSD, EURJPY, AUDJPY, NZDJPY, CADJPY.  All the winning trades with chart setups are published on the comments page. 2025-12 1174 Pips 2026-01 2624 Pips 2026-02 2937 Pips 2026-03 2165 Pips 2026-04 2243 Pips It can generate signals with Buy/Sell Arrows and Pop-Up/Sound Alerts. Each signal has clear Entry and Stop Loss levels, which should be automatically flagged on the chart, as well as potential Targets 1,
Azimuth Pro
Ottaviano De Cicco
5 (7)
Azimuth Pro V2: Synthetic Fractal Structure and Confirmed Entries for MT5 Overview Azimuth Pro is a multi-level swing structure indicator by Merkava Labs . Four nested swing layers, swing-anchored VWAP, ABC pattern detection, three-timeframe structural filtering, and closed-bar confirmed entries — one chart, one workflow from micro-swings to macro-cycles. This is not a blind signal product. It is a structure-first workflow for traders who care about location, context, and timing. V2 Launch Offe
Innanzitutto, vale la pena sottolineare che questo Strumento di Trading è un Indicatore Non-Ridipingente, Non-Ridisegnante e Non-Laggante, il che lo rende ideale per il trading professionale. Corso online, manuale utente e demo. L'Indicatore Smart Price Action Concepts è uno strumento molto potente sia per i nuovi che per i trader esperti. Racchiude più di 20 utili indicatori in uno solo, combinando idee di trading avanzate come l'Analisi del Trader del Circolo Interno e le Strategie di Tradin
KT Alpha Hunter Arrows MT5
KEENBASE SOFTWARE SOLUTIONS
La maggior parte degli indicatori a frecce ti dà un segnale e poi ti lascia capire da solo tutto il resto. KT Alpha Hunter Arrows ti offre un piano di trading completo. Ogni freccia di segnale appare con un piano completo già disegnato: linea di ingresso, stop loss, quattro livelli di take profit e un verdetto live sull’edge, che ti indica se quel simbolo e quel timeframe meritano davvero di essere tradati in quel momento. Il Trade Manager EA incluso gestisce l’esecuzione dopo il tuo ingresso, c
Gem SIGNAL
Shengzu Zhong
GEM Signal Pro GEM Signal Pro è un indicatore trend-following per MetaTrader 5, progettato per i trader che desiderano segnali più chiari, configurazioni operative più strutturate e una gestione del rischio più pratica direttamente sul grafico. Invece di mostrare solo una semplice freccia, GEM Signal Pro aiuta a presentare l’intera idea di trading in modo più chiaro e leggibile. Quando le condizioni sono confermate, l’indicatore può mostrare sul grafico il prezzo di ingresso, lo stop loss e gli
RelicusRoad Pro MT5
Relicus LLC
4.96 (24)
RelicusRoad Pro: Sistema Operativo Quantitativo di Mercato 70% DI SCONTO ACCESSO A VITA (TEMPO LIMITATO) - UNISCITI A 2.000+ TRADER Perché la maggior parte dei trader fallisce anche con indicatori "perfetti"? Perché operano su Singoli Concetti isolati. Un segnale senza contesto è una scommessa. Per vincere serve CONFLUENZA . RelicusRoad Pro non è un semplice indicatore. È un Ecosistema Quantitativo completo . Mappa la "Fair Value Road", distinguendo tra rumore e rotture strutturali. Smetti di in
OmniSync Projection
Antonio-alin Teculescu
5 (1)
Chronos Fractal Engine is an innovative price projection indicator for MetaTrader 5, designed to transform your technical analysis by intelligently identifying and projecting historical price patterns. Built upon an advanced correlation algorithm and the fractal principles of the market, this powerful tool visualizes potential future price movements, giving you a unique edge in your trading decisions. What is Chronos Fractal Engine? At its core, the Chronos Fractal Engine employs a sophisticat
Rilevatore intelligente multistrato di breakout e pullback per MetaTrader 5 "Intelligente. Semplice. Veloce!" Sei stanco di perdere entrate su breakout ad alta probabilità? Passi ore a scansionare più grafici, cercando di allineare i breakout con la direzione del trend e il momentum delle valute — solo per perdere il movimento? Break Pullback risolve tutto questo con un solo indicatore. Cos'è Break Pullback? Break Pullback è un indicatore MetaTrader 5 di livello professionale, progettato speci
ARICoins
Temirlan Kdyrkhan
ARICoin is a powerful trading companion designed to generate high-probability entry signals with dynamic TP/SL/DP levels based on volatility. Built-in performance tracking shows win/loss stats, PP1/PP2 hits, and success rates all updated live. Key Features: Buy/Sell signals with adaptive volatility bands Real-time TP/SL/DP levels based on ATR Built-in MA Filter with optional ATR/StdDev volatility Performance stats panel (Success, Profit/Loss, PP1/PP2) Alerts via popup, sound, push, or email Cust
==================================================================== SMC Pro v6.1 APEX AI — XAUUSD Gold Empire MetaTrader 5 Indicator · Smart Money Concepts · Predictive Intelligence Engine ==================================================================== SMC Pro v6.1 APEX AI is a professional Smart Money Concepts indicator system built exclusively for XAUUSD (Gold) on MetaTrader 5. It combines the complete SMC framework — Order Blocks, Liquidity sweeps, Fair Value Gaps, Break of Structure,
Meravith MT5
Ivan Stefanov
5 (1)
Strumento per market maker. Meravith: Analizzerà tutti i timeframe e mostrerà il trend attualmente in corso. Evidenzierà le zone di liquidità (equilibrio dei volumi) dove i volumi rialzisti e ribassisti sono uguali. Mostrerà tutti i livelli di liquidità dei diversi timeframe direttamente sul grafico. Genererà e presenterà un’analisi di mercato testuale a scopo di riferimento. Calcolerà obiettivi, livelli di supporto e punti di stop-loss in base al trend attuale. Calcolerà il rapporto rischio/ren
L'indicatore " Dynamic Scalper System MT5 " è progettato per il metodo di scalping, ovvero per il trading all'interno di onde di trend. Testato sulle principali coppie di valute e sull'oro, è compatibile con altri strumenti di trading. Fornisce segnali per l'apertura di posizioni a breve termine lungo il trend, con ulteriore supporto al movimento dei prezzi. Il principio dell'indicatore. Le frecce grandi determinano la direzione del trend. Un algoritmo per generare segnali per lo scalping sott
L'indicatore UZFX {SSS} Scalping Smart Signals MT5 è un indicatore di trading ad alte prestazioni che non si aggiorna (non repaint) progettato per scalper, day trader e swing trader che necessitano di segnali accurati e in tempo reale in mercati in rapida evoluzione. Sviluppato da (UZFX-LABS), questo indicatore combina l'analisi dell'andamento dei prezzi, la conferma del trend e un filtraggio intelligente per generare segnali di acquisto e vendita ad alta probabilità su tutte le coppie di valute
Gold Xausd Hunter
Metin Erkamoglu
5 (1)
MATADOR GOLD — XAUUSD M5 ( TimeFrame M5 ) Scalp Signals for MT5 Strategy Tester Visualization Video https://youtu.be/_cWbbyg2RSs Not every move deserves a signal. MATADOR GOLD was built for traders who prefer selective, structured, high-quality decision support over noisy, hyperactive signal tools. Designed specifically for Gold (XAUUSD / GOLD) on M5 , MATADOR helps you read short-term momentum with more discipline by combining trend logic, market-condition filters, momentum timing, spread pro
Ziva LSE System
Hassan Abdullah Hassan Al Balushi
ZIVA LSE System A Professional Liquidity & Structure Execution Framework Executive Overview ZIVA LSE System is a professionally engineered analytical framework designed to interpret market behavior through structural logic and liquidity dynamics. It is not positioned as a conventional indicator. Rather, it functions as a structured execution environment that organizes price action into a clear, disciplined decision-making model. The system is built to deliver consistency, clarity, and controlled
AriX
Temirlan Kdyrkhan
1 (4)
AriX Indicator for MT5 A powerful trend-following and signal-evaluation tool AriX is a custom MT5 indicator that combines Moving Averages and ATR-based risk/reward logic to generate clear buy/sell signals. It visualizes dynamic SL/TP levels, evaluates past trade outcomes, and displays win/loss statistics in a clean on-chart panel. Key features include: Buy/Sell signals based on MA crossovers ATR-based SL/TP1/TP2/TP3 levels with visual lines and labels Signal outcome tracking with real-time stat
Assembler
Darko Licardo
5 (1)
Introducing Assembler:  The best value for money,  Designed for advanced traders and professionals, yet accessible for ambitious beginners ready to elevate their trading game. Great for ICT, SMC, TREND and breakout traders . Combining advanced analytics, a sleek graphical interface, and highly customizable features, Assembler empowers you to trade with precision, clarity, and confidence. Key Features of Assembler 1. Dynamic Graphical User Interface (GUI): A fully draggable, customizable interf
Scalping Winning Signals Pro SWS
Muhammad Usman Siddique
5 (1)
UZFX SWS {Scalping Winning Signals} Pro v1.0 è un potente indicatore non ridipingente sviluppato da Usman Zabir (UZFX LABS) appositamente per scalper, day trader e swing trader alla ricerca di segnali di ingresso precisi in mercati in rapido movimento. Ideale per i trader che richiedono segnali affidabili e in tempo reale senza ritardi o false ridipinture. I MIEI INTERVALLI DI TEMPO CONSIGLIATI*: 30 M E OLTRE. {1H} È IL MIO PREFERITO. E I RISULTATI SONO SORPRENDENTI...! Nota: combinatelo con l'
+++++++++++++++++++++++++++++++++++++++++++++++++++++++++++++++++++++++++++++++++++++++++++++++++ +++ Link to EURUSD Only Free Version -->  https://www.mql5.com/en/market/product/156904?source=Unknown +++++++++++++++++++++++++++++++++++++++++++++++++++++++++++++++++++++++++++++++++++++++++++++++++ Hallo Trader, This is a traditional GANN & FIBONACCI strategy based on detection of an impulsive move in the opposite direction. This is called a Breakout. At the moment of Breakout, the indicator draw
The Zone Trading Indicator is a technical analysis tool for MetaTrader 5 that automatically identifies and displays tradable price zones across multiple timeframes to assist with structured market analysis. The indicator plots Monthly, Weekly, Daily, and H4 tradable zones , allowing traders to view higher- and lower-timeframe price areas simultaneously. These zones are designed to support one-candle–based entry approaches by highlighting predefined areas where price interaction may be monitored.
I concetti alla base di questo indicatore, che gli conferiscono un vantaggio unico e incisivo, si fondano sulla "TEORIA" dei FAIR VALUE GAPS, ideata e sviluppata da Arjo, uno dei migliori mentori del settore. Io stesso ho contribuito allo sviluppo dei concetti spiegati. La serie di video includerà link originali a YouTube per spiegazioni complete e approfondite, oltre a screenshot del sistema MT4/MT5 in esecuzione. Tutti i sistemi pubblicati saranno disponibili separatamente per MT4 e MT5, per a
A1rum In1 Target V1 è un indicatore di trading ibrido intelligente progettato per semplificare la direzione del mercato, l’analisi delle zone e la qualità dei segnali in un dashboard professionale. Creato per trader che desiderano grafici più puliti e decisioni più rapide, questo indicatore combina bias di trend, mappatura delle zone, conferma del timing e scoring dinamico in un unico sistema. Caratteristiche principali Smart BUY / SELL signal detection Dynamic signal strength meter Professional
MightyPips Sentiment Pro is a market sentiment indicator for MetaTrader 5 designed to help traders analyze buying and selling pressure in the market. The indicator evaluates market behavior to provide a clearer view of trend direction, momentum strength, and overall sentiment conditions. It helps traders understand whether buyers or sellers are currently dominating the market. Features Buyer vs Seller Analysis Displays the balance between buying and selling pressure using real-time market data.
Presenting one-of-a-kind Gann Indicator for XAUUSD IQ Gold Gann Levels is a non-repainting, precision tool designed exclusively for XAUUSD/Gold intraday trading. It uses W.D. Gann’s square root method to plot real-time support and resistance levels, helping traders spot high-probability entries with confidence and clarity. William Delbert Gann (W.D. Gann) was an exceptional market analyst whose trading technique was based on a complex blend of mathematics, geometry, astrology, and ancient calcul
The Propfolio Master Suite is the ultimate all-in-one analytical workstation for professional traders. Combining the power of the Beat The Market Maker (BTMM) methodology, Smart Money Concepts (SND/Liquidity), and Advanced Volume Profile, this suite replaces multiple different indicators with one optimized engine. Monitor up to 14 pairs simultaneously from a single chart, instantly identify market cycles, and seamlessly map institutional footprints with the click of a button. The Command Center
First time on MetaTrader, introducing IQ Star Lines - an original Vedic Astrology based indicator. "Millionaires don't use astrology, billionaires do" . - J.P. Morgan, Legendary American financier and banker. Welcome to  the new and updated  IQ Star Lines , the ultimate fusion of ancient planetary harmonic cycles and modern quantitative trading. published for the   first time on Metatrader. This is an indicator built by the developer, who has spent almost 2 decades trading while studying Vedic
Pantera Indicator
Temirlan Kdyrkhan
5 (1)
A tool for on-chart strategy backtesting and performance analysis. A utility for developing, debugging, and testing custom trading ideas and indicator functions. An indicator designed to quickly test trading concepts and visualize the effectiveness of different input parameters. An all-in-one sandbox for testing everything from simple crossovers to complex, multi-condition trading systems.
Shogun Trade Pro
Yuki Miyake
5 (2)
SHOGUN Trade Pro – 16 Years of Unadjusted Precision. https://www.mql5.com/en/market/product/176984 Strategic Market Structure & the Mastery of "Small Losses, Big Profits." March Special Sale – Special Price:  (Regular Price: $299)! This special offer is for a limited time only. We are currently focusing on further product development and optimization. To incorporate valuable feedback from our users into the product, we are offering this discounted price on the condition of your cooperation wi
Niveaux mensuels + PinBar + Marubozu + ALERTES (MQL5) Version : 2.0 FINAL Auteur : KOUAME N'DA LEMISSA See More Description du produit Cet indicateur avancé pour MetaTrader 5 combine l'analyse des niveaux mensuels, la reconnaissance des modèles de chandeliers japonais (PinBar et Marubozu) et un système d'alerte en temps réel. Il aide les traders à identifier rapidement les zones clés du marché et les opportunités de trading à forte probabilité. Caractéristiques principales Affichage automatiqu
Altri dall’autore
Candlesticks MTF 5
Svetoslav Boyadzhiev
"Candlesticks MTF 5" is an informational indicator that displays "Japanese Candlesticks" . The indicator analyzes and determines the opening and closing times of candles from higher time frames.  An algorithm has been developed for the "Candlesticks MTF 5" indicator that corrects the discrepancy between the opening and closing times of candles from higher time frames. For example, if the opening time of a candle on a weekly time frame is the 1st of the month, and on the smaller time frame this
FREE
Candlesticks MTF 4
Svetoslav Boyadzhiev
"Candlesticks MTF 4" is an informational indicator that displays "Japanese Candlesticks" . The indicator analyzes and determines the opening and closing times of candles from higher time frames.  An algorithm has been developed for the "Candlesticks MTF 4" indicator that corrects the discrepancy between the opening and closing times of candles from higher time frames. For example, if the opening time of a candle on a weekly time frame is the 1st of the month, and on the smaller time frame this
FREE
"Impulses and Corrections 4" is created to help traders navigate the market situation. The indicator shows multi-time frame upward and downward "Impulses" of price movements. These impulses are the basis for determining the "Base" , which is composed of zones of corrections of price movements, as well as "Potential" zones for possible scenarios of price movement. Up and down impulses are determined based on a modified formula of Bill Williams' "Fractals" indicator. The last impulse is always "U
Pullbacks on Trend 4
Svetoslav Boyadzhiev
"Pullbacks on Trend 4" is designed to help traders navigate the market situation. The indicator displays three multi-time frame moving averages that describe the "Trend" of price movements of financial instruments. Depending on the time frame you choose to display the trend, you can automatically see the structure of the trend on a lower time frame from its price movements and pullbacks using the histogram between two additional moving averages. Additionally, filters have been added to show the
"Volumes and Sentiments 4" was created to help traders navigate market situations. This indicator is the result of many years of research and understanding of the nature of market movements. It is a modified version of the "On-Balance Volume" indicator, which corrects some imperfections of the original indicator. "Volumes and Sentiments 4" includes additional ideas (the author's) that visually show the sentiments of market participants. The important advantages of the indicator are the followin
"Impulses and Corrections 5" is created to help traders navigate the market situation. The indicator shows multi-time frame upward and downward "Impulses" of price movements. These impulses are the basis for determining the "Base" , which is composed of zones of corrections of price movements, as well as "Potential" zones for possible scenarios of price movement. Up and down impulses are determined based on a modified formula of Bill Williams' "Fractals" indicator. The last impulse is always "U
"Volumes and Sentiments 5" was created to help traders navigate market situations. This indicator is the result of many years of research and understanding of the nature of market movements. It is a modified version of the "On-Balance Volume" indicator, which corrects some imperfections of the original indicator. "Volumes and Sentiments 5" includes additional ideas (the author's) that visually show the sentiments of market participants. The important advantages of the indicator are the followin
Filtro:
Nessuna recensione
Rispondi alla recensione