SMC Visual Analyzer
- Indicatori
- Versione: 2.0
- Attivazioni: 5
SMC Visual Analyzer draws the complete Smart Money Concepts framework directly on your chart — automatically, in real time, on every timeframe. No more manual markup. No more missed structure shifts. Everything updates on each closed bar with zero repainting.
This is not a signal indicator. It is a professional analysis tool that shows you what the market structure is doing right now, where institutional order flow zones are, where liquidity sits, and whether it has been swept.
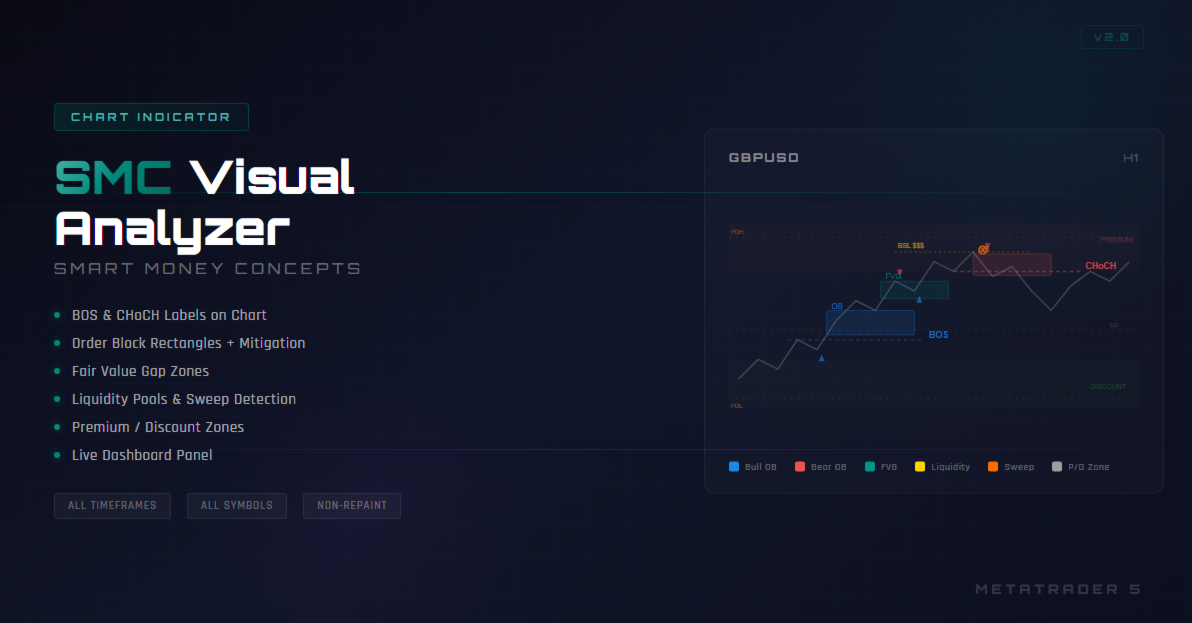
WHAT IT DRAWS ON YOUR CHART:
Market Structure — Swing highs and lows are marked with arrow icons. Break of Structure (BOS) and Change of Character (CHoCH) are drawn as dashed lines with text labels at the exact break level. CHoCH lines are drawn thicker so you can instantly spot trend reversals.
Order Blocks — Colored filled rectangles mark the last opposing candle before a strong impulse. Bullish OBs (blue) and bearish OBs (red) extend to the right automatically. When price trades through an OB, it is marked as mitigated and either removed or dimmed based on your preference. You control the maximum number of active OBs shown.
Fair Value Gaps — Filled rectangles highlight imbalance zones between non-overlapping candles. Bullish FVGs (teal) and bearish FVGs (purple) extend to the right. Filled FVGs can be shown or hidden. Minimum gap size is configurable as an ATR multiple to filter noise.
Liquidity Levels — Dotted lines are drawn at equal highs (buy-side liquidity, labeled "BSL $$$") and equal lows (sell-side liquidity, labeled "SSL $$$"). The tolerance for "equal" is configurable. Previous Day High and Low are drawn as dashed lines labeled PDH and PDL.
Liquidity Sweeps — When price wicks beyond a liquidity level and closes back inside, a sweep marker appears on the chart. The liquidity line color changes to orange to indicate it has been taken.
Premium / Discount Zones — Shaded zones above (premium, red) and below (discount, green) the equilibrium level. The equilibrium line is drawn at the 50% retracement of the last structural move. Labels show PREMIUM, DISCOUNT, and EQ 0.5 clearly.
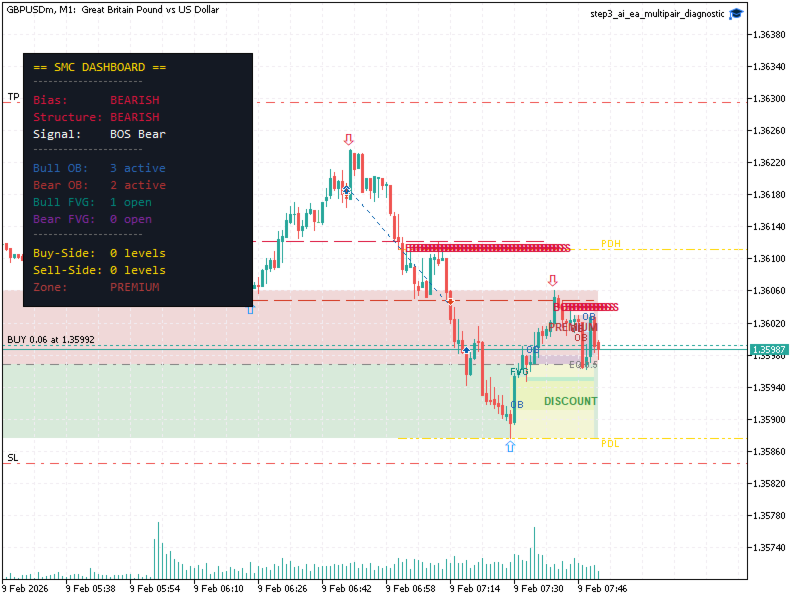
LIVE DASHBOARD PANEL:
A dark-themed information panel displays in your chosen corner (top-left, top-right, bottom-left, or bottom-right) with three size options. It shows:
- Current market bias (Bullish / Bearish / None) with color coding
- Current structure state
- Last structural signal (BOS or CHoCH with direction)
- Number of active bullish and bearish Order Blocks
- Number of open bullish and bearish Fair Value Gaps
- Buy-side and sell-side liquidity status (level count or "SWEPT")
- Current price zone (Premium / Discount / Equilibrium)
All values update on each new bar.
KEY TECHNICAL FEATURES:
- Non-repaint: all analysis uses closed bars only (shift >= 1)
- NormalizeDouble on every price to eliminate floating-point comparison errors
- ATR handle created once at initialization, not per-bar (no handle leak)
- Series-mode arrays for correct bar indexing throughout
- Native MT5 arrow objects for swing markers (no font compatibility issues)
- Color blending with chart background for semi-transparent filled zones
- Efficient object management — objects are cleaned and redrawn by prefix
- Stays within MT5 object limits (max_boxes, max_lines, max_labels all set)
FULLY CONFIGURABLE:
Every visual element can be toggled on or off independently. Every parameter is exposed as an input:
- Swing lookback period
- OB scan depth, impulse requirements, max count, extension length
- FVG scan depth, minimum size, max count, extension length
- Liquidity tolerance, lookback, sweep wick threshold
- Premium/Discount Fibonacci level
- All colors for every element
- Dashboard position, size, font, background color
WORKS ON:
Any symbol, any timeframe. Forex, Gold, Indices, Crypto, Stocks — if MT5 has the data, the indicator will analyze it. Attach it to M1 for scalping markup or D1 for swing analysis.