ClaroFxAlgo SmartLine Alert MT5
- Indicatori
- Versione: 1.34
- Attivazioni: 5

📌 ClaroFxAlgo SmartLine Alert – Precision Trendline & Alert Tool for MetaTrader 5
ClaroFxAlgo SmartLine Alert is an intelligent chart annotation and alert system designed for MetaTrader 5. Perfect for traders who rely on clean technical setups, this tool transforms manual trendline drawing into a dynamic, alert-based system with professional-grade features.
✅ Key Benefits
- ⚡ Smart Trendlines
Instantly convert trendlines into horizontal rays, extend lines, select price anchors, and switch styles using hotkeys. - 🔔 Multi-Channel Alerts
Receive popup, email, push, or sound alerts only when price crosses critical levels – with penetration filters to avoid noise. - 📍 Vertical Lines + Countdown Timers
Mark news times or session opens with vertical lines and track time remaining with built-in countdowns. - 📐 Magnetic Snap + Multi-Point Lines
Snap to highs/lows with precision and draw complex patterns like wedges or channels using continuous line mode. - 🎨 Hotkey-Based Customization
Change color, width, style, and add text to lines without opening settings panels – customize directly from your keyboard.
🚀 Ideal For
- Support/Resistance traders
- Breakout & trendline strategies
- Price action or event-based trading
- Day, swing, and position trading
💼 Feature Highlights
- Hotkey workflow for ultra-fast chart marking
- Horizontal ray generation from trendlines
- Countdown to events (e.g., sessions, news)
- 7 customizable color/style presets
- Lightweight, optimized for all assets and timeframes
📥 Installation (via MQL5 Market)
- Purchase the indicator from MetaTrader 5’s Market tab
- In MT5, go to:
Toolbox (Ctrl+T) → Market → Purchased - Click “Install” next to ClaroFxAlgo SmartLine Alert.
- It will appear in:
Navigator → Indicators → Market - Drag it to your chart.
🔁 If it doesn’t appear, restart MT5 or re-login to your MQL5 account.
🧭 Usage Guide
📐 Basic Trendline Operations
- Draw a Trendline:
Use MT5's default trendline tool. An alert menu will auto-appear. - Convert to Horizontal Ray (Hotkeys):
S – Use first point’s price
D – Use second point’s price
H – Highest price between points
L – Lowest price between points
A – Average price between points - Extend Diagonal Ray:
Select trendline → press E to extend rightward. - Change Line Style:
, – Dashed
. – Dotted
/ – Dash-dot - Change Line Color & Width:
Z to M – Access 7 preset color styles
🔔 Alert System
- Enable/Disable Alerts:
Click the context menu on the trendline → toggle alert on/off. - Trigger Behavior:
- Alerts fire when price crosses the line
- Configurable penetration filter
- Pop-up alert appears at the crossover
- Receive alerts via popup, sound, push, or email
- Add Custom Text:
Select trendline → click the text icon
Customize position, font size, spacing, and color
📊 Vertical Line Tools
- Vertical line set Alert, vertical text, and countdown timer
- Useful for timing news events, session opens, or custom moments
- Press "F" to create vertical line
- Countdown timer displays time remaining (max 60 minutes)
- Fully customizable appearance and behavior
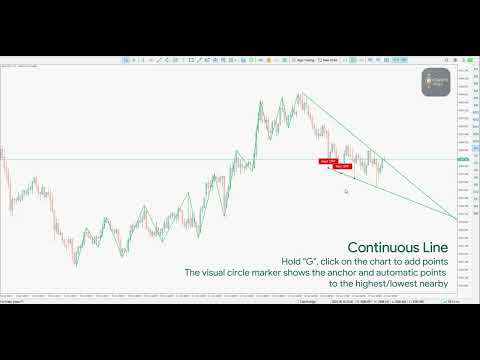
🔄 Continuous Line Drawing
- Create Multi-Point Lines:
Hold G, click on the chart to add points → release G to finish - Magnetic Snap to High/Low:
Auto-snaps points to nearby highs/lows
Adjustable sensitivity - Circle Footprints & Guides:
Visual circle markers show anchor points
Mouse-following circle guide for precise placement
⚙️ Configuration Highlights
- 🔧 Custom Hotkeys: Assign your own keys to nearly all features
- 🎨 7 Color Presets: Each with editable width and style
- 🔔 Flexible Alert Icons: Choose arrows, dots, or bells
- 📝 Text Labels: Full control over size, spacing, and position
- ⏱ Countdown Timer: Adjustable duration, color, and visibility
- 📐 Snap Sensitivity: Fine-tune high/low magnetic snapping
- 🕒 Vertical Line Modes: Use current time or selected candle
💡 Pro Tips & Best Practices
- Use consistent colors to distinguish support, resistance, and trend
- Use Esc to quickly deselect all drawn objects
- Enable alerts only on high-conviction levels to reduce noise
- Adjust penetration threshold based on your strategy
- Combine with RSI, volume, or order flow for confirmation
📈 Advanced Use Cases
- Chart Patterns: Map wedges, triangles, and channels
- Trading Sessions: Mark London/New York opens with alerts
- Market Structure: Connect major swing highs/lows
- Event Timing: Use vertical lines for NFP, FOMC, or economic events
- Order Planning: Mark entry, stop-loss, and take-profit zones with rays
⚠️ Disclaimer
This indicator is a technical analysis tool designed to support informed decision-making. Trading financial instruments carries risk, and you are solely responsible for your trading outcomes. Past performance does not guarantee future results.