Pocket Options OTC RedLine

Custom Heiken Ashi and Moving Averages-Based Signal Indicator

Overview
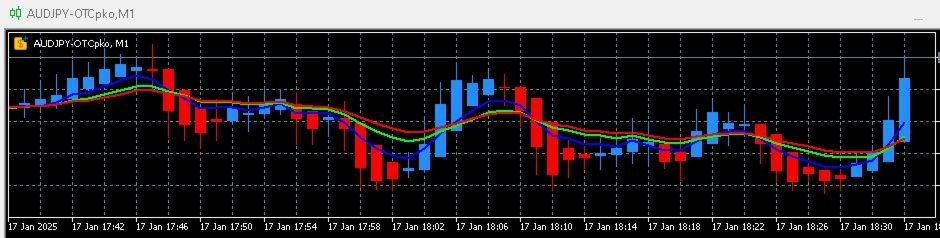
This Heiken Ashi and Moving Average-based indicator is designed to identify trend-following buy and sell signals by analyzing the relationship between three Exponential Moving Averages (EMAs). It applies Heiken Ashi smoothing to filter market noise and improve trend clarity.

  • EMA Crossovers for Trend Detection – Uses 3, 8, and 25-period EMAs to confirm trends.
  • Heiken Ashi Smoothing – Reduces market noise for better trend visualization.
  • Customizable Alerts and Icons – Get notified with visual signals and optional sound alerts.
  • Trend Filtering – Helps avoid false signals by confirming momentum shifts.
  • User-Friendly and Adjustable – Customize EMA settings, icon placement, and alerts.

This indicator is ideal for traders focusing on trend-following strategies using Heiken Ashi candles and moving averages.

Key Features and Benefits

  • Three Moving Averages for Trend Confirmation

    • Fast EMA (3-period) – Captures short-term price movement.
    • Medium EMA (8-period) – Tracks medium-term trends.
    • Slow EMA (25-period) – Identifies longer-term market direction.
    • Buy Signal – Triggered when Fast EMA > Medium EMA > Slow EMA (Uptrend).
    • Sell Signal – Triggered when Fast EMA < Medium EMA < Slow EMA (Downtrend).
  • Heiken Ashi Candle Integration

    • Uses Heiken Ashi Open, High, Low, and Close values to smooth price action.
    • Helps identify clearer trends compared to traditional candlestick analysis.
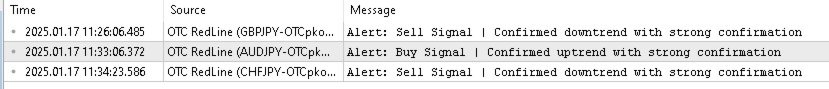
  • Real-Time Alerts and Notifications

    • On-Screen Alerts – Notifications inside MetaTrader 5 (MT5).
    • Optional Sound Alerts – Stay informed of buy and sell opportunities.
    • Visual Chart Signals – Buy and sell arrows appear directly on the chart.
  • Customizable Indicator Display

    • Modify arrow icons, colors, and sizes for clear trade signals.
    • Works with both Heiken Ashi and regular candles.
    • Adjustable signal placement sensitivity to reduce noise.
  • Optimized for Trend-Following Strategies

    • Helps traders stay aligned with market trends using a structured approach.
    • Designed for markets with high volatility.

How It Works

Step 1: Heiken Ashi Calculation
The indicator calculates Heiken Ashi Open, High, Low, and Close values. These values are used for smoother trend detection.

Step 2: EMA Crossover Logic
The indicator plots Fast (3), Medium (8), and Slow (25) EMAs.

  • A Buy Signal occurs when Fast EMA > Medium EMA > Slow EMA.
  • A Sell Signal occurs when Fast EMA < Medium EMA < Slow EMA.

Step 3: Alerts and Visual Signals

  • Buy Signal – A green arrow appears below the lowest price of recent bars.
  • Sell Signal – A red arrow appears above the highest price of recent bars.
  • Alerts notify traders in real time when conditions are met.

Customizable Settings

  • Moving Averages Settings:

    • Fast EMA Period – Default 3 (short-term trend sensitivity).
    • Medium EMA Period – Default 8 (medium-term trend tracking).
    • Slow EMA Period – Default 25 (long-term trend filtering).
    • Moving Average Type – Choose between EMA, SMA, LWMA, etc.
  • Visual and Signal Settings:

    • Buy and Sell Arrows – Customize icon type, color, and position.
    • Signal Filtering – Adjust sensitivity for crossover detection.
  • Alerts and Notifications:

    • Enable or Disable Alerts – Turn on or off on-screen and sound alerts.
    • Adjust Icon Placement – Modify distance between signals and price action.

Recommended Markets and Timeframes

  • Markets: Works across forex, stocks, indices, commodities, and crypto.
  • Timeframes: Works on M1 to H4 (Recommended: M5, M15, H1).

Installation and Setup

(The previous instructions for downloading, copying, restarting, and applying the indicator have been removed.)

Why Use This Indicator?

  • Reliable Trend Identification – Uses EMA crossovers and Heiken Ashi smoothing for clear signals.
  • Custom Alerts and Notifications – Stay informed without constantly monitoring charts.
  • Clear Buy and Sell Markers – Easy-to-read visual signals.
  • Adaptable to Any Market – Works across forex, stocks, commodities, and crypto.

Important Notes and Disclaimer

  • Platform Compatibility: Designed for MetaTrader 5 (MT5).
  • No Guaranteed Outcomes: This indicator provides analysis but does not predict future price movements.
  • User Responsibility: Always test in a demo account before using in live trading.

This Heiken Ashi and EMA-Based Indicator provides a structured approach to trend-following strategies, helping traders identify potential trade opportunities with clear signals and customizable alerts.


Prodotti consigliati
Owl Smart Levels MT5
Sergey Ermolov
4.03 (32)
Versione MT4  |  FAQ L' indicatore Owl Smart Levels è un sistema di trading completo all'interno dell'unico indicatore che include strumenti di analisi di mercato popolari come i frattali avanzati di Bill Williams , Valable ZigZag che costruisce la corretta struttura a onde del mercato, e i livelli di Fibonacci che segnano i livelli esatti di entrata nel mercato e luoghi per prendere profitti. Descrizione dettagliata della strategia Istruzioni per lavorare con l'indicatore Consulente-assistente
Noize Absorption Index - is the manual trading system that measures the difference of pressure between bears forces and bulls forces. Green line - is a noize free index that showing curent situation. Zero value of index shows totally choppy/flat market.Values above zero level shows how powerfull bullish wave is and values below zero measures bearish forces.Up arrow appears on bearish market when it's ready to reverse, dn arrow appears on weak bullish market, as a result of reverse expectation.
RBreaker
Zhong Long Wu
RBreaker Gold Indicators is a short-term intraday trading strategy for gold futures that combines trend following and intraday reversal approaches. It not only captures profits during trending markets but also enables timely profit-taking and counter-trend trading during market reversals. This strategy has been ranked among the top ten most profitable trading strategies by the American magazine   Futures Truth   for 15 consecutive years. It boasts a long lifecycle and remains widely used and st
TRI Visualizer
Yoshimi Mon 三 Ura
TRI Visualizer MT5 – Thermodynamic Market Analysis Overview The TRI (Thermal Range Indicator) Visualizer Enhanced is a rare market analysis indicator that goes beyond conventional technical analysis, applying principles of thermodynamics from physics. It interprets market price fluctuations as “thermodynamic energy,” enabling the highly accurate detection of subtle market changes that are often overlooked. Innovative Mechanisms 1. Dual Calculation Engines Classic TRI Mode Formula: |Close
HMA Trend Professional MT5
Pavel Zamoshnikov
4.25 (4)
Improved version of the free HMA Trend indicator (for MetaTrader 4) with statistical analysis. HMA Trend is a trend indicator based on the Hull Moving Average (HMA) with two periods. HMA with a slow period identifies the trend, while HMA with a fast period determines the short-term movements and signals in the trend direction. The main differences from the free version: Ability to predict the probability of a trend reversal using analysis of history data. Plotting statistical charts for analyzi
CosmiCLab SMC FIBO CosmiCLab SMC FIBO is a professional trading indicator designed for traders who use Smart Money Concepts (SMC), market structure analysis and Fibonacci retracement levels. The indicator automatically detects market swings and builds Fibonacci levels based on the latest impulse movement. It also identifies market structure changes such as BOS (Break of Structure) and CHOCH (Change of Character), helping traders understand the current market direction. CosmiCLab SMC FIBO also pr
Pro Gold System Indicator
PEDRO JOAQUIM GONCALVES GOMES
ADVANCED FUNCTIONALITIES: Trend Score (0-100) with visual bar Intelligent signals with adjustable strength (1-10) Risk management with automatic TP/SL Audible and visual alerts Price zones with smooth filling Multi-indicator analysis (RSI, ATR, BB, EMAs) DESIGN FEATURES Modern Visual: Smooth and well-spaced lines (EMA with 2-3px width) Vibrant and professional colors (Sky Blue, Orange, Gold) Modern arrows (code 233/234) for buy/sell signals Configurable dark/light theme Adjustable transparency f
An indicator of pattern #31 ("Long Island") from Encyclopedia of Chart Patterns by Thomas N. Bulkowski. The second gap is in the opposite direction. Parameters: Alerts - show alert when an arrow appears   Push - send a push notification when an arrow appears (requires configuration in the terminal) GapSize - minimum gap size in points ArrowType - a symbol from 1 to 17 ArrowVShift - vertical shift of arrows in points   ShowLevels - show levels ColUp - color of an upward line ColDn - color of a d
Price Magnet — Price Density and Attraction Levels Indicator Price Magnet is a professional analytical tool designed to identify key support and resistance levels based on statistical Price Density. The indicator analyzes a specified historical period and detects price levels where the market spent the most time. These zones act as “magnets,” attracting price action or forming a structural base for potential reversals. Unlike traditional Volume Profile tools, Price Magnet focuses on price-time d
Universal Soul Reaper
Pieter Gerhardus Van Zyl
Universal Soul Reaper is an atmospheric market-flow oscillator designed to interpret price behavior as a cycle of spiritual energy. Instead of reacting to raw price alone, it visualizes the state of the market’s soul —revealing when momentum is awakening, stabilizing, or fading. The indicator operates in a separate window and presents three interwoven entities: the Ectoplasmic Veil , the Spirit Boundary , and the Soul Core . Together, they form a living framework that helps traders sense pressu
Overview Harmonic Patterns MT5 is a technical analysis indicator designed for the MetaTrader 5 platform. It identifies and displays harmonic price patterns, such as Butterfly, Cypher, Crab, Bat, Shark, and Gartley, in both bullish and bearish directions. The indicator calculates key price levels, including entry, stop loss, and three take-profit levels, to assist traders in analyzing market movements. Visual elements and customizable alerts enhance usability on the chart. Features Detects six ha
## Descrizione completa dell'indicatore WPRV2 L'indicatore **WPRV2** è una versione migliorata di uno strumento tecnico tradizionale noto come Percentuale di Williams (%R). Viene utilizzato soprattutto nei mercati finanziari, tra cui borse valori, forex e piattaforme per criptovalute, per analizzare le tendenze di mercato e individuare i momenti ottimali per entrare e uscire dalle transazioni. ### Scopo dell'indicatore Lo scopo principale dell'indicatore WPRV2 è misurare il prezzo attuale ris
**   All Symbols   x   All Timeframes   scan just by pressing scanner button ** Discount: The price is $50$, But now it is just $39, Limited time offer is active. *** Contact me  to send you instruction and add you in "Trend Reversal group" for sharing or seeing experiences with other users. Introduction: Trendlines are the most famous technical analysis in trading . Trendlines continually form on the charts of markets across all the different timeframes providing huge opportunities for traders
The   Trendlines Oscillator   helps traders identify trends and momentum based on the normalized distances between the current price and the most recently detected bullish and bearish trend lines. The indicator features bullish and bearish momentum, a signal line with crossings, and multiple smoothing options. USAGE The   Trendlines Oscillator   works by systematically: Identifying pivot highs and lows. Connecting pivots to form bullish (support) and bearish (resistance) trendlines. Measuring
Trade smarter, not harder: Empower your trading with Harmonacci Patterns This is arguably the most complete harmonic price formation auto-recognition indicator you can find for the MetaTrader Platform. It detects 19 different patterns, takes fibonacci projections as seriously as you do, displays the Potential Reversal Zone (PRZ) and finds suitable stop-loss and take-profit levels. [ Installation Guide | Update Guide | Troubleshooting | FAQ | All Products ] It detects 19 different harmonic pri
Innanzitutto, vale la pena sottolineare che questo Strumento di Trading è un Indicatore Non-Ridipingente, Non-Ridisegnante e Non-Laggante, il che lo rende ideale per il trading professionale. Corso online, manuale utente e demo. L'Indicatore Smart Price Action Concepts è uno strumento molto potente sia per i nuovi che per i trader esperti. Racchiude più di 20 utili indicatori in uno solo, combinando idee di trading avanzate come l'Analisi del Trader del Circolo Interno e le Strategie di Tradin
This indicator is used to compare the relative strength of the trade on the chart against the other several selected symbols. By comparing the price movement of each traded variety based on the same base day, several trend lines of different directions can be seen, reflecting the strong and weak relationship between the several different traded varieties, so that we can have a clearer understanding of the market trend. For example, you can apply this indicator on a EurUSD chart and compare it w
Candle Fusion Pro
Martin Alejandro Bamonte
Candle Fusion Pro — Riconoscimento dei pattern + Filtro di tendenza + Filtro di momentum (Nessun repaint) Rileva potenti pattern di candele giapponesi e conferma la loro forza con analisi in tempo reale di trend e momentum. Candle Fusion Pro è lo strumento visivo definitivo per i trader che si affidano a precisione del price action , struttura del trend e conferme multilivello . Funzionalità principali Entrata basata su pattern : Rileva oltre 10 pattern avanzati giapponesi , tra cui: Shooting
This indicator presents an alternative approach to identify Market Structure. The logic used is derived from learning material created by   DaveTeaches (on X) Upgrade v1.10: + add option to put protected high/low value to buffer (figure 11, 12) + add  Retracements  value to buffer when Show Retracements When quantifying Market Structure, it is common to use fractal highs and lows to identify "significant" swing pivots. When price closes through these pivots, we may identify a Market Structure S
# DRAWDOWN INDICATOR V4.0 - The Essential Tool to Master Your Trading ## Transform Your Trading with a Complete Real-Time Performance Overview In the demanding world of Forex and CFD trading, **knowing your real-time performance** isn't a luxury—it's an **absolute necessity**. The **Drawdown Indicator V4.0** is much more than a simple indicator: it's your **professional dashboard** that gives you a clear, precise, and instant view of your trading account status. --- ## Why This Indicator
Terra Infinity is a flat indicator. This improved version of the CalcFlat indicator has three additional lines that significantly increase its effectiveness. Unlike its predecessor with two static levels, Terra Infinity adds three dynamic lines above the main histogram, which are interpreted as follows: base signal line, minimum signal line, maximum signal line. These lines are formed using the additional parameter Avg, which is the average value of the histogram. Averaging produces a line cl
Laguerre SuperTrend Clouds   adds an Adaptive Laguerre averaging algorithm and alerts to the widely popular SuperTrend indicator. As the name suggests,   Laguerre SuperTrend Clouds (LSC)   is a trending indicator which works best in trendy (not choppy) markets. The SuperTrend is an extremely popular indicator for intraday and daily trading, and can be used on any timeframe. Incorporating Laguerre's equation to this can facilitate more robust trend detection and smoother filters. The LSC uses the
Trend Monitor MT5
Pavel Zamoshnikov
4.5 (2)
The indicator generates early signals basing on ADX reading data combined with elements of price patterns. Works on all symbols and timeframes. The indicator does not redraw its signals. You see the same things on history and in real time. For better visual perception signals are displayed as arrows (in order not to overload the chart). Features The best results are obtained when the indicator works on two timeframes. For example: M30 – the indicator shows the main trend; M5 – the indicator gen
Binary Options Assistant (BOA) Multi Currency Dashboard for Binary Options (MT5) . You can use any of the BOA Signals Indicators with the dashboard. Just change the BOA Signals Indicator Name in the dashboard settings to the indicator you want to get signals from. For example: CHILL. BLAZE:  BOA_BLAZE_Indicator_v1   Strategy :   BLW Online Trading Binary Options Strategy (3 Moving Average) LAVA:  BOA_LAVA_Indicator_v1   Strategy:   Lady Trader Binary Options Strategy (Bollinger Bands & Stochas
StealthTrade Commander   is an advanced visual trading panel and risk-management utility designed for manual traders, scalpers, and Prop-Firm challengers. This tool helps you execute trades visually directly from the chart, hide your Stop Loss and Take Profit levels from the broker, and strictly control your daily drawdown—a crucial feature for passing and keeping Prop-Firm funded accounts.  KEY FEATURES:  Risk Guardian (Prop-Firm Protector) Max Daily Loss Limit:   Automatically closes all trad
FREE
L'indicateur SMC Venom Model BPR est un outil professionnel pour les traders travaillant dans le concept Smart Money (SMC). Il identifie automatiquement deux modèles clés sur le graphique des prix: FVG   (Fair Value Gap) est une combinaison de trois bougies, dans laquelle il y a un écart entre la première et la troisième bougie. Forme une zone entre les niveaux où il n'y a pas de support de volume, ce qui conduit souvent à une correction des prix. BPR   (Balanced Price Range) est une combinaiso
The RSI Divergence + FVG Signal indicator combines Relative Strength Index (RSI) Divergence with Fair Value Gap (FVG) detection to generate high-probability buy and sell signals based on both momentum shifts and institutional imbalance zones. Core Features: RSI Divergence Detection : Identifies both regular and hidden bullish/bearish divergences between price and RSI. Divergences indicate potential trend reversals or continuation. FVG Zone Recognition : Detects Fair Value Gaps (imbalances caused
Volume Profile V6
Andrey Kolesnik
4.67 (3)
Indicatore del profilo di volume del mercato + oscillatore intelligente. Funziona su quasi tutti gli strumenti: coppie di valute, azioni, futures, criptovalute, sia su volumi reali che su tick. È possibile impostare la definizione automatica dell'intervallo di costruzione del profilo (ad esempio, per una settimana o un mese, ecc.), oppure impostare l'intervallo manualmente spostando i confini (due linee verticali: rossa e blu). Viene visualizzato sotto forma di istogramma. La larghezza dell'isto
"Impulses and Corrections 5" is created to help traders navigate the market situation. The indicator shows multi-time frame upward and downward "Impulses" of price movements. These impulses are the basis for determining the "Base" , which is composed of zones of corrections of price movements, as well as "Potential" zones for possible scenarios of price movement. Up and down impulses are determined based on a modified formula of Bill Williams' "Fractals" indicator. The last impulse is always "U
The Riko Trend indicator is a revolutionary trend trading and filtering solution with all the important features of a trend tool built into one tool! The Riko Trend indicator is good for any trader, suitable for any trader for both forex and binary options. You don’t need to configure anything, everything is perfected by time and experience, it works great during a flat and in a trend. The Riko Trend indicator is a technical analysis tool for financial markets that reflects the current price f
Gli utenti di questo prodotto hanno anche acquistato
SuperScalp Pro
Van Minh Nguyen
5 (11)
SuperScalp Pro – Sistema avanzato di indicatore per scalping con filtri multipli SuperScalp Pro è un sistema avanzato di indicatore per scalping che combina il classico Supertrend con molteplici filtri di conferma intelligenti. L’indicatore funziona in modo efficiente su tutti i timeframe da M1 a H4 ed è particolarmente adatto per XAUUSD, BTCUSD e le principali coppie Forex. Può essere utilizzato come sistema stand-alone o integrato in modo flessibile nelle strategie di trading esistenti. L’indi
Divergence Bomber
Ihor Otkydach
4.89 (83)
Ogni acquirente dell’indicatore riceverà inoltre gratuitamente: L’utilità esclusiva “Bomber Utility”, che gestisce automaticamente ogni operazione, imposta i livelli di Stop Loss e Take Profit e chiude le posizioni secondo le regole della strategia I file di configurazione (set file) per adattare l’indicatore a diversi asset I set file per configurare il Bomber Utility in tre modalità: “Rischio Minimo”, “Rischio Bilanciato” e “Strategia di Attesa” Una guida video passo-passo per installare, conf
Azimuth Pro
Ottaviano De Cicco
5 (6)
LAUNCH PROMO Azimuth Pro price is initially set at 299$ for the first 100 buyers. Final price will be 499$ . THE DIFFERENCE BETWEEN RETAIL AND INSTITUTIONAL ENTRIES ISN'T THE INDICATOR — IT'S THE LOCATION. Most traders enter at arbitrary price levels, chasing momentum or reacting to lagging signals. Institutions wait for price to reach structured levels where supply and demand actually shift. Azimuth Pro maps these levels automatically: swing-anchored VWAP, multi-timeframe structure lines, an
ARICoins
Temirlan Kdyrkhan
ARICoin is a powerful trading companion designed to generate high-probability entry signals with dynamic TP/SL/DP levels based on volatility. Built-in performance tracking shows win/loss stats, PP1/PP2 hits, and success rates all updated live. Key Features: Buy/Sell signals with adaptive volatility bands Real-time TP/SL/DP levels based on ATR Built-in MA Filter with optional ATR/StdDev volatility Performance stats panel (Success, Profit/Loss, PP1/PP2) Alerts via popup, sound, push, or email Cust
Entry In The Zone and SMC Multi Timeframe is a real-time market analysis tool developed based on Smart Money Concepts (SMC). It is designed to analyze market structure, price direction, reversal points, and key zones across multiple timeframes in a systematic way. The system displays Points of Interest (POI) and real-time No Repaint signals, with instant alerts when price reaches key zones or when signals occur within those zones. It functions as both an Indicator and a Signal System (2-in-1), c
Se acquisti questo indicatore, riceverai il mio Trade Manager Professionale + EA  GRATUITAMENTE. Innanzitutto è importante sottolineare che questo sistema di trading è un indicatore Non-Repainting, Non-Redrawing e Non-Lagging, il che lo rende ideale sia per il trading manuale che per quello automatico. Corso online, manuale e download di preset. Il "Sistema di Trading Smart Trend MT5" è una soluzione completa pensata sia per i trader principianti che per quelli esperti. Combina oltre 10 indicat
FX Trend MT5 NG
Daniel Stein
5 (4)
FX Trend NG: La Nuova Generazione di Intelligenza di Trend Multi-Mercato Panoramica FX Trend NG è uno strumento professionale di analisi del trend multi-timeframe e monitoraggio dei mercati. Ti consente di comprendere la struttura completa del mercato in pochi secondi. Invece di passare tra numerosi grafici, puoi identificare immediatamente quali strumenti sono in trend, dove il momentum sta diminuendo e dove esiste un forte allineamento tra i timeframe. Offerta di Lancio – Ottieni FX Trend NG
Power Candles MT5
Daniel Stein
5 (6)
Power Candles – Segnali di ingresso basati sulla forza per tutti i mercati Power Candles porta l’analisi di forza collaudata di Stein Investments direttamente sul grafico dei prezzi. Invece di reagire solo al prezzo, ogni candela viene colorata in base alla reale forza di mercato, consentendo di identificare immediatamente accumuli di momentum, accelerazioni della forza e transizioni di trend pulite. Un’unica logica per tutti i mercati Power Candles funziona automaticamente su tutti i simboli di
[ My Products ] , [ My Channel ]   ,  [ LIVE SIGNAL ] HFT Spike Detector HFT Spike Detector è uno strumento professionale di monitoraggio dei tick progettato per analizzare e misurare in tempo reale i movimenti di prezzo ad alta frequenza (picchi improvvisi causati da HFT). Il suo scopo è permetterti di rilevare slippage anomalo, gap di liquidità e picchi di prezzo a livello millisecondo causati dal broker, utilizzando dati numerici. Poiché analizza il flusso di tick in tempo reale e le cond
Trend Screener Pro MT5
STE S.S.COMPANY
4.81 (103)
Indicatore di tendenza, soluzione unica rivoluzionaria per il trading di tendenze e il filtraggio con tutte le importanti funzionalità di tendenza integrate in un unico strumento! È un indicatore multi-timeframe e multi-valuta al 100% non ridipingibile che può essere utilizzato su tutti i simboli/strumenti: forex, materie prime, criptovalute, indici e azioni. Trend Screener è un indicatore di tendenza che segue un indicatore efficiente che fornisce segnali di tendenza a freccia con punti nel gra
AriX
Temirlan Kdyrkhan
1 (4)
AriX Indicator for MT5 A powerful trend-following and signal-evaluation tool AriX is a custom MT5 indicator that combines Moving Averages and ATR-based risk/reward logic to generate clear buy/sell signals. It visualizes dynamic SL/TP levels, evaluates past trade outcomes, and displays win/loss statistics in a clean on-chart panel. Key features include: Buy/Sell signals based on MA crossovers ATR-based SL/TP1/TP2/TP3 levels with visual lines and labels Signal outcome tracking with real-time stat
RFI levels PRO MT5
Roman Podpora
3.67 (3)
L'indicatore mostra accuratamente i punti di inversione e le zone di ritorno dei prezzi in cui il       Principali attori   . Vedi dove si formano le nuove tendenze e prendi decisioni con la massima precisione, mantenendo il controllo su ogni operazione. VERSION MT4     -    Rivela il suo massimo potenziale se combinato con l'indicatore   TREND LINES PRO Cosa mostra l'indicatore: Strutture di inversione e livelli di inversione con attivazione all'inizio di un nuovo trend. Visualizzazione dei li
OmniSync Projection
Antonio-alin Teculescu
5 (1)
Chronos Fractal Engine is an innovative price projection indicator for MetaTrader 5, designed to transform your technical analysis by intelligently identifying and projecting historical price patterns. Built upon an advanced correlation algorithm and the fractal principles of the market, this powerful tool visualizes potential future price movements, giving you a unique edge in your trading decisions. What is Chronos Fractal Engine? At its core, the Chronos Fractal Engine employs a sophisticat
Grabber System MT5
Ihor Otkydach
4.83 (23)
Ti presento un eccellente indicatore tecnico: Grabber, che funziona come una strategia di trading "tutto incluso", pronta all’uso. In un solo codice sono integrati strumenti potenti per l’analisi tecnica del mercato, segnali di trading (frecce), funzioni di allerta e notifiche push. Ogni acquirente di questo indicatore riceve anche gratuitamente: L’utility Grabber: per la gestione automatica degli ordini aperti Video tutorial passo dopo passo: per imparare a installare, configurare e utilizzare
Atomic Analyst MT5
Issam Kassas
4.03 (30)
Innanzitutto, vale la pena sottolineare che questo indicatore di trading non è repaint, non è ridisegno e non presenta ritardi, il che lo rende ideale sia per il trading manuale che per quello automatico. Manuale utente: impostazioni, input e strategia. L'Analista Atomico è un indicatore di azione del prezzo PA che utilizza la forza e il momentum del prezzo per trovare un miglior vantaggio sul mercato. Dotato di filtri avanzati che aiutano a rimuovere rumori e segnali falsi, e aumentare il pote
FX Power MT5 NG
Daniel Stein
5 (31)
FX Power: Analizza la Forza delle Valute per Decisioni di Trading Più Intelligenti Panoramica FX Power è lo strumento essenziale per comprendere la reale forza delle principali valute e dell'oro in qualsiasi condizione di mercato. Identificando le valute forti da comprare e quelle deboli da vendere, FX Power semplifica le decisioni di trading e rivela opportunità ad alta probabilità. Che tu segua le tendenze o anticipi inversioni utilizzando valori estremi di Delta, questo strumento si adatta
Pips Stalker mt5
Abdulkarim Karazon
5 (1)
Il Pips Stalker è un indicatore a freccia lunga e corta, aiuta i trader di tutti i livelli a prendere decisioni migliori nel trading sul mercato, l'indicatore non viene mai ridipinto e usa l'RSI come logica principale del segnale; una volta applicata una freccia, non verrà mai ridipinta o ridipinga e le frecce non vengono ritardate. VERSIONE MT4 &lt;---- CARATTERISTICHE DELLA FRECCIA PIPS STALKER : PANNELLO STATISTICHE un dashboard informativo unico che mostra la percentuale complessiva di
Smart Stop Indicator – Precisione intelligente dello stop-loss direttamente sul grafico Panoramica Smart Stop Indicator è la soluzione ideale per i trader che desiderano posizionare il loro stop-loss in modo chiaro e metodico, senza dover indovinare o affidarsi all’intuizione. Questo strumento combina la logica classica del price action (massimi e minimi strutturali) con un moderno riconoscimento dei breakout per identificare il prossimo livello di stop realmente logico. In trend, in range o i
Trend indicator AI mt5
Ramil Minniakhmetov
5 (15)
Trend Ai indicator è un ottimo strumento che migliorerà l'analisi di mercato di un trader combinando l'identificazione della tendenza con punti di ingresso utilizzabili e avvisi di inversione. Questo indicatore consente agli utenti di navigare nelle complessità del mercato forex con fiducia e precisione Oltre ai segnali primari, l'indicatore Ai di tendenza identifica i punti di ingresso secondari che si presentano durante i pullback o i ritracciamenti, consentendo ai trader di capitalizzare le
Trend Lines PRO MT5
Roman Podpora
5 (1)
LINEE DI TENDENZA PRO  Aiuta a capire dove il mercato sta realmente cambiando direzione. L'indicatore mostra reali inversioni di tendenza e punti in cui i principali operatori rientrano. Vedi   Linee BOS   Cambiamenti di tendenza e livelli chiave su timeframe più ampi, senza impostazioni complesse o rumore inutile. I segnali non vengono ridisegnati e rimangono sul grafico dopo la chiusura della barra. VERSIONE MT4   -   Svela il suo massimo potenziale se abbinato all'indicatore   RFI LEVELS PRO
ARIPoint
Temirlan Kdyrkhan
ARIPoint is a powerful trading companion designed to generate high-probability entry signals with dynamic TP/SL/DP levels based on volatility. Built-in performance tracking shows win/loss stats, PP1/PP2 hits, and success rates all updated live. Key Features: Buy/Sell signals with adaptive volatility bands Real-time TP/SL/DP levels based on ATR Built-in MA Filter with optional ATR/StdDev volatility Performance stats panel (Success, Profit/Loss, PP1/PP2) Alerts via popup, sound, push, or email Cu
Quantum TrendPulse
Bogdan Ion Puscasu
5 (22)
Ecco   Quantum TrendPulse   , lo strumento di trading definitivo che combina la potenza di   SuperTrend   ,   RSI   e   Stocastico   in un unico indicatore completo per massimizzare il tuo potenziale di trading. Progettato per i trader che cercano precisione ed efficienza, questo indicatore ti aiuta a identificare con sicurezza le tendenze di mercato, i cambiamenti di momentum e i punti di entrata e uscita ottimali. Caratteristiche principali: Integrazione SuperTrend:   segui facilmente l'andame
FX Dynamic MT5
Daniel Stein
5 (5)
FX Dynamic: Monitora volatilità e trend con un’analisi ATR personalizzabile Panoramica FX Dynamic è uno strumento potente che sfrutta i calcoli di Average True Range (ATR) per fornire ai trader informazioni impareggiabili sulla volatilità, sia giornaliera che intraday. Impostando soglie di volatilità chiare—ad esempio 80%, 100%, 130%—puoi individuare rapidamente opportunità di profitto o ricevere avvisi quando il mercato supera i range abituali. FX Dynamic si adatta al fuso orario del tuo brok
FX Levels MT5
Daniel Stein
5 (13)
FX Levels: Supporti e Resistenze di Precisione Eccezionale per Tutti i Mercati Panoramica Rapida Cercate un modo affidabile per individuare livelli di supporto e resistenza in ogni mercato—coppie di valute, indici, azioni o materie prime? FX Levels fonde il metodo tradizionale “Lighthouse” con un approccio dinamico all’avanguardia, offrendo una precisione quasi universale. Basato sulla nostra esperienza reale con i broker e su aggiornamenti automatici giornalieri più quelli in tempo reale, FX
Market Structure Order Block Dashboard MT5 è un indicatore per MT5 focalizzato sulla struttura di mercato e sui concetti ICT / Smart Money: HH/HL/LH/LL , BOS , ChoCH , oltre a Order Blocks , Fair Value Gaps (FVG) , liquidità (EQH/EQL, sweeps), sessioni / Kill Zones e un Volume Profile integrato, con una dashboard compatta di confluence. Importante: è uno strumento di analisi . Non esegue operazioni (non è un EA). Bonus per gli acquirenti Dopo l’acquisto, puoi ricevere 2 indicatori bonus (a scel
Candle Smart Range
Gianny Alexander Lugo Sanchez
5 (1)
Candle Smart Range (CSR) per MetaTrader 5 Candle Smart Range è un indicatore tecnico progettato per l'identificazione automatica dei range di prezzo su più timeframe. Questo strumento analizza la struttura del mercato basandosi sulle formazioni delle candele e sull'interazione del prezzo con i massimi e i minimi precedenti. Caratteristiche principali: Rilevamento Range: Identifica le zone di consolidamento prima dei movimenti impulsivi. Identificazione Falsi Breakout: Segnala quando il prezzo su
Crystal Heikin Ashi Signals
Muhammad Jawad Shabir
5 (1)
Crystal Heikin Ashi Signals - Professional Trend & Signal Detection Indicator Advanced Heikin Ashi Visualization with Intelligent Signal System for Manual & Automated Trading Final Price: $149 ---------> Price goes up $10 after every 10 sales . Limited slots available — act fast . Overview Crystal Heikin Ashi Signals is a professional-grade MetaTrader 5 indicator that combines pure Heikin Ashi candle visualization with an advanced momentum-shift detection system. Designed for both manual traders
Questo indicatore è un indicatore per l'analisi automatica delle onde perfetto per il trading pratico! Caso... Nota:   non sono abituato a usare nomi occidentali per la classificazione delle onde a causa dell'influenza della convenzione di denominazione di Tang Lun (Tang Zhong Shuo Zen), ho chiamato l'onda base come   penna   e la banda dell'onda secondaria come   segmento   At allo stesso tempo, il segmento ha la direzione del trend. La denominazione   è principalmente segmento di trend   (que
Btmm state engine pro
Garry James Goodchild
5 (2)
Get the user guide here  https://g-labs.software/guides/BTMM_State_Engine_Welcome_Pack.html BTMM State Engine Pro — the   all-in-one Banks   & Institutions Market Maker indicator for Meta Trader 5. Built for   BTMM traders who follow the Asian   session breakout methodology with Kill Zone timing , level stacking, peak formation detection , and multi-pair scanning — all   from a single chart. Combines   a full BTMM State Engine   with a built-in multi-pair Scanner dashboard, eliminating the need
Introduction to X3 Chart Pattern Scanner X3 Cherart Pattern Scanner is the non-repainting and non-lagging indicator detecting X3 chart patterns including Harmonic pattern, Elliott Wave pattern, X3 patterns, and Japanese Candlestick patterns. Historical patterns match with signal patterns. Hence, you can readily develop the solid trading strategy in your chart. More importantly, this superb pattern scanner can detect the optimal pattern of its kind. In addition, you can switch on and off individu
Altri dall’autore
ocket Options Keltner Channel with MA v3.12 Indicator Name: Keltner Channel v3.12 – Advanced Trend and Signal Indicator Version: 3.12 Release Date: 2024 Platform: MetaTrader 5 (MT5) Category: Trend Indicators Overview Keltner Channel v3.12 is a trend-following indicator that combines Keltner Channels with Moving Averages (MA1 and MA2) to identify breakouts, trend shifts, and momentum changes. This tool provides real-time buy and sell signals, visual markers, and alerts to assist traders in dec
Indicator Overview Latest Updates: Update 02-23-2025: This version includes further optimizations for improved signal accuracy. Update 01-13-2025: Now compatible with the upcoming Web Request App, which will replace the AutoSignal_Connection bot. Purpose This MT5 indicator is designed for analyzing 3-minute Heiken Ashi candles, generating buy and sell signals based on moving average (MA) crossovers. It provides visual signals and alerts, making it a valuable tool for traders. Heiken Ashi Candl
Combined RSI and Stochastic Indicator for MT5 Overview The Combined RSI and Stochastic Indicator integrates the Relative Strength Index (RSI) and Stochastic Oscillator to provide trend confirmation and momentum-based trading signals. This MetaTrader 5 (MT5) indicator helps traders identify potential buy and sell opportunities by combining stochastic crossovers with RSI trend validation. RSI Trend Confirmation: Filters stochastic signals based on overall trend direction. Stochastic Crossovers:
MACD Alerts
Matthew Palulis
MACD Crossover with Alerts, Colored Histogram, and Zero Line Arrows Overview The MACD Crossover Indicator is designed to help traders analyze trend direction and momentum shifts. This enhanced version of the classic MACD includes visual crossover markers, dynamic histogram coloring, and real-time alerts, offering a clear and structured approach to market analysis. Histogram color changes based on MACD position (above or below zero). Zero-line arrows for crossover points to highlight key trend
MA Crossover and Trend Alert Indicator Latest Updates: Fixed multiple buy and sell icons on each candle for cleaner signals. Optimized alert logic to prevent duplicate notifications. Enhanced compatibility – Now works with Heiken Ashi or regular candles. Updated print statement – Alerts now log directly to alerts.txt for future reference. Overview The EMA Crossover and Trend Alert Indicator is a trend-following tool designed to assist traders in identifying moving average crossovers and short-
Vortex Indicator with Alert System for MT5 Overview The Vortex Indicator with Alert System is a trend-following tool designed to help traders identify market direction and momentum shifts. This MetaTrader 5 (MT5) indicator analyzes positive and negative vortex movements (+VI and -VI) and generates buy and sell crossover signals with visual markers and customizable alerts. Directional Momentum Detection: Tracks +VI and -VI crossovers for trend confirmation. Crossover Alerts: Notifies traders of
SuperTrend Indicator with Alerts Overview The SuperTrend Indicator is a trend-following tool that helps traders identify market direction and potential reversals using a combination of: Commodity Channel Index (CCI): Detects momentum shifts and confirms trends. Exponential Moving Average (EMA): Acts as a trend filter to enhance signal accuracy. SuperTrend Lines: Visual trend markers for clear buy and sell signals. This indicator provides real-time alerts and visual markers to help traders reco
ocket Options GreenLine Strategy – SMA(7) Crossover & Trend Alert Indicator Latest Updates: Added Sell Alerts within an Uptrend – If MA1 crosses below MA2 without going below MA3, a Sell Alert is triggered. Enhanced Alert Logic – Prevents duplicate buy and sell icons on every candle. Improved Print Statement – Alerts now log directly to alerts.txt for future reference. Now Compatible with Heiken Ashi and Regular Candles. Overview The Pocket Options GreenLine Strategy is a trend-following indic
Overview Pullback Rejection v2.0 is a professional-grade visual indicator that spots continuation setups after pullbacks using Heiken Ashi logic and multi-EMA trend bias. It is designed for scalpers and intraday traders who want clean, rule-based BUY and SELL signals aligned with trend direction only — no repainting, no noise, no counter-trend traps.  Trading Concept The indicator combines EMA 7, EMA 50, and EMA 200 to define directional bias: Bias Condition Trades Allowed Bullish EMA7 > EMA200
Filtro:
Nessuna recensione
Rispondi alla recensione