ASPCT Boom Crash Omniscope

ASPCT Boom Crash Omniscope

Description

ASPCT Boom Crash Omniscope is a scalping indicator designed to analyze and visualize price movements on the Boom and Crash indices. The indicator tracks six different indices: Boom 1000, Boom 500, Boom 300, Crash 1000, Crash 500 and Crash 300.

Peculiarities

  • Display signals for six different Boom and Crash indices
  • Using color indicators to indicate different market conditions
  • Separate indicator window with buttons for quick switching between symbols
  • Works exclusively on the M1 timeframe

Parameters

  • Bars History : Number of history bars to analyze (default 3000)

Visualization

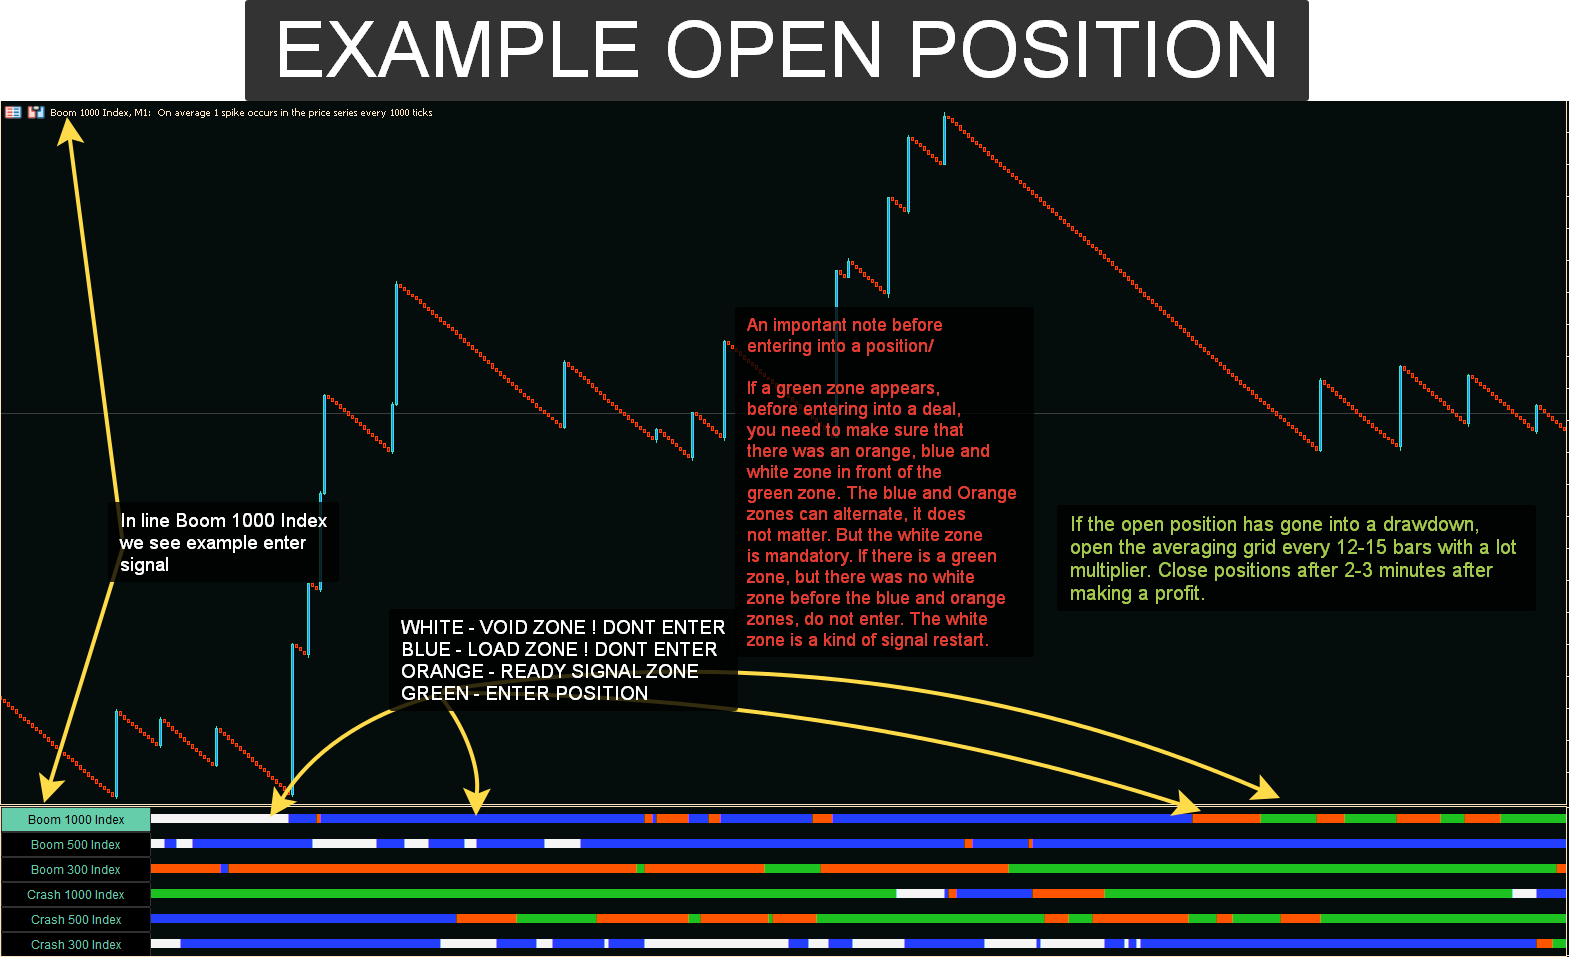
The indicator uses colored arrows to display different market states:

  • White: Reset state. Do not enter.
  • Blue: Loading state. Do not enter.
  • Orange: Stand by. Do not enter.
  • Green: Input signal.

How to use

  1. Add all the mentioned indices to the market overview window. This is necessary for the indicator to work correctly.
  2. Install the indicator on the chart of any of the supported Boom or Crash indices on the M1 timeframe.
  3. The indicator will automatically display signals for all six indices in a separate window.
  4. Use the buttons in the indicator window to quickly switch between different indices.
  5. Pay attention to the sequence of color signals:
    • The correct sequence to enter is: White -> Blue or Orange -> Green
    • The white signal must precede the green signal, but there must be a blue or orange signal between them.
  6. Trading rules:
    • For Boom indices: Only enter buy when green signal appears after correct sequence.
    • For Crash indices: Only enter sell when green signal appears after correct sequence.
    • After entering a position, if it goes into a drawdown, open an averaging grid every 12-15 candles with a lot multiplier.
    • Close all positions after reaching profit within 2-4 minutes.
    • After working through the green zone, do not re-enter it until the white reset zone appears.

Note

This indicator is designed for use on markets with Boom and Crash indices. Make sure your broker provides access to these instruments before using the indicator. The indicator is designed for scalping and works only on the M1 timeframe.

Disclaimer

Trading on financial markets involves a high level of risk. The author and publisher are not responsible for any losses incurred as a result of using this indicator. The user is fully responsible for his/her trading decisions.


Prodotti consigliati
RSI Currency Strength Meter is a powerful and elegant multi-currency indicator that measures the real-time relative strength of the 8 major currencies using RSI logic. By calculating the smoothed performance of each currency across its major pairs and applying the RSI formula, it delivers clean and responsive strength lines that make it easy to spot which currencies are truly strong or weak at any moment. This indicator is particularly useful for visualizing currency correlations and divergence
Delta Profile Volume
Teresinha Moraes Correia
Technical Description of the Indicator – Delta Profile for MetaTrader 5 The Delta Profile is an indicator developed for MetaTrader 5 focused on detailed analysis of volume flow within a defined range of candles. It organizes and displays information about the imbalance of positive volumes (associated with upward movements) and negative volumes (associated with downward movements) at different price levels. The result is a clear view of the chart points where the highest concentration of trades o
EasyTrading Panel by Vexo
Joseph Brian Ong Gustilo
EasyTrading Panel V3.0 by Vexo — User Guide EasyTrading Panel V3.0 by Vexo — Manual Trade Entry Panel for MetaTrader 5 Works on ANY symbol • Auto Risk Sizing • Volume Profile POC BUY / SELL Market orders with SL → Confirm flow B.LIMIT / S.LIMIT Limit orders with OK / CANCEL buttons Auto POC Volume Profile Point of Control (live) MTF Trend EMA 50/200 on M5 M15 H1 H4 Panel Layout EA: ACTIVE Bal: $37.23 POC: 1.17951 Lot: 0.01 Risk%: 1.0 % RR: 1:2.5 SL: 1.16663 (auto) BUY SELL B.LIMIT S.LIMIT Live a
Was: $249  Now: $99   Market Profile defines a number of day types that can help the trader to determine market behaviour. A key feature is the Value Area, representing the range of price action where 70% of trading took place. Understanding the Value Area can give traders valuable insight into market direction and establish the higher odds trade. It is an excellent addition to any system you may be using. Inspired by Jim Dalton’s book “Mind Over Markets”, this indicator is designed to suit the
ALIEN Dashboard
Youssef Esseghaiar
ALIEN DASHBOARD FULL EDITION – Professional ICT & Precision Trading Dashboard for MT5 ( HYBRID ENGINE ) Overview The   Alien Dashboard Full Edition   is a comprehensive, all‑in‑one technical indicator for MetaTrader 5 that merges the most powerful concepts from Inner Circle Trader (ICT) methodology with advanced precision‑entry logic, multi‑timeframe analysis, and an intuitive on‑chart dashboard. Designed for serious traders who want to visualise institutional order flow, identify high‑probabili
Pipfinite creates unique, high quality and affordable trading tools. Our tools may or may not work for you, so we strongly suggest to try the Demo Version for MT4 first. Please test the indicator prior to purchasing to determine if it works for you. We want your good reviews, so hurry up and test it for free...we hope you will find it useful. Combo Energy Beam with Swing Control Strategy: Confirm swing pullback signals Watch Video: (Click Here) Energy Beam with Trend Laser Strategy: Confirm Tre
"Impulses and Corrections 5" is created to help traders navigate the market situation. The indicator shows multi-time frame upward and downward "Impulses" of price movements. These impulses are the basis for determining the "Base" , which is composed of zones of corrections of price movements, as well as "Potential" zones for possible scenarios of price movement. Up and down impulses are determined based on a modified formula of Bill Williams' "Fractals" indicator. The last impulse is always "U
RBreaker
Zhong Long Wu
RBreaker Gold Indicators is a short-term intraday trading strategy for gold futures that combines trend following and intraday reversal approaches. It not only captures profits during trending markets but also enables timely profit-taking and counter-trend trading during market reversals. This strategy has been ranked among the top ten most profitable trading strategies by the American magazine   Futures Truth   for 15 consecutive years. It boasts a long lifecycle and remains widely used and st
Your Trend Friend
Luigi Nunes Labigalini
5 (1)
The trend is your friend! Look at the color of the indicator and trade on that direction. It does not  repaint. After each candle is closed, that's the color of the trend. You can focus on shorter faster trends or major trends, just test what's most suitable for the symbol and timeframe you trade. Simply change the "Length" parameter and the indicator will automatically adapt. You can also change the color, thickness and style of the lines. Download and give it a try! There are big movements w
Currency Strength Meter is the easiest way to identify strong and weak currencies.   The   indicator shows the relative strength of 8 major currencies: AUD, CAD, CHF, EUR, GBP, JPY, NZD, USD. By default the strength value is normalised to the range from 0 to 100 for RSI algorithm: The value above 60 means strong currency; The value below 40 means weak currency; The indicator is created and optimized for using it externally at an Expert Advisors or as a Custom Indicator inside your programs. Fo
Panoramica Candle Timer Countdown Pro mostra un conto alla rovescia fluido e preciso fino alla chiusura della candela corrente con un arco circolare di progresso. Caratteristiche Conto alla rovescia preciso Arco circolare (Ring o Filled Pie) 6 posizioni disponibili 3 schemi colore Evidenziazione finale Avvisi nuova candela Basso consumo CPU Installazione Scaricare dal MQL5 Market Applicare al grafico Configurare le impostazioni Compatibilità MetaTrader 5 Build 2500+ Tutti i timeframe
PipFinite Trend PRO MT5
Karlo Wilson Vendiola
4.84 (557)
Breakthrough Solution For Trend Trading And Filtering With All Important Features Built Inside One Tool! Trend PRO's smart algorithm detects the trend, filters out market noise and gives entry signals with exit levels. The new features with enhanced rules for statistical calculation improved the overall performance of this indicator. Important Information Revealed Maximize the potential of Trend Pro, please visit www.mql5.com/en/blogs/post/713938 The Powerful Expert Advisor Version Automatin
Ultimate Boom and Crash Indicator The Ultimate Boom and Crash Indicator is a cutting-edge tool developed by  Coetsee Digital , designed to identify potential spike opportunities in the market. Crafted for traders focusing on Deriv and Weltrade synthetic markets, this indicator is optimized to operate exclusively on the 3-minute (M3), 5-minute (M5), 15-minute (M15), 30-minute (M30), and 1-hour (H1) timeframes and supports only the following pairs: PainX 1200, PainX 999, PainX 800, PainX 600, Pai
Strumento Avanzato di Analisi del Profilo dei Volumi per MetaTrader 5 Il Kecia Volume Profile Order Finder offre ai trader funzionalità di analisi del profilo dei volumi. Questo indicatore per MT5 combina la visualizzazione del profilo dei volumi con calcoli statistici per aiutare a identificare potenziali opportunità di trading e suggerisce livelli di entrata, stop loss e take profit basati sulla struttura del mercato. Visualizzazione del Profilo di Mercato Trasforma il tuo grafico con visualiz
Step into the world of Forex trading with confidence, clarity, and precision using Gold Indicator a next-generation tool engineered to take your trading performance to the next level. Whether you’re a seasoned professional or just beginning your journey in the currency markets, Gold Indicator equips you with powerful insights and help you trade smarter, not harder. Built on the proven synergy of three advanced indicators, Gold Indicator focuses exclusively on medium and long-term trends elimina
STRICTLY FOR BOOM INDEX ONLY!!!!! Here I bring the Maximum Trend Arrows OT1.0 MT5 indicator. This indicator is made up of a combination of different trend indicators for entries and exits, for entries an orange arrow will paint on the chart below the current market and a red flag for closing of trades and it produces buy arrows only. When the orange arrow appears, it will appear along with it's sound to notify you. The 1H timeframe is recommended, don't use it anywhere else than on the 1H timefr
CvdDeltaVolumes
Parasbhai N Patel
Delta + CVD & CVD Candles Order-flow indicator combining Delta (Ask–Bid), Cumulative Volume Delta (CVD), and a unique CVD-based synthetic candle system. Shows buy/sell pressure, volume aggressiveness, and momentum shifts with optional Delta histogram, CVD line, and CVD+Delta combined candles. Useful for scalping, intraday trading, divergence detection, and understanding buyer/seller dominance. Overview The Delta + CVD & CVD Candles Indicator combines multiple order-flow tools into one clean
The Super Arrow Indicator provides non-repainting buy and sell signals with exceptional accuracy. Key Features No repainting – confirmed signals remain fixed Clear visual arrows: green for buy, red for sell Real-time alerts via pop-up, sound, and optional email Clean chart view with no unnecessary clutter Works on all markets: Forex, gold, oil, indices, crypto Adjustable Parameters TimeFrame Default:   "current time frame" Function:   Sets the time frame for indicator calculation Options:   Can
Price Magnet — Price Density and Attraction Levels Indicator Price Magnet is a professional analytical tool designed to identify key support and resistance levels based on statistical Price Density. The indicator analyzes a specified historical period and detects price levels where the market spent the most time. These zones act as “magnets,” attracting price action or forming a structural base for potential reversals. Unlike traditional Volume Profile tools, Price Magnet focuses on price-time d
Visual CrossPulse Dynamics Indicator
AL MOOSAWI ABDULLAH JAFFER BAQER
Visual CrossPulse Dynamics: Trade with the Market's True Rhythm Unlock a new level of market insight with Visual CrossPulse Dynamics, a sophisticated trading indicator designed to adapt to ever-changing volatility and reveal the true direction of the trend. Are you tired of indicators that lag in fast-moving markets or give false signals during consolidation? The Visual CrossPulse Dynamics indicator solves this problem by using an advanced, adaptive algorithm that intelligently adjusts to the m
Monitor your order
Eslam Mohamed Hassanein Hassan Aly
Advanced Lot & Profit Monitor PRO is a powerful MT5 indicator that provides real-time monitoring of your trading positions directly on the chart. It displays the number of orders, total lot sizes, and profit (including swap) for Buy and Sell positions separately, as well as the overall account performance. Designed with a clean and customizable interface, this tool helps traders stay in control of their exposure and risk at all times. Key Features: Real-time monitoring of open positions Sepa
PipFinite Razor Scalper MT5
Karlo Wilson Vendiola
2 (1)
Pipfinite creates unique, high quality and affordable trading tools. Our tools may or may not work for you, so we strongly suggest to try the Demo Version for MT4 first. Please test the indicator prior to purchasing to determine if it works for you. We want your good reviews, so hurry up and test it for free...we hope you will find it useful. Combo Razor Scalper with Trend Laser Strategy: Scalp in the direction of the trend Watch Video: (Click Here) Features Scalping indicator using a confirme
The VWAP indicator is our version of the popular Volume-Weighted Average Price indicator. The VWAP is the ratio between the value traded (price multiplied by the number of volume traded) and the total volume traded over a specific time period. As a result, it measures the average price of the instrument much better than the simple moving average. Although there are many ways to use the VWAP, most investors use it to calculate the daily average.  The indicator works in five modes: Moving  - In
Planetary Declination Panel for MetaTrader 5 Discover the most advanced and accurate astrological indicator for MetaTrader 5 — Planetary Declination Panel. Built on precise mathematical algorithms, it calculates real-time celestial declinations of the Sun, Moon, Mercury, Venus, Mars, Jupiter, Saturn, Chiron, and Ceres with professional-grade precision. In a clean dedicated sub-window, elegant and highly visible colored lines plot the declination movements across any timeframe, allowing you to vi
VOLUME PROFILE SAF-XII                            Professional Market Profile Analysis for MT5           WHAT IS VOLUME PROFILE? Volume Profile is a professional institutional tool that displays trading activity at specific price levels, unlike traditional volume indicators that show volume over time. It reveals WHERE trading occurred, within your window of choice, helping identify:   • FAIR VALUE AREAS (VAH/VAL) - Price levels where most trading occurred • POINT OF CONTROL (POC) - The
Volume Profile V6
Andrey Kolesnik
4.67 (3)
Indicatore del profilo di volume del mercato + oscillatore intelligente. Funziona su quasi tutti gli strumenti: coppie di valute, azioni, futures, criptovalute, sia su volumi reali che su tick. È possibile impostare la definizione automatica dell'intervallo di costruzione del profilo (ad esempio, per una settimana o un mese, ecc.), oppure impostare l'intervallo manualmente spostando i confini (due linee verticali: rossa e blu). Viene visualizzato sotto forma di istogramma. La larghezza dell'isto
Support Resistance Pro Toolkit Donchian is a support and resistance indicator for MetaTrader 5 designed to highlight important market zones using a Donchian-based swing detection model. It draws clean support and resistance levels or zones directly on the chart, tracks broken structures, identifies sweep events, and provides a live dashboard with useful statistics. Pricing Launch Price : $33 Incremental Price Increase : The price will increase by $10 after every 10 purchases. Final Price : $69 T
# DRAWDOWN INDICATOR V4.0 - The Essential Tool to Master Your Trading ## Transform Your Trading with a Complete Real-Time Performance Overview In the demanding world of Forex and CFD trading, **knowing your real-time performance** isn't a luxury—it's an **absolute necessity**. The **Drawdown Indicator V4.0** is much more than a simple indicator: it's your **professional dashboard** that gives you a clear, precise, and instant view of your trading account status. --- ## Why This Indicator
SMC Buy Sell Indicator SMC Buy Sell Indicator is a price action-based trading tool designed to identify market structure using Smart Money Concepts. It focuses on detecting meaningful swing points, structural breaks, and confirmation signals directly from chart data. The indicator operates using closed candle data and does not rely on future bars. All calculations are performed on confirmed price action, which helps maintain consistent and stable signals. Key Features Market Structure Detection
Proxy OrderFlow MT5
Vincent Jose Proenca
Indicatore basato sul disequilibrio del tick-spread. TF: Funziona su tutti i timeframe (da M1 a D1). Coppie: Compatibile con Forex, indici, oro e CFD (regolazione automatica per JPY, Oro e CFD). Impostazioni: TickWindow (200) – finestra di osservazione dei tick SpreadWeight (1.5) – peso dello spread NormalizationPeriod (20) – periodo di normalizzazione (z-score) Overbought / Oversold (±3.0) – soglie di allerta AlertCooldown (300s) – tempo di raffreddamento tra gli avvisi Conclusione: Proxy Or
Gli utenti di questo prodotto hanno anche acquistato
SignalTech MT5 is a trading system for EURUSD, USDCHF, USDJPY, AUDUSD, NZDUSD, EURJPY, AUDJPY, NZDJPY, CADJPY H2 and H3 Timeframe.  It can generate signals with Buy/Sell Arrows and Pop-Up/Sound Alerts. Each signal has clear Entry and Stop Loss levels, which should be automatically flagged on the chart, as well as potential Targets 1, 2, and 3. The Entry and TP levels are fixed after the trade is taken. The exit level is dynamic. If there are signs of a potential short-term trend reversal, the
OmniSync Projection
Antonio-alin Teculescu
5 (1)
Chronos Fractal Engine is an innovative price projection indicator for MetaTrader 5, designed to transform your technical analysis by intelligently identifying and projecting historical price patterns. Built upon an advanced correlation algorithm and the fractal principles of the market, this powerful tool visualizes potential future price movements, giving you a unique edge in your trading decisions. What is Chronos Fractal Engine? At its core, the Chronos Fractal Engine employs a sophisticat
Azimuth Pro
Ottaviano De Cicco
5 (7)
Azimuth Pro V2: Synthetic Fractal Structure and Confirmed Entries for MT5 Overview Azimuth Pro is a multi-level swing structure indicator by Merkava Labs . Four nested swing layers, swing-anchored VWAP, ABC pattern detection, three-timeframe structural filtering, and closed-bar confirmed entries — one chart, one workflow from micro-swings to macro-cycles. This is not a blind signal product. It is a structure-first workflow for traders who care about location, context, and timing. V2 Launch Offe
Innanzitutto, vale la pena sottolineare che questo Strumento di Trading è un Indicatore Non-Ridipingente, Non-Ridisegnante e Non-Laggante, il che lo rende ideale per il trading professionale. Corso online, manuale utente e demo. L'Indicatore Smart Price Action Concepts è uno strumento molto potente sia per i nuovi che per i trader esperti. Racchiude più di 20 utili indicatori in uno solo, combinando idee di trading avanzate come l'Analisi del Trader del Circolo Interno e le Strategie di Tradin
RelicusRoad Pro: Sistema Operativo Quantitativo di Mercato 70% DI SCONTO ACCESSO A VITA (TEMPO LIMITATO) - UNISCITI A 2.000+ TRADER Perché la maggior parte dei trader fallisce anche con indicatori "perfetti"? Perché operano su Singoli Concetti isolati. Un segnale senza contesto è una scommessa. Per vincere serve CONFLUENZA . RelicusRoad Pro non è un semplice indicatore. È un Ecosistema Quantitativo completo . Mappa la "Fair Value Road", distinguendo tra rumore e rotture strutturali. Smetti di in
ARICoins
Temirlan Kdyrkhan
ARICoin is a powerful trading companion designed to generate high-probability entry signals with dynamic TP/SL/DP levels based on volatility. Built-in performance tracking shows win/loss stats, PP1/PP2 hits, and success rates all updated live. Key Features: Buy/Sell signals with adaptive volatility bands Real-time TP/SL/DP levels based on ATR Built-in MA Filter with optional ATR/StdDev volatility Performance stats panel (Success, Profit/Loss, PP1/PP2) Alerts via popup, sound, push, or email Cust
L'indicatore " Dynamic Scalper System MT5 " è progettato per il metodo di scalping, ovvero per il trading all'interno di onde di trend. Testato sulle principali coppie di valute e sull'oro, è compatibile con altri strumenti di trading. Fornisce segnali per l'apertura di posizioni a breve termine lungo il trend, con ulteriore supporto al movimento dei prezzi. Il principio dell'indicatore. Le frecce grandi determinano la direzione del trend. Un algoritmo per generare segnali per lo scalping sott
KT Alpha Hunter Arrows MT5
KEENBASE SOFTWARE SOLUTIONS
La maggior parte degli indicatori a frecce ti dà un segnale e poi ti lascia capire da solo tutto il resto. KT Alpha Hunter Arrows ti offre un piano di trading completo. Ogni freccia di segnale appare con un piano completo già disegnato: linea di ingresso, stop loss, quattro livelli di take profit e un verdetto live sull’edge, che ti indica se quel simbolo e quel timeframe meritano davvero di essere tradati in quel momento. Il Trade Manager EA incluso gestisce l’esecuzione dopo il tuo ingresso, c
Meravith MT5
Ivan Stefanov
5 (1)
Strumento per market maker. Meravith: Analizzerà tutti i timeframe e mostrerà il trend attualmente in corso. Evidenzierà le zone di liquidità (equilibrio dei volumi) dove i volumi rialzisti e ribassisti sono uguali. Mostrerà tutti i livelli di liquidità dei diversi timeframe direttamente sul grafico. Genererà e presenterà un’analisi di mercato testuale a scopo di riferimento. Calcolerà obiettivi, livelli di supporto e punti di stop-loss in base al trend attuale. Calcolerà il rapporto rischio/ren
Fusion Monthly Levels + PinBar + Marubozu Descrizione Questo indicatore unico combina tre potenti strumenti di analisi tecnica in uno solo: Livelli mensili (High, Low, Open, Close) – per identificare zone chiave di supporto e resistenza. Rilevamento PinBar – pattern di candela affidabile che segnala rifiuti di prezzo. Rilevamento Marubozu – candele di forte tendenza che indicano momentum direzionale. Grazie a questa fusione, ottieni uno strumento visivo, completo e reattivo per anticipare
CGE Trading Suite
Carl Gustav Johan Ekstrom
5 (2)
Institutional-Grade Analytics for MT5 C GE Trading Suite delivers the analytical edge typically reserved for professional trading desks. The platform integrates a full suite of analytical tools into one seamless workflow: dynamic grid mapping, liquidity behavior analysis, ECM, trend lines, MIDAS, trade cycles, and directional channel projections. Together, these provide a unified view of market structure and momentum. Directional clarity is further enhanced by the capital flow index, which meas
AriX
Temirlan Kdyrkhan
1 (4)
AriX Indicator for MT5 A powerful trend-following and signal-evaluation tool AriX is a custom MT5 indicator that combines Moving Averages and ATR-based risk/reward logic to generate clear buy/sell signals. It visualizes dynamic SL/TP levels, evaluates past trade outcomes, and displays win/loss statistics in a clean on-chart panel. Key features include: Buy/Sell signals based on MA crossovers ATR-based SL/TP1/TP2/TP3 levels with visual lines and labels Signal outcome tracking with real-time stat
The Propfolio Master Suite is the ultimate all-in-one analytical workstation for professional traders. Combining the power of the Beat The Market Maker (BTMM) methodology, Smart Money Concepts (SND/Liquidity), and Advanced Volume Profile, this suite replaces a dozen different indicators with one heavily optimized, beautifully designed engine. Monitor up to 14 pairs simultaneously from a single chart, instantly identify market cycles, and seamlessly map institutional footprints with the click of
Ziva LSE System
Hassan Abdullah Hassan Al Balushi
ZIVA LSE System A Professional Liquidity & Structure Execution Framework Executive Overview ZIVA LSE System is a professionally engineered analytical framework designed to interpret market behavior through structural logic and liquidity dynamics. It is not positioned as a conventional indicator. Rather, it functions as a structured execution environment that organizes price action into a clear, disciplined decision-making model. The system is built to deliver consistency, clarity, and controlled
TPA True Price Action indicator reveals the true price action of the market makers through 100% non-repainting signals strictly at the close of a candle! TPA shows entries and re-entries, every time the bulls are definitely stronger than the bears and vice versa. Not to confuse with red/green candles. The shift of power gets confirmed at the earliest stage and is ONE exit strategy of several. There are available now two free parts of the TPA User Guide for our customers. The first "The Basics"
Footprint is an indicator for order flow and volume analysis. It helps identify market structure at the cluster level, find key zones with increased activity, and work with filters directly on the chart without constantly opening the settings window. Footprint Indicator Features cluster-based Bid x Ask and Delta charts; on-chart control panel; sliders for filter adjustments; Absorption; Initiative; Stacked Imbalances; Big Trades; dPOC / Dynamic Point of Control; Delta; side market profile; cumul
Presenting one-of-a-kind Gann Indicator for XAUUSD IQ Gold Gann Levels is a non-repainting, precision tool designed exclusively for XAUUSD/Gold intraday trading. It uses W.D. Gann’s square root method to plot real-time support and resistance levels, helping traders spot high-probability entries with confidence and clarity. William Delbert Gann (W.D. Gann) was an exceptional market analyst whose trading technique was based on a complex blend of mathematics, geometry, astrology, and ancient calcul
Kalman Adaptive Zones — Bande di Probabilità Quantitative Smetti di indovinare dove andrà il prezzo. Inizia a capire dove dovrebbe trovarsi statisticamente. Kalman Adaptive Zones (KAZ) è un indicatore quantitativo professionale che disegna bande di probabilità intelligenti attorno al prezzo — bande che si adattano automaticamente alle condizioni di mercato in tempo reale. A differenza delle Bollinger Bands o delle Keltner Channels, che utilizzano periodi di retrospettiva fissi, KAZ combina più
Pantera Indicator
Temirlan Kdyrkhan
5 (1)
A tool for on-chart strategy backtesting and performance analysis. A utility for developing, debugging, and testing custom trading ideas and indicator functions. An indicator designed to quickly test trading concepts and visualize the effectiveness of different input parameters. An all-in-one sandbox for testing everything from simple crossovers to complex, multi-condition trading systems.
L’indicatore evidenzia le zone in cui viene dichiarato interesse sul mercato , per poi mostrare la zona di accumulo degli ordini . Funziona come un book degli ordini su larga scala . Questo è l’indicatore per i grandi capitali . Le sue prestazioni sono eccezionali. Qualsiasi interesse ci sia nel mercato, lo vedrai chiaramente . (Questa è una versione completamente riscritta e automatizzata – non è più necessaria un’analisi manuale.) La velocità di transazione è un indicatore concettualmente nuo
TrendMaestro5
Stefano Frisetti
Attenzione alle truffe, questo indicatore e' distribuito esclusivamente su MQL5.com nota: questo indicatore e' per METATRADER5, se vuoi la versione per  METATRADER4 questo e' il link:   https://www.mql5.com/it/market/product/108106 TRENDMAESTRO ver 2.5 TRENDMAESTRO   riconosce un nuovo TREND sul nascere, non sbaglia mai. La sicurezza di identificare un nuovo TREND non ha prezzo. DESCRIZIONE TRENDMAESTRO identifica un nuovo TREND sul nascere, questo indicatore prende in esame la volatilita' i
IVISTscalp5
Vadym Zhukovskyi
5 (6)
iVISTscalp5 — Sistema di previsione del mercato basato sul tempo iVISTscalp5 non è un indicatore tradizionale. È un sistema basato sul tempo per MetaTrader 5, che identifica quando il mercato è più probabile che si muova. ⸻ Caratteristiche  • Timing preciso  • Segnali BUY / SELL  • Potenziale medio di profitto  • Previsioni settimanali  • 120+ strumenti ⸻ Idea chiave Il mercato non si muove solo per il prezzo, ma anche per il tempo ⸻ iVISTscalp5 — Il tuo vantaggio nel tempo
Il livello Premium è un indicatore unico con una precisione superiore all'80% delle previsioni corrette! Questo indicatore è stato testato dai migliori Specialisti di Trading per più di due mesi! L'indicatore dell'autore che non troverai da nessun'altra parte! Dagli screenshot puoi vedere di persona la precisione di questo strumento! 1 è ottimo per il trading di opzioni binarie con un tempo di scadenza di 1 candela. 2 funziona su tutte le coppie di valute, azioni, materie prime, criptovalu
Shogun Trade Pro
Yuki Miyake
5 (2)
SHOGUN Trade Pro – 16 Years of Unadjusted Precision. Strategic Market Structure & the Mastery of "Small Losses, Big Profits." March Special Sale – Special Price:  (Regular Price: $299)! This special offer is for a limited time only. We are currently focusing on further product development and optimization. To incorporate valuable feedback from our users into the product, we are offering this discounted price on the condition of your cooperation with a review. Your opinions will be directly util
Real Spread Monitor is a powerful indicator that is designed to accurately measure and analyze real spreads, giving traders the ability to compare trading conditions of different brokers. This product is also available for MetaTrader 4 =>  https://www.mql5.com/en/market/product/125769 Key Features of Real Spread Monitor: 1. Two modes of operation: Write mode : In this mode the indicator collects data on real spreads of the selected trading instrument and records them in a file. The spread is r
ZIVA Signal Intelligence
Hassan Abdullah Hassan Al Balushi
ZIVA Signal Intelligence An Adaptive, Modular Market Intelligence System ZIVA Signal Intelligence is not positioned as a conventional trading indicator. It is a fully integrated, proprietary market intelligence system engineered to deliver structured, high-precision interpretation of price behavior within a controlled analytical environment. Developed through an independent architectural approach, ZIVA does not rely on, derive from, or replicate existing indicators. It represents a standalone
FX Analysis is an all-in-one MT5 indicator dashboard that combines eight analytical tools in a single panel, helping traders identify high-probability setups without switching between charts or indicators. Designed for standard forex pairs on MetaTrader 5. Best results on M15 - H4 timeframes when all components are used together as part of the included workflow. Components Volatility Analyzer Displays historical average movement by hour and by day of the week. A real-time Pip Balance shows the
Ultimate SMC Indicator
Hicham Mahmoud Almoustafa
1 (1)
Ultimate SMC Indicator v2.20 — Smart Money Concepts All-in-One Stop switching between 5 different indicators. Ultimate SMC gives you everything Smart Money traders need — in one clean indicator with interactive controls. GUIDE What makes this different? Most SMC indicators show you Order Blocks or FVGs separately. You still have to figure out which zones actually matter. Ultimate SMC does the hard work: it scans for Order Blocks, Fair Value Gaps, Liquidity Sweeps, Supply & Demand zones, Fibo
Introduction to X3 Chart Pattern Scanner X3 Cherart Pattern Scanner is the non-repainting and non-lagging indicator detecting X3 chart patterns including Harmonic pattern, Elliott Wave pattern, X3 patterns, and Japanese Candlestick patterns. Historical patterns match with signal patterns. Hence, you can readily develop the solid trading strategy in your chart. More importantly, this superb pattern scanner can detect the optimal pattern of its kind. In addition, you can switch on and off individu
SunSignal ML — AI Gold Signals with Multi-Timeframe Confluence SunSignal ML is an advanced AI-powered signal indicator purpose-built for XAUUSD gold trading. It combines a proprietary adaptive trend algorithm with six machine learning models trained on confirmed price pivots to produce high-confidence entry signals with multi-timeframe validation. The indicator runs efficiently on M1, M5 and M15 timeframes and is designed for traders who want precision entries guided by data rather than guesswor
Altri dall’autore
Good day! I present to you a trading technical indicator for Deriv broker synthetic indices. This indicator ONLY works with the following indices: Boom 300 Index Boom 500 Index Boom 1000 Index Crash 300 Index Crash 500 Index Crash 1000 Index The indicator was created to give signals to open medium-term trades in the direction of Spikes. But you can open trades in the opposite direction to Spikes, at your own risk. Trade only on M1. Other TFs do not guarantee the correct operation of the indica
Indicator for Boom and Crash Synthetic Indices The indicator will be sold in a limited quantity. We present a specialized technical indicator designed exclusively for Boom and Crash synthetic indices offered by Deriv broker. This tool is tailored for traders who prefer a methodical approach to trading with clearly defined price levels. Indicator Functionality: • Displays key price levels for position entry • Indicates levels for position averaging • Determines optimal stop-loss levels
Filtro:
Nessuna recensione
Rispondi alla recensione